 7
7peptides
spectra
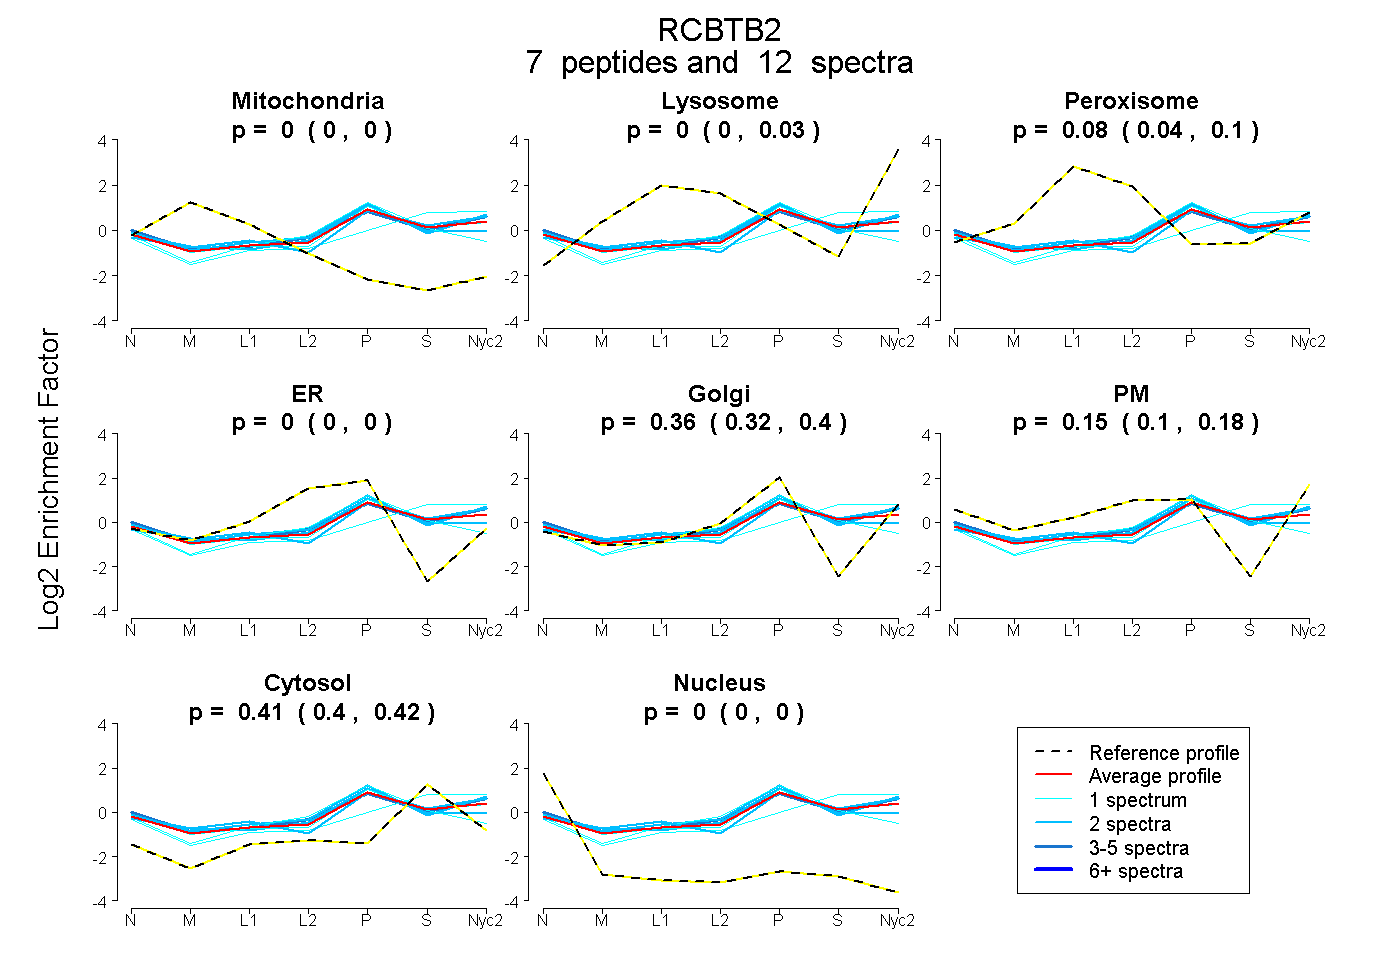
0.000 | 0.000
0.000 | 0.025
0.043 | 0.095
0.000 | 0.000
0.315 | 0.399
0.098 | 0.183
0.398 | 0.424
0.000 | 0.000
2peptides
spectra
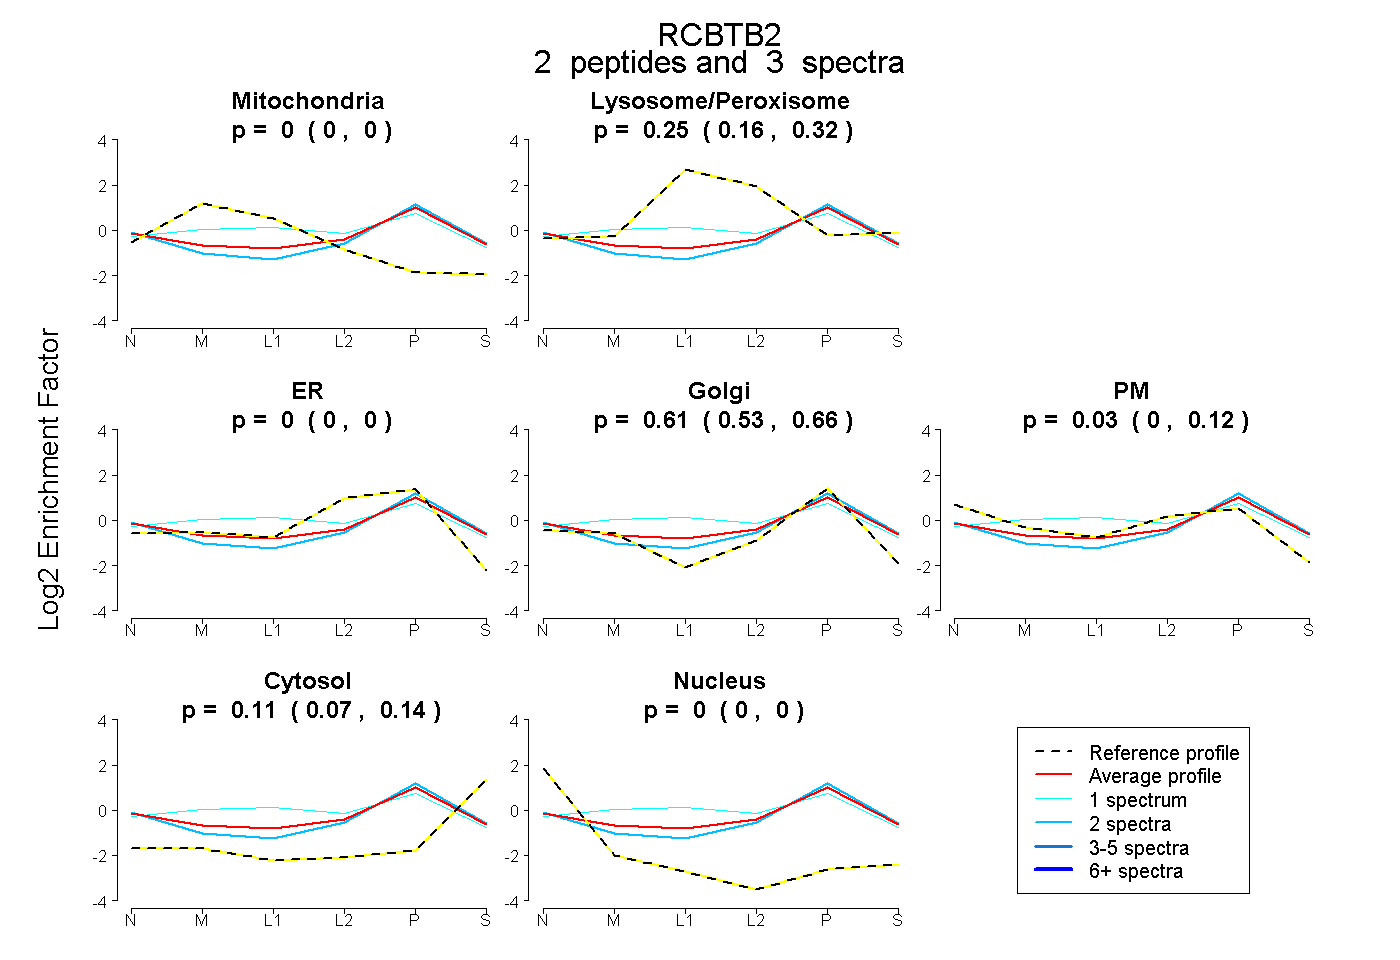
0.000 | 0.000
0.160 | 0.321
0.000 | 0.000
0.529 | 0.657
0.000 | 0.117
0.068 | 0.143
0.000 | 0.004
7peptides
spectra
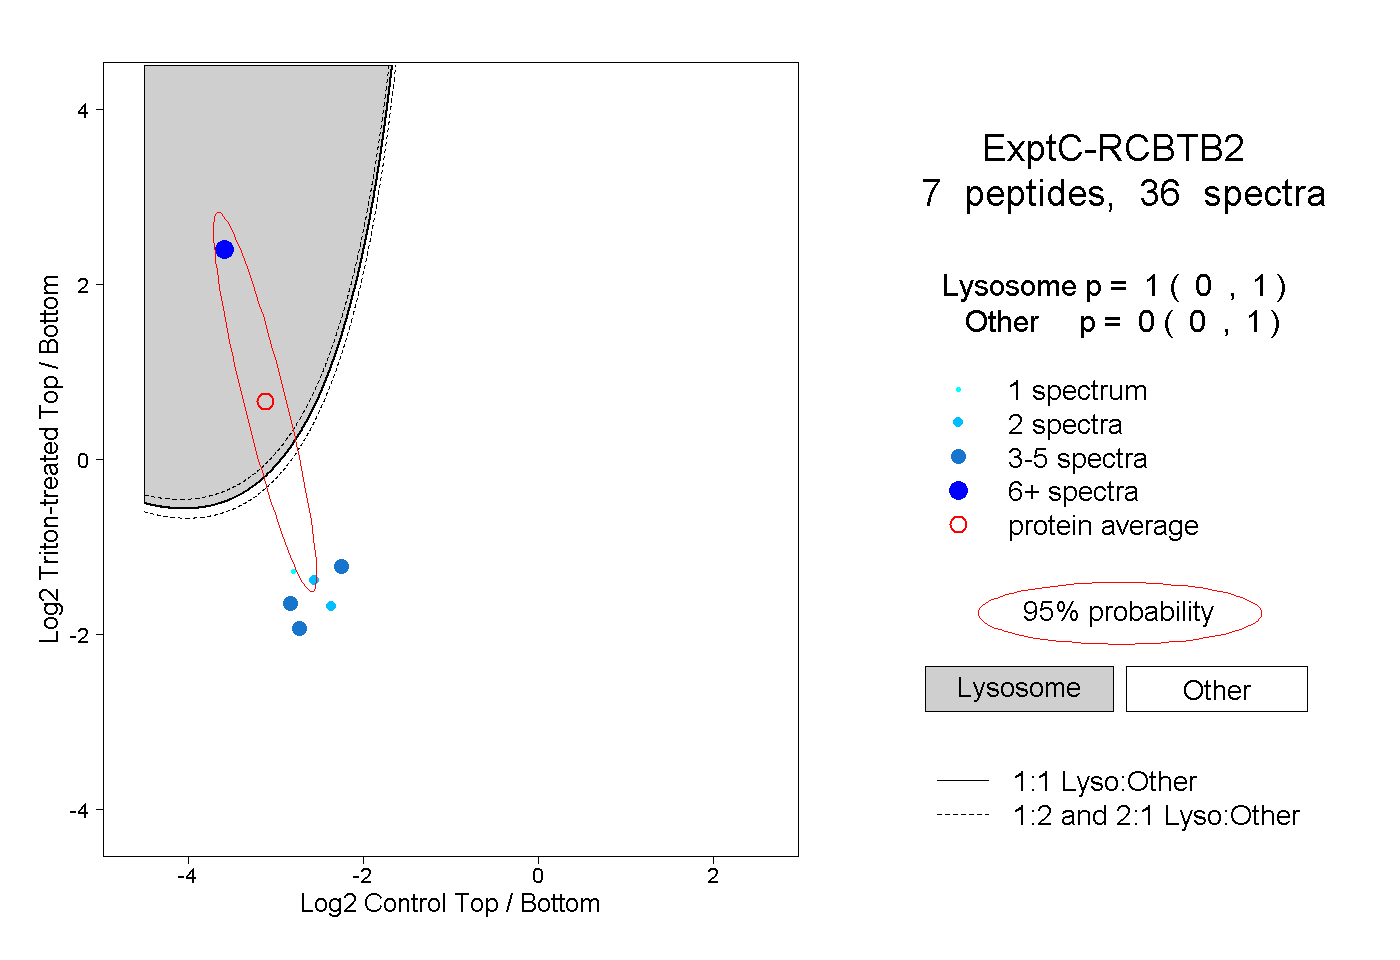
0.000 | 1.000
0.000 | 1.000
2peptides
spectra
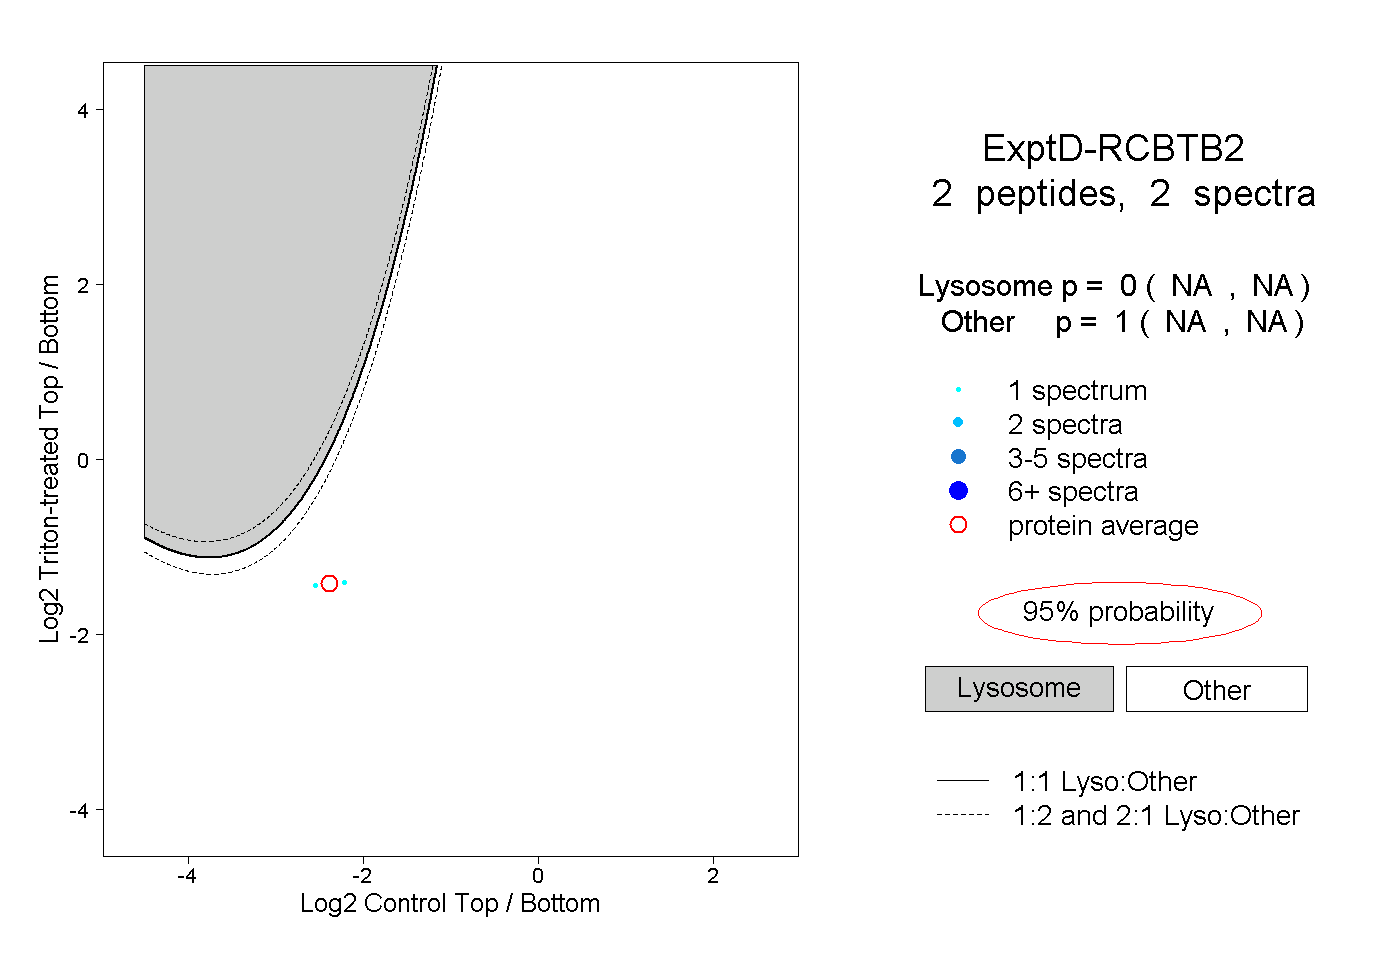
NA | NA
NA | NA