 7
7peptides
spectra
0.000 | 0.000
0.000 | 0.025
0.043 | 0.095
0.000 | 0.000
0.315 | 0.399
0.098 | 0.183
0.398 | 0.424
0.000 | 0.000
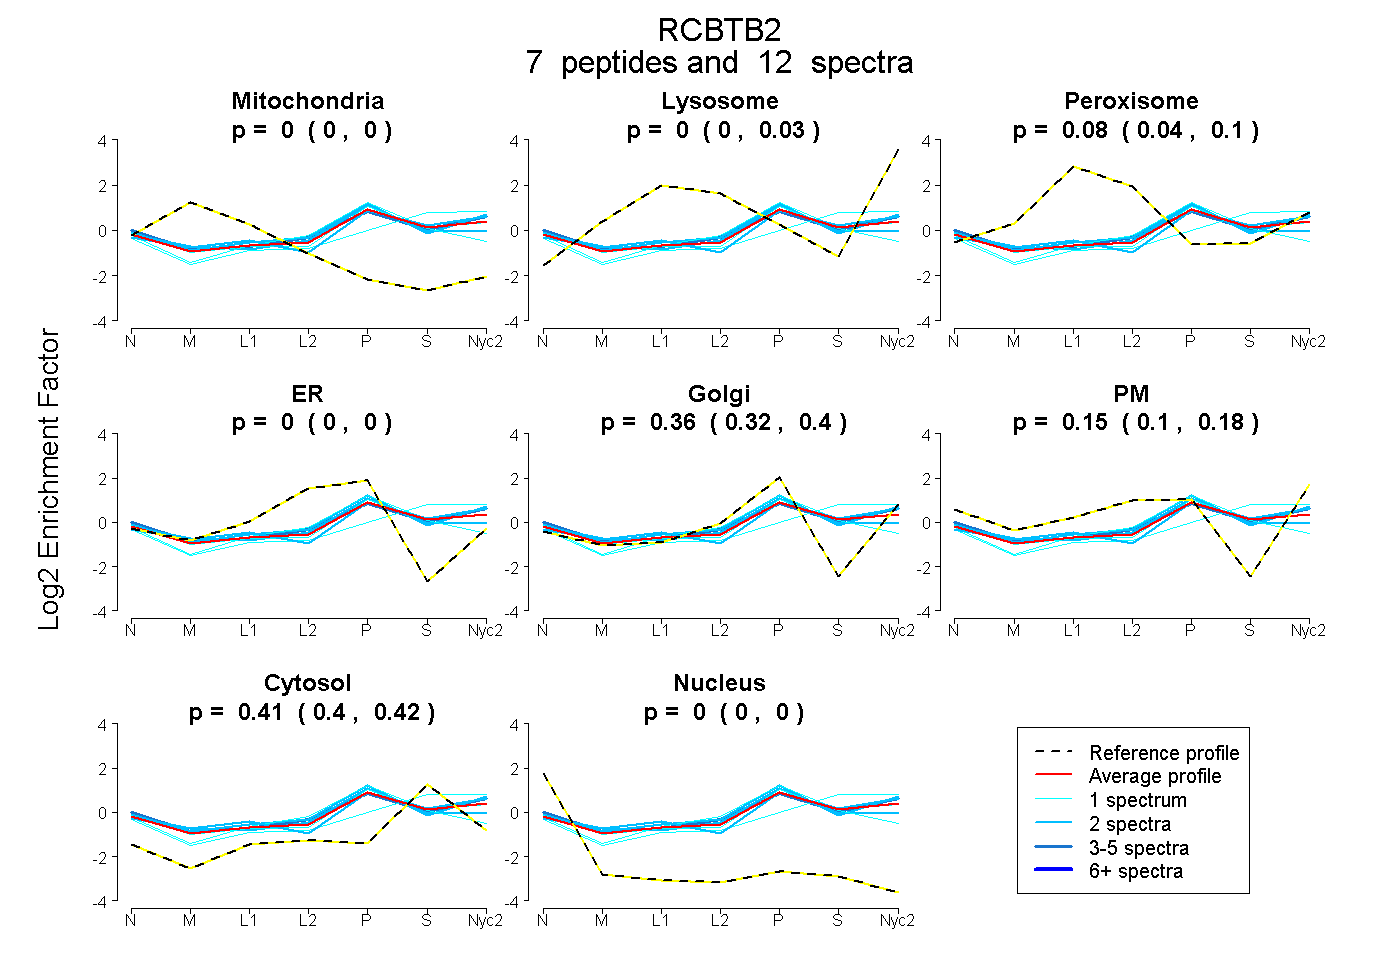
| Plot | Mito | Lyso | Perox | ER | Golgi | PM | Cytosol | Nucleus | |||||
| Expt A |
7 peptides |
12 spectra |
|
0.000 0.000 | 0.000 |
0.000 0.000 | 0.025 |
0.079 0.043 | 0.095 |
0.000 0.000 | 0.000 |
0.360 0.315 | 0.399 |
0.149 0.098 | 0.183 |
0.412 0.398 | 0.424 |
0.000 0.000 | 0.000 |
| 2 spectra, YIYAHK | 0.000 | 0.109 | 0.041 | 0.000 | 0.386 | 0.048 | 0.417 | 0.000 | ||
| 1 spectrum, SNQSYPTPVVVEK | 0.000 | 0.092 | 0.000 | 0.000 | 0.025 | 0.254 | 0.629 | 0.000 | ||
| 3 spectra, EFDNPDTADLK | 0.000 | 0.024 | 0.000 | 0.000 | 0.191 | 0.369 | 0.416 | 0.000 | ||
| 1 spectrum, YDAQDLEEFCFR | 0.014 | 0.000 | 0.057 | 0.084 | 0.408 | 0.000 | 0.436 | 0.000 | ||
| 1 spectrum, QGICEENAIALLSAAVK | 0.000 | 0.000 | 0.096 | 0.000 | 0.477 | 0.047 | 0.380 | 0.000 | ||
| 2 spectra, LCQQTIK | 0.000 | 0.000 | 0.106 | 0.000 | 0.525 | 0.000 | 0.368 | 0.000 | ||
| 2 spectra, FLVDGK | 0.000 | 0.054 | 0.039 | 0.000 | 0.385 | 0.191 | 0.331 | 0.000 |
| Plot | Mito | Lyso or Perox | ER | Golgi | PM | Cytosol | Nucleus | ||||||
| Expt B |
2 peptides |
3 spectra |
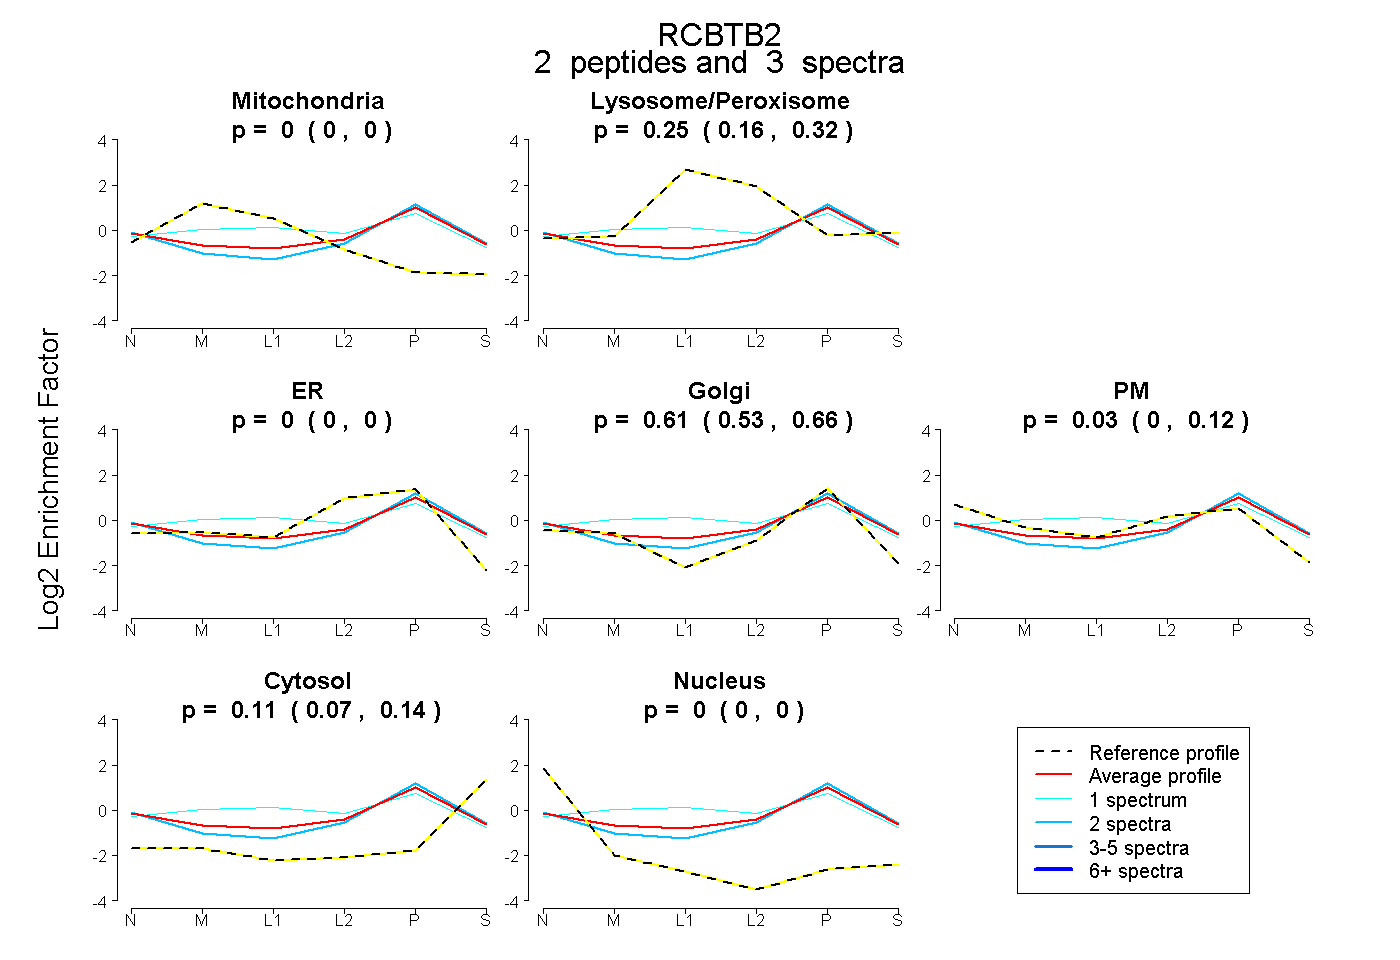 |
0.000 0.000 | 0.000 |
0.253 0.160 | 0.321 |
0.000 0.000 | 0.000 |
0.611 0.529 | 0.657 |
0.028 0.000 | 0.117 |
0.108 0.068 | 0.143 |
0.000 0.000 | 0.004 |
|||
| Plot | Lyso | Other | |||||||||||
| Expt C |
7 peptides |
36 spectra |
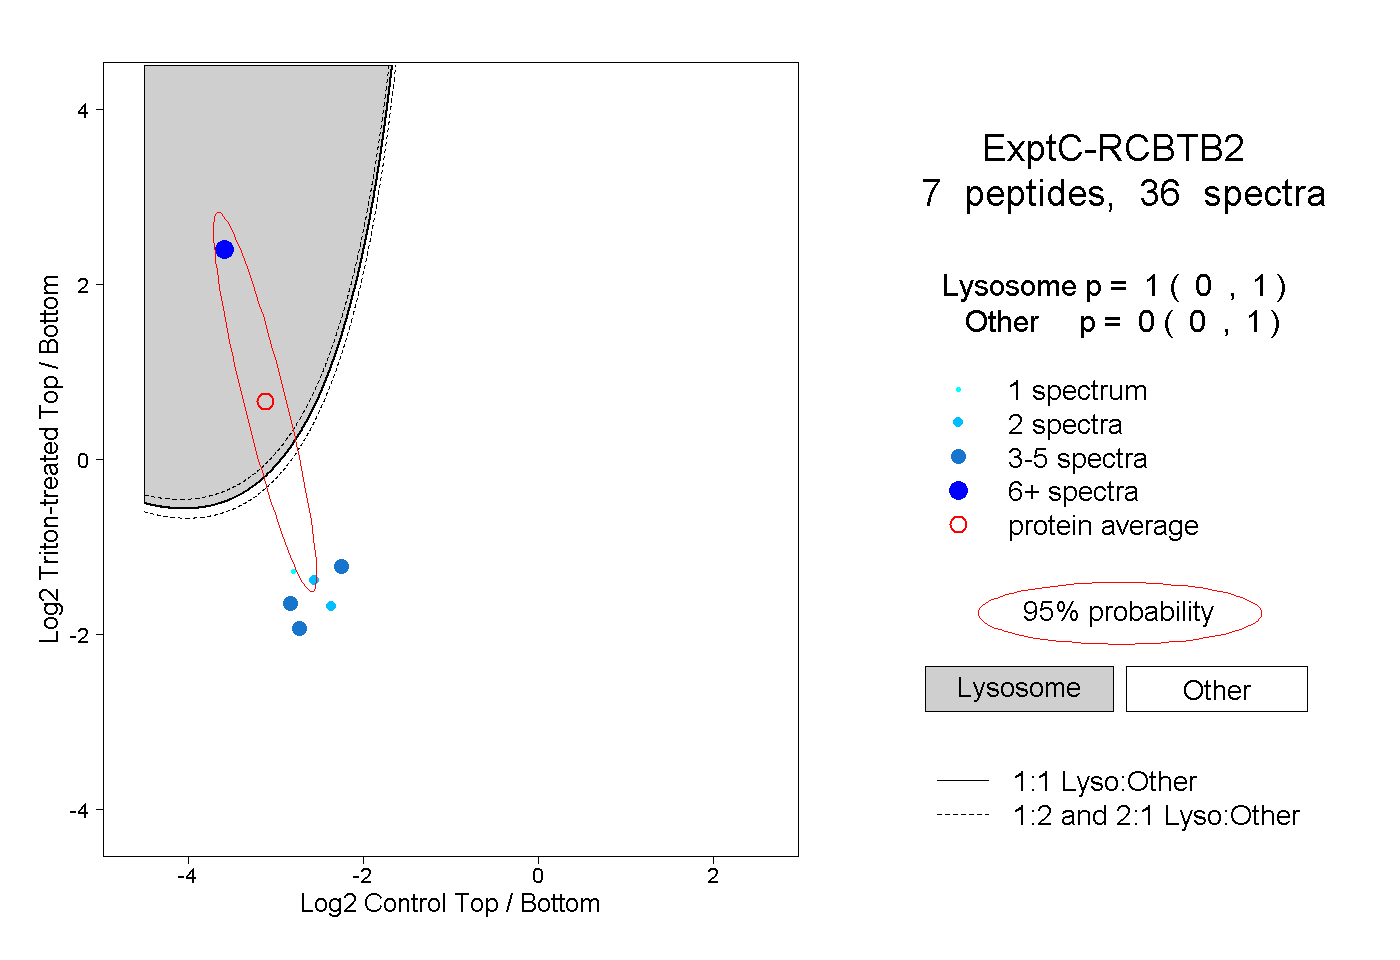 |
1.000 0.000 | 1.000 |
0.000 0.000 | 1.000 |
||||||||
| Plot | Lyso | Other | |||||||||||
| Expt D |
2 peptides |
2 spectra |
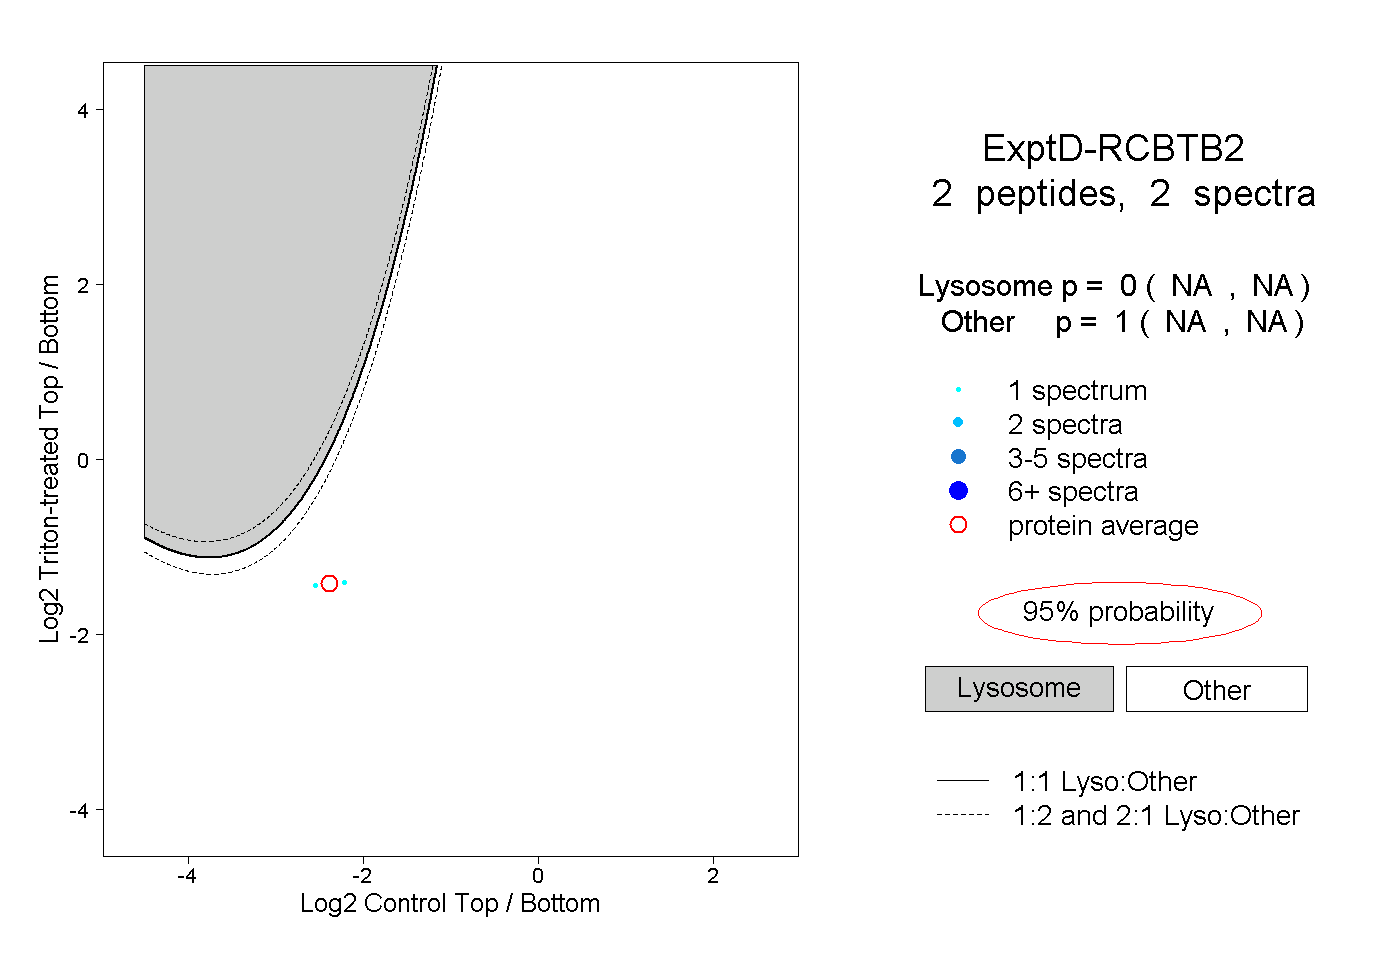 |
0.000 NA | NA |
1.000 NA | NA |