 5
5peptides
spectra
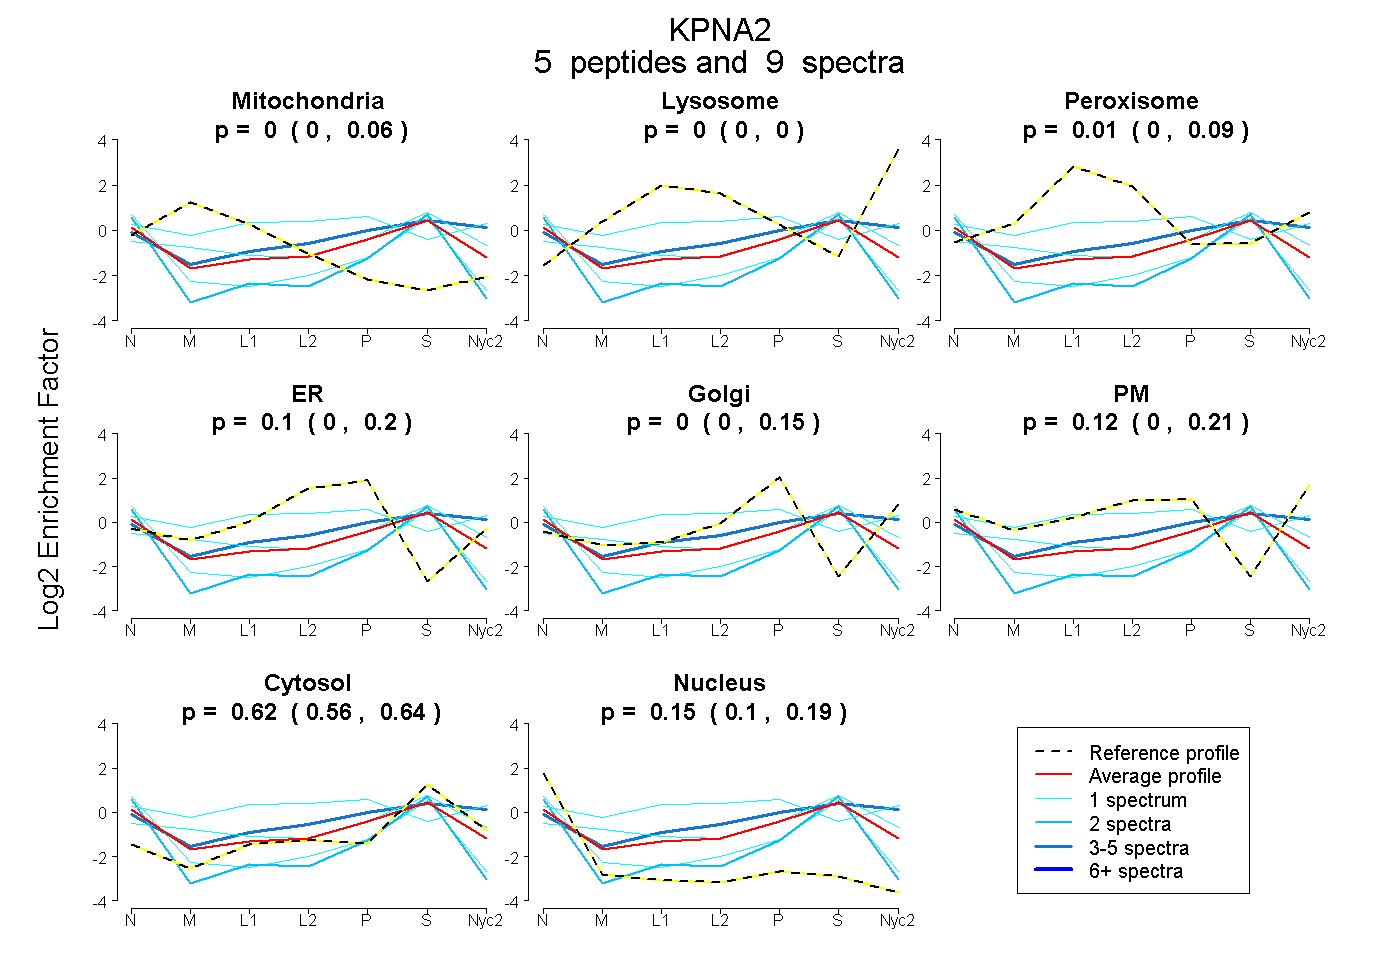
0.000 | 0.057
0.000 | 0.000
0.000 | 0.091
0.000 | 0.196
0.000 | 0.155
0.000 | 0.214
0.558 | 0.642
0.102 | 0.187
1peptide
spectrum
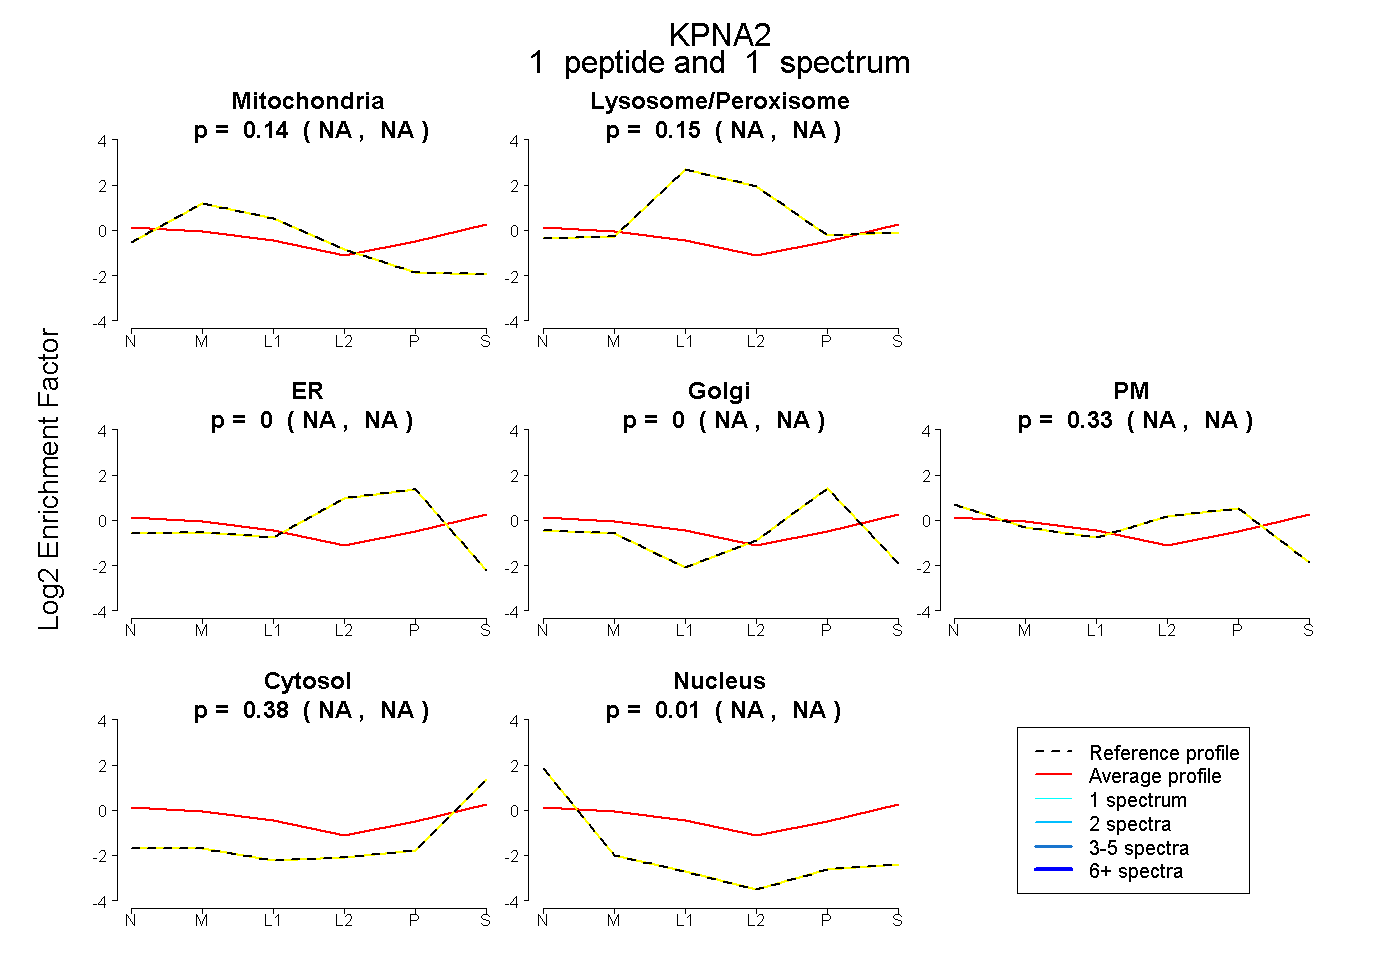
NA | NA
NA | NA
NA | NA
NA | NA
NA | NA
NA | NA
NA | NA
3peptides
spectra
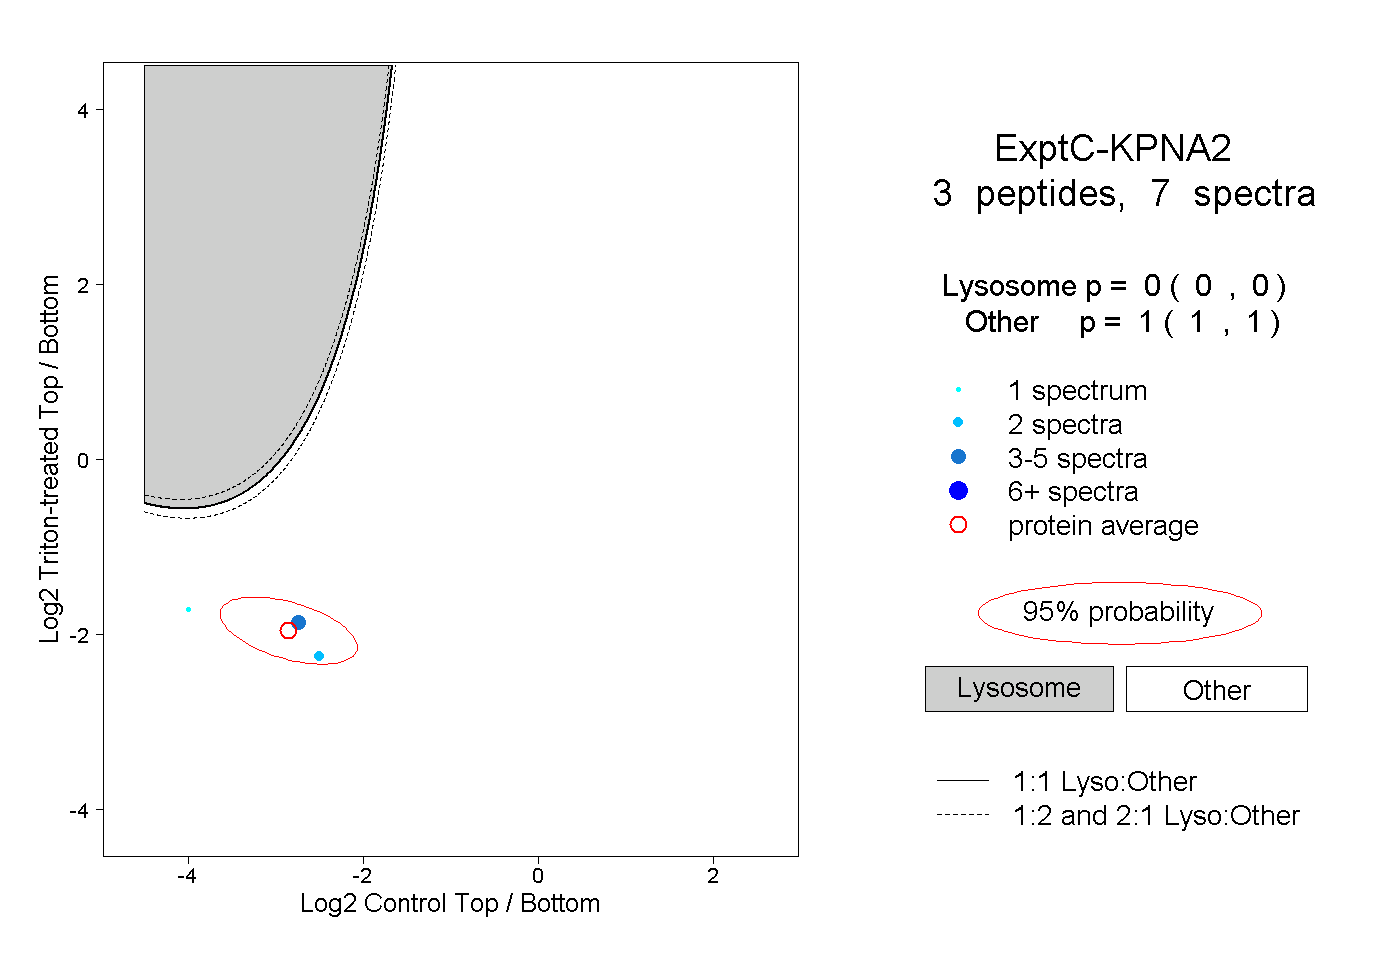
0.000 | 0.000
1.000 | 1.000