 5
5peptides
spectra
0.000 | 0.057
0.000 | 0.000
0.000 | 0.091
0.000 | 0.196
0.000 | 0.155
0.000 | 0.214
0.558 | 0.642
0.102 | 0.187
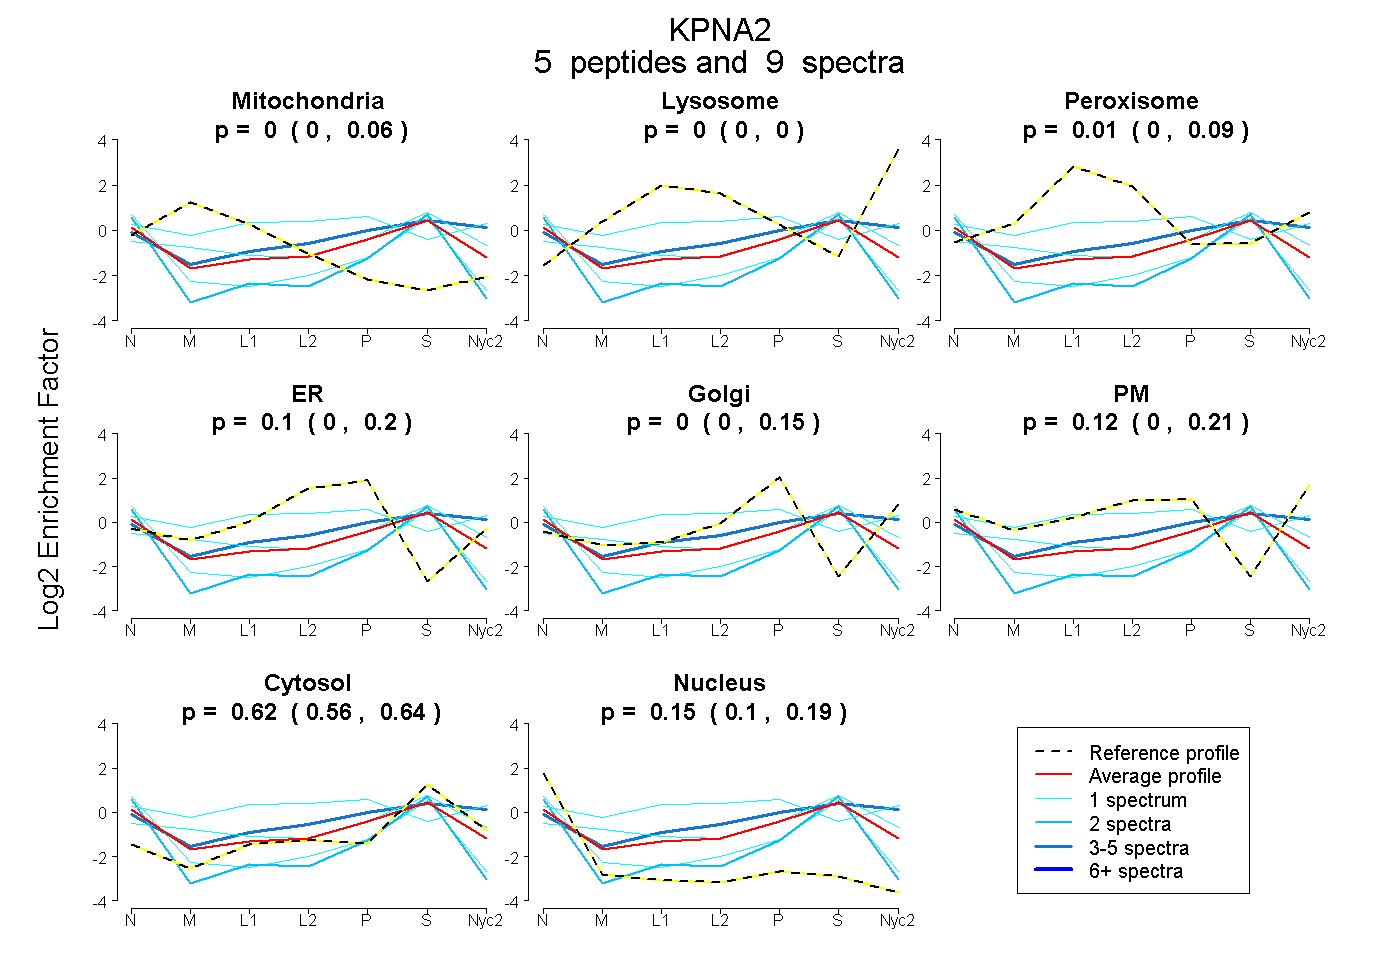
| Plot | Mito | Lyso | Perox | ER | Golgi | PM | Cytosol | Nucleus | |||||
| Expt A |
5 peptides |
9 spectra |
|
0.000 0.000 | 0.057 |
0.000 0.000 | 0.000 |
0.007 0.000 | 0.091 |
0.098 0.000 | 0.196 |
0.000 0.000 | 0.155 |
0.124 0.000 | 0.214 |
0.622 0.558 | 0.642 |
0.149 0.102 | 0.187 |
| 4 spectra, AGLLPK | 0.000 | 0.000 | 0.000 | 0.000 | 0.016 | 0.366 | 0.618 | 0.000 | ||
| 1 spectrum, NVSSFPDDATSPLQENR | 0.019 | 0.000 | 0.288 | 0.019 | 0.153 | 0.289 | 0.232 | 0.000 | ||
| 1 spectrum, FVSFLGK | 0.000 | 0.000 | 0.000 | 0.000 | 0.000 | 0.000 | 0.588 | 0.412 | ||
| 2 spectra, NLTWTLSNLCR | 0.000 | 0.000 | 0.000 | 0.000 | 0.000 | 0.000 | 0.570 | 0.430 | ||
| 1 spectrum, GINSNNLESQLQATQAAR | 0.147 | 0.000 | 0.026 | 0.000 | 0.131 | 0.049 | 0.647 | 0.000 |
| Plot | Mito | Lyso or Perox | ER | Golgi | PM | Cytosol | Nucleus | ||||||
| Expt B |
1 peptide |
1 spectrum |
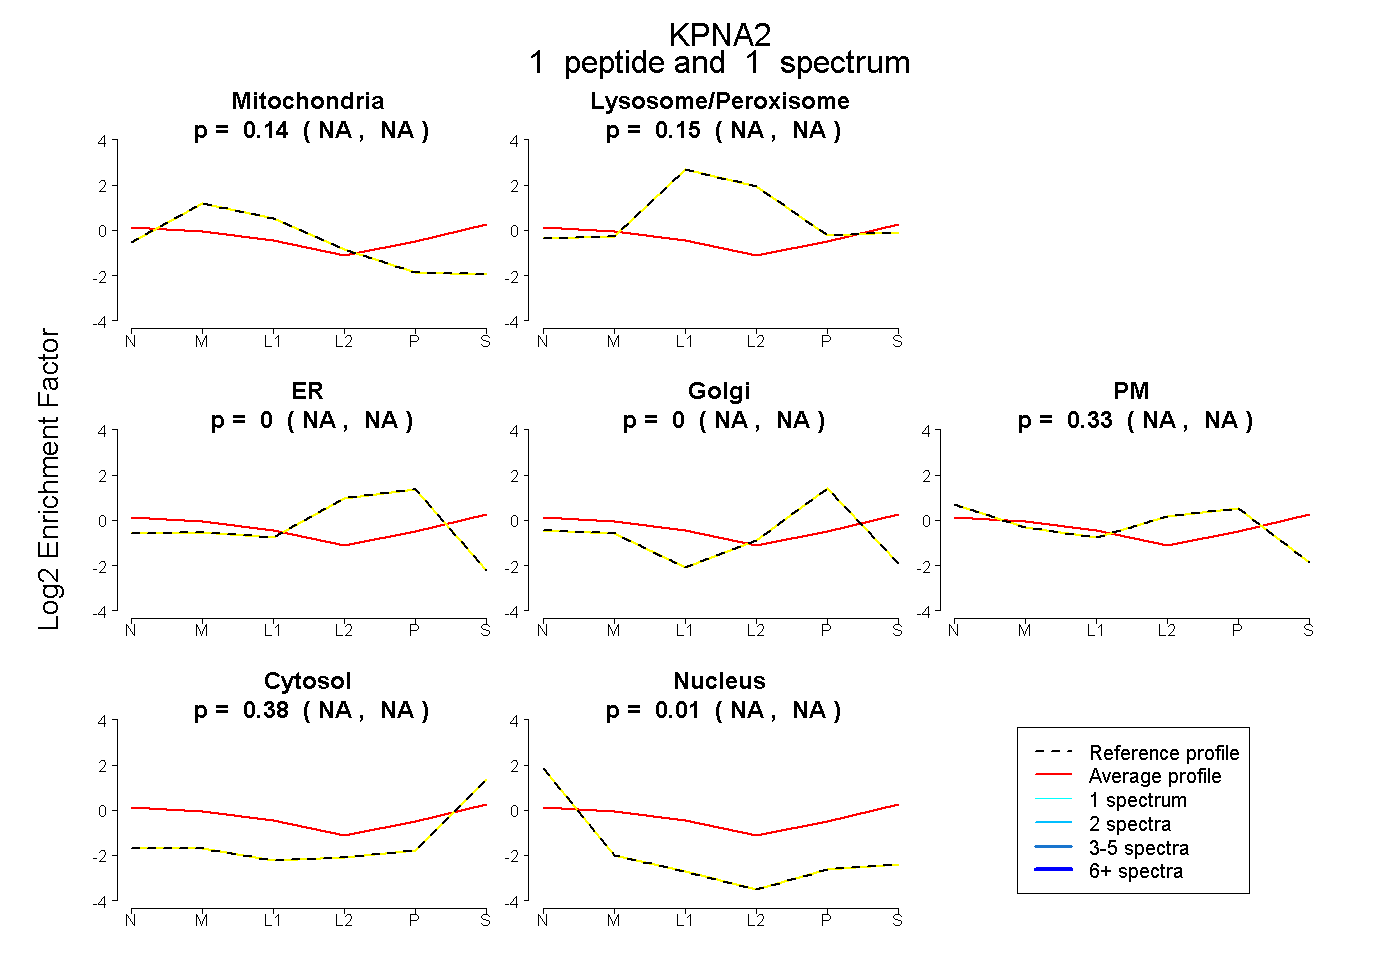 |
0.138 NA | NA |
0.147 NA | NA |
0.000 NA | NA |
0.000 NA | NA |
0.330 NA | NA |
0.377 NA | NA |
0.008 NA | NA |
|||
| Plot | Lyso | Other | |||||||||||
| Expt C |
3 peptides |
7 spectra |
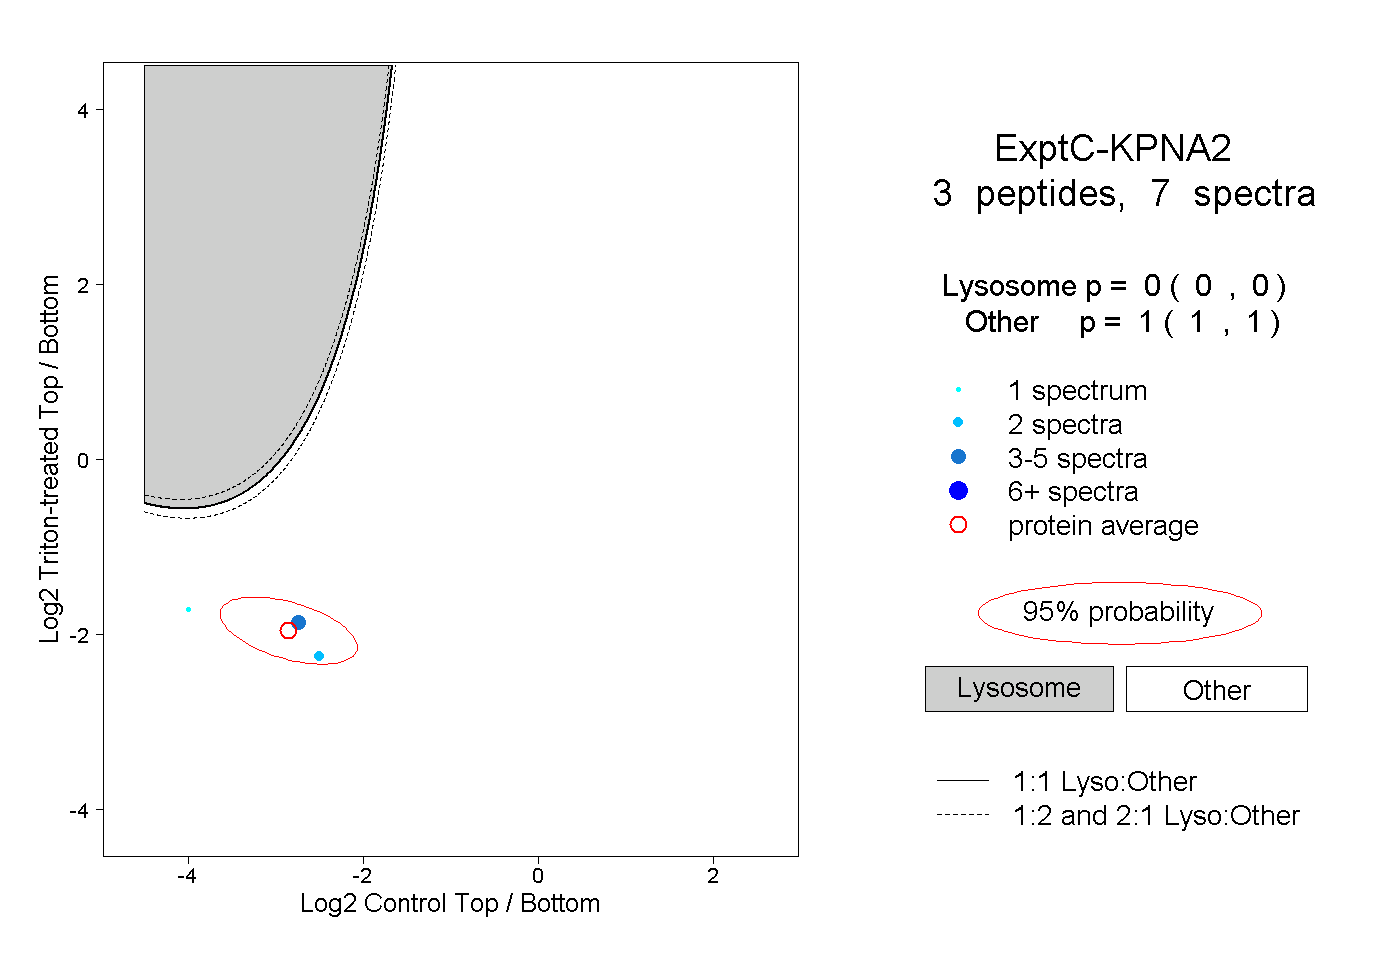 |
0.000 0.000 | 0.000 |
1.000 1.000 | 1.000 |