 10
10peptides
spectra
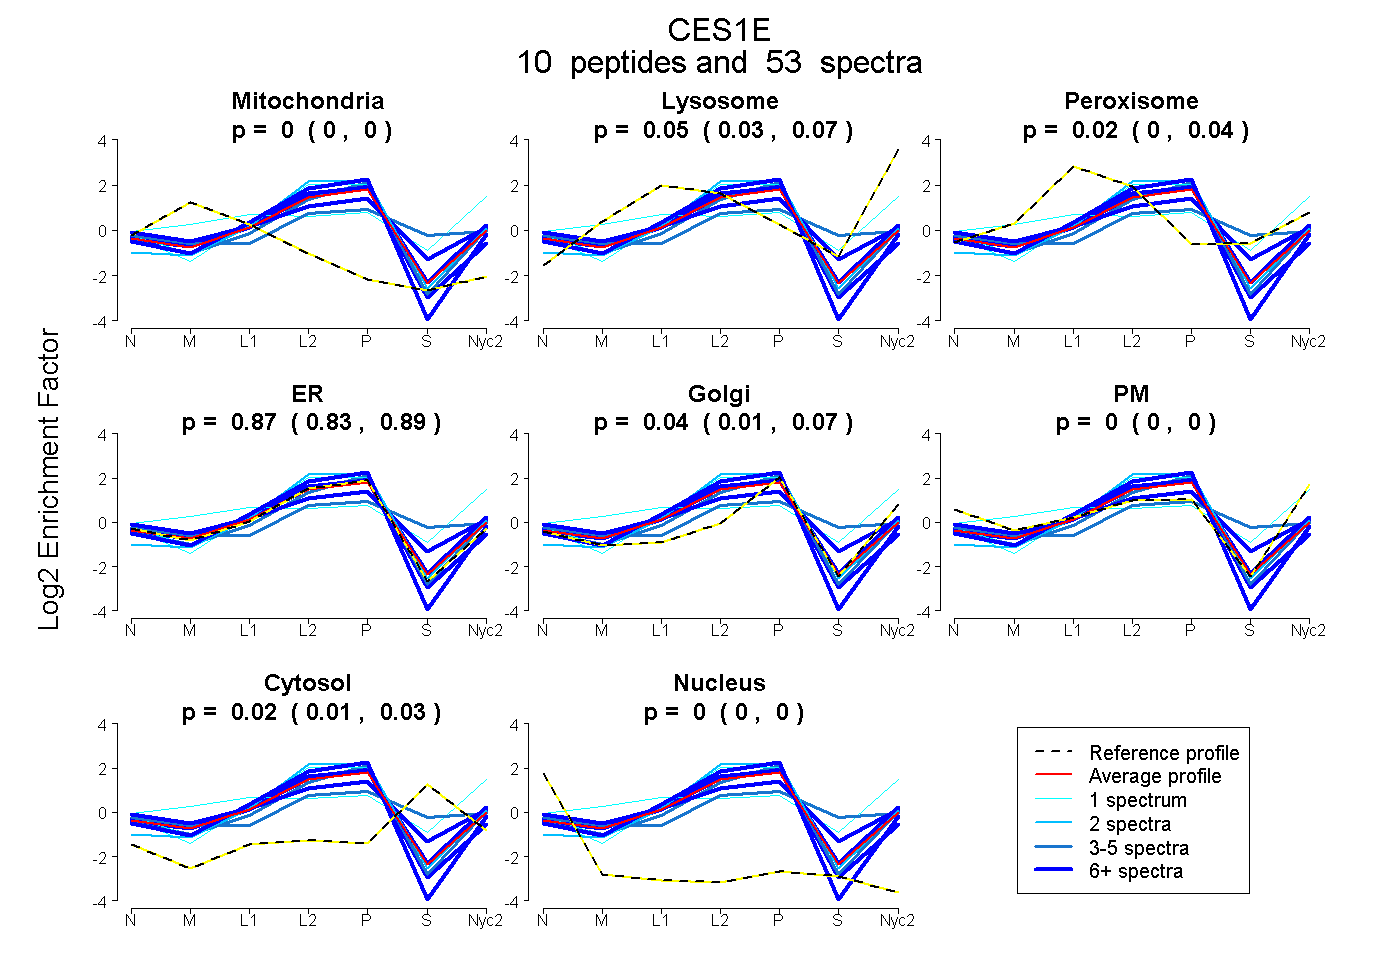
0.000 | 0.000
0.034 | 0.066
0.002 | 0.038
0.835 | 0.890
0.007 | 0.067
0.000 | 0.000
0.008 | 0.032
0.000 | 0.000
7peptides
spectra
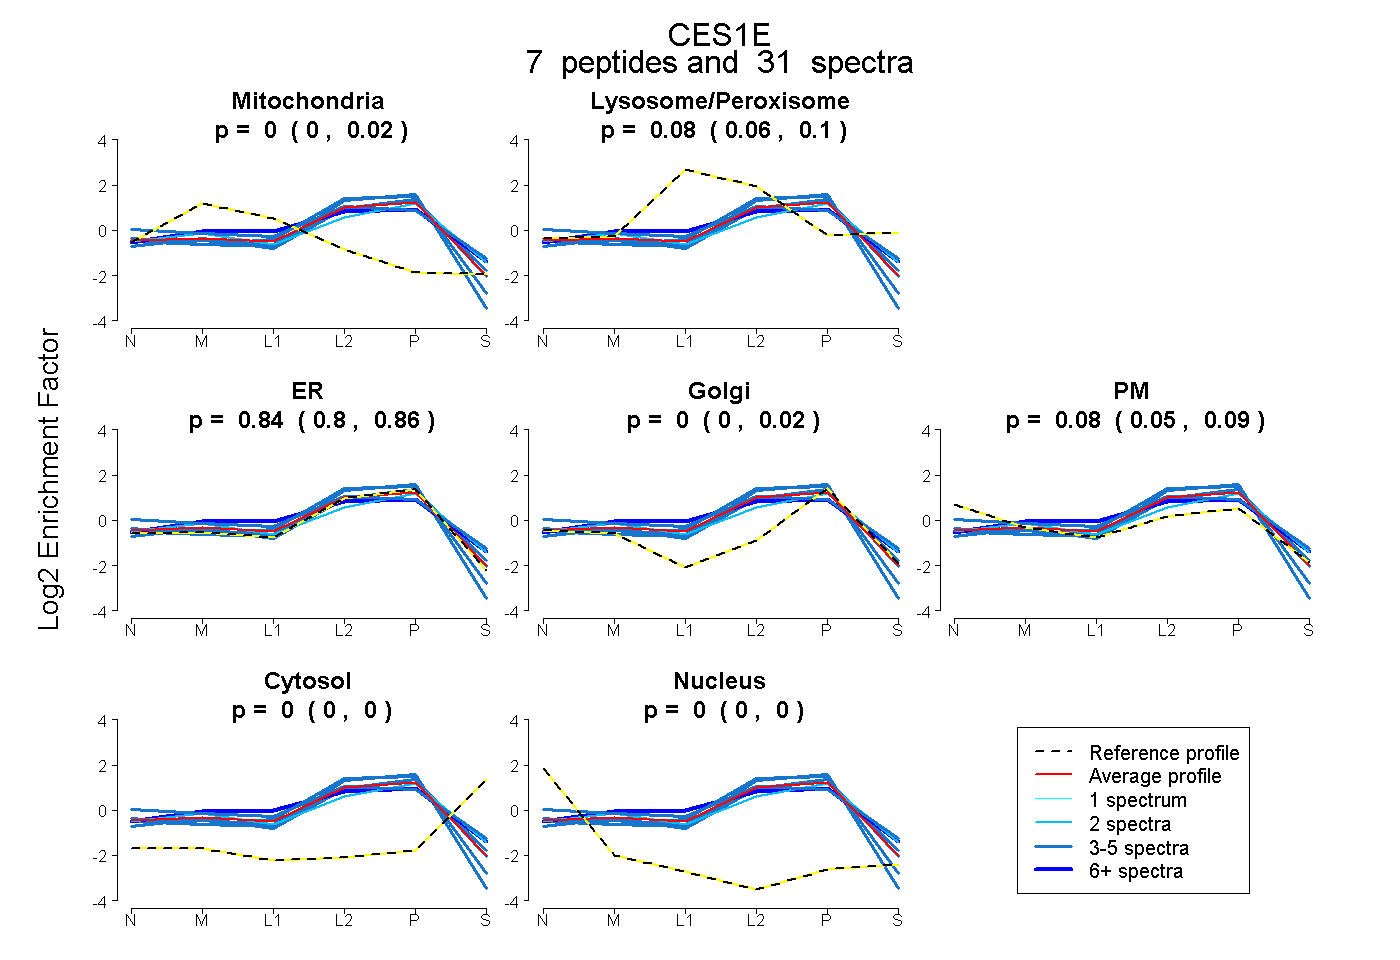
0.000 | 0.017
0.062 | 0.097
0.798 | 0.864
0.000 | 0.024
0.048 | 0.095
0.000 | 0.000
0.000 | 0.000
7peptides
spectra
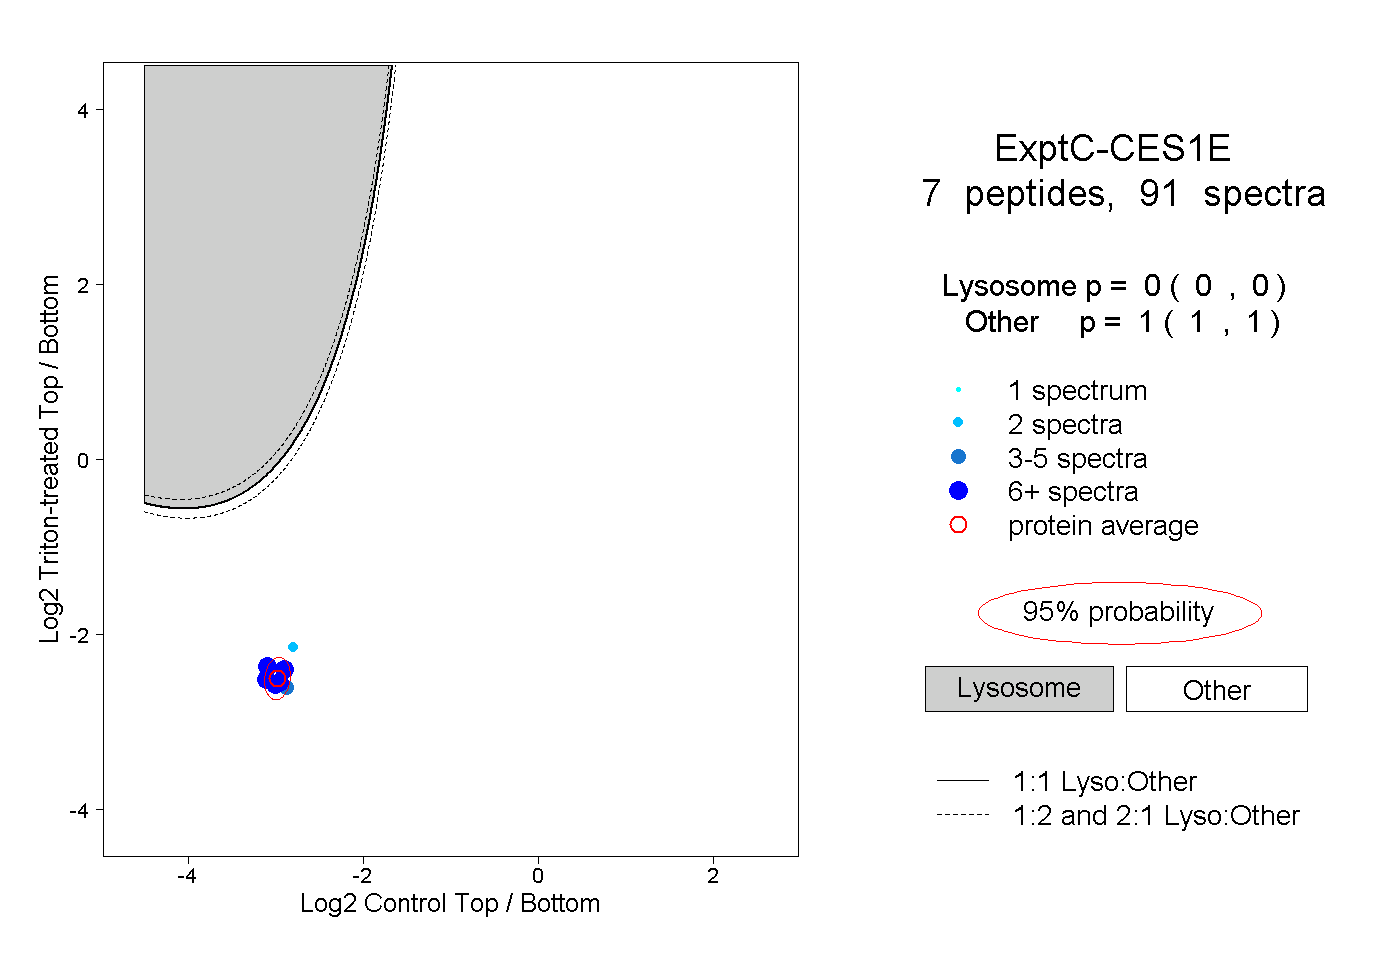
0.000 | 0.000
1.000 | 1.000
2peptides
spectra
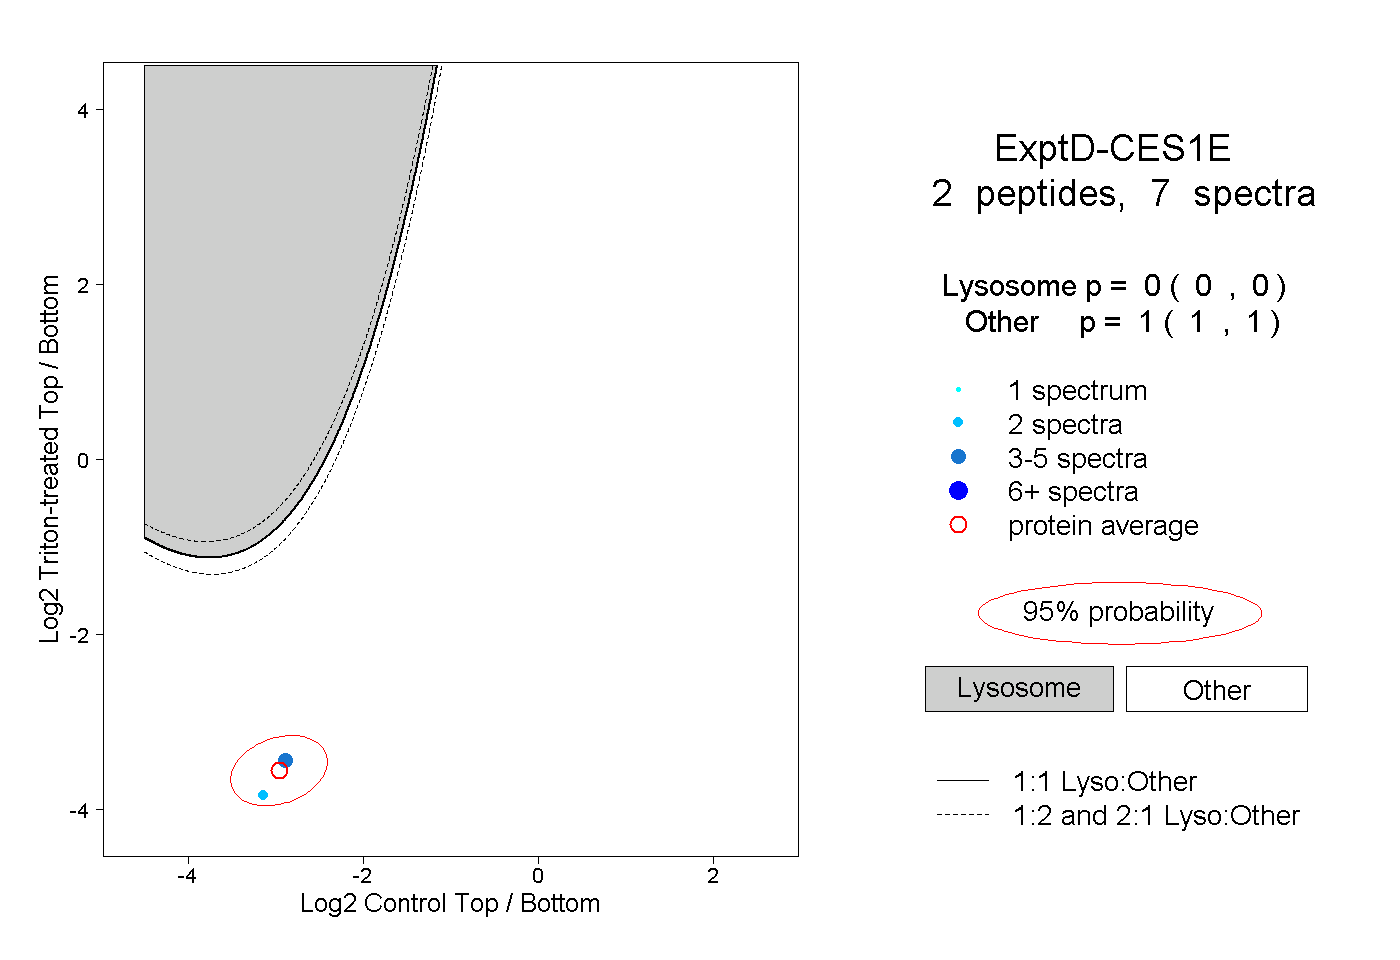
0.000 | 0.000
1.000 | 1.000