 10
10peptides
spectra
0.000 | 0.000
0.034 | 0.066
0.002 | 0.038
0.835 | 0.890
0.007 | 0.067
0.000 | 0.000
0.008 | 0.032
0.000 | 0.000
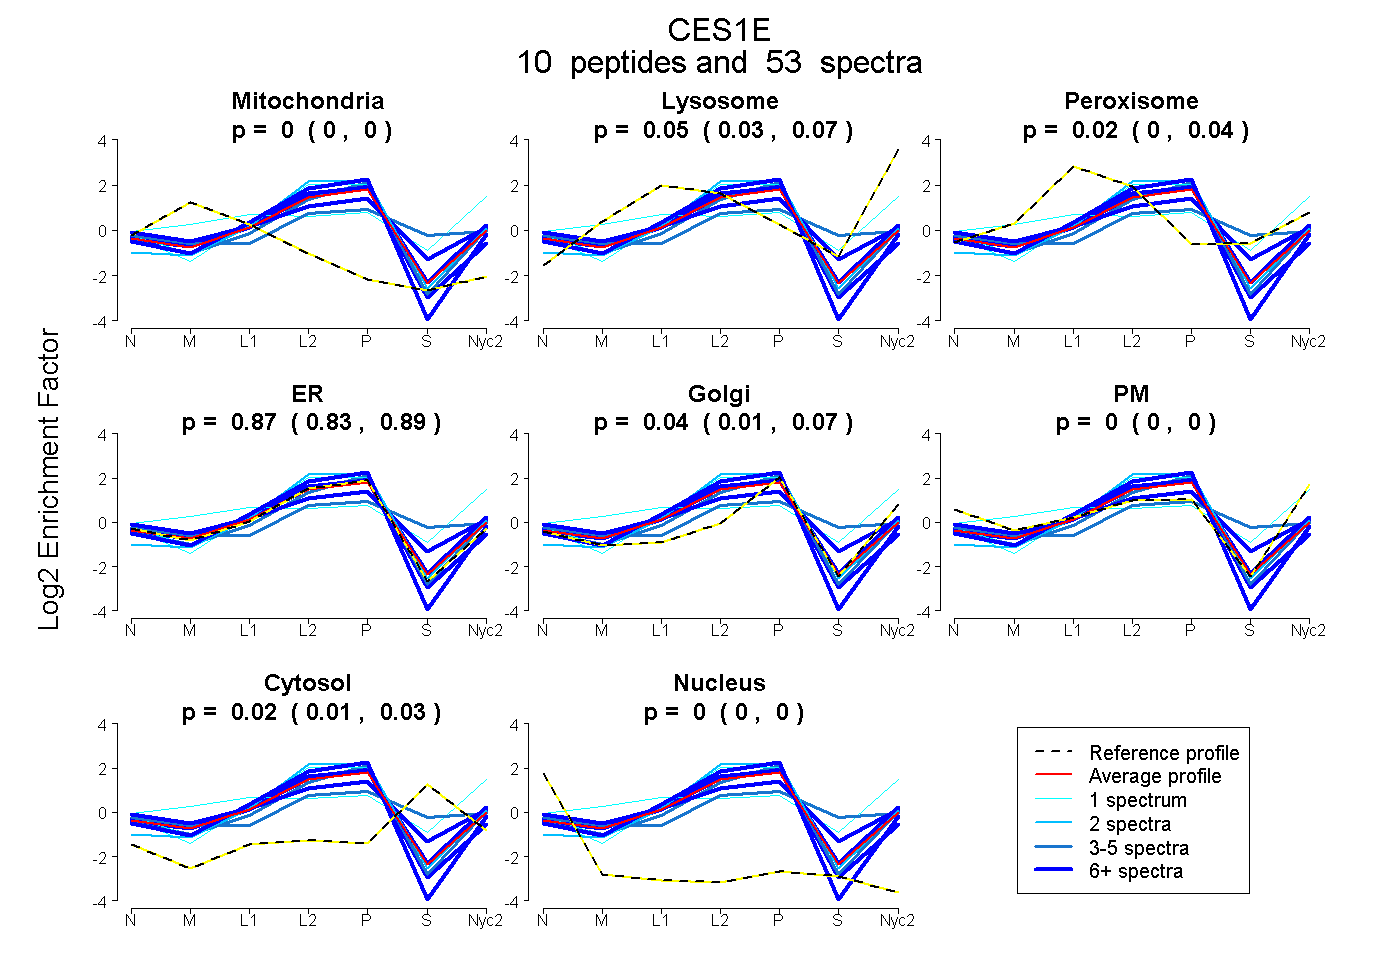
| Plot | Mito | Lyso | Perox | ER | Golgi | PM | Cytosol | Nucleus | |||||
| Expt A |
10 peptides |
53 spectra |
|
0.000 0.000 | 0.000 |
0.052 0.034 | 0.066 |
0.022 0.002 | 0.038 |
0.865 0.835 | 0.890 |
0.040 0.007 | 0.067 |
0.000 0.000 | 0.000 |
0.021 0.008 | 0.032 |
0.000 0.000 | 0.000 |
| 1 spectrum, QEFGWILPTMMNYPPSDMK | 0.011 | 0.187 | 0.211 | 0.000 | 0.140 | 0.358 | 0.093 | 0.000 | ||
| 1 spectrum, AISESGVALTAGLVK | 0.000 | 0.000 | 0.000 | 1.000 | 0.000 | 0.000 | 0.000 | 0.000 | ||
| 9 spectra, IAVVSGCK | 0.022 | 0.000 | 0.000 | 0.978 | 0.000 | 0.000 | 0.000 | 0.000 | ||
| 6 spectra, TYMYEFQYRPSFSSK | 0.000 | 0.000 | 0.000 | 1.000 | 0.000 | 0.000 | 0.000 | 0.000 | ||
| 3 spectra, LDPMTATSLLK | 0.000 | 0.000 | 0.000 | 0.823 | 0.177 | 0.000 | 0.000 | 0.000 | ||
| 6 spectra, LNLFSLDLHGDSR | 0.000 | 0.112 | 0.000 | 0.885 | 0.004 | 0.000 | 0.000 | 0.000 | ||
| 2 spectra, TEEELLETTLK | 0.000 | 0.069 | 0.000 | 0.931 | 0.000 | 0.000 | 0.000 | 0.000 | ||
| 1 spectrum, NTRPLAEK | 0.000 | 0.051 | 0.000 | 0.949 | 0.000 | 0.000 | 0.000 | 0.000 | ||
| 3 spectra, SSFLLNLPEEAIPVAVEK | 0.000 | 0.000 | 0.096 | 0.389 | 0.015 | 0.158 | 0.342 | 0.000 | ||
| 21 spectra, STTSAAMVHCLR | 0.000 | 0.000 | 0.204 | 0.457 | 0.190 | 0.052 | 0.097 | 0.000 |
| Plot | Mito | Lyso or Perox | ER | Golgi | PM | Cytosol | Nucleus | ||||||
| Expt B |
7 peptides |
31 spectra |
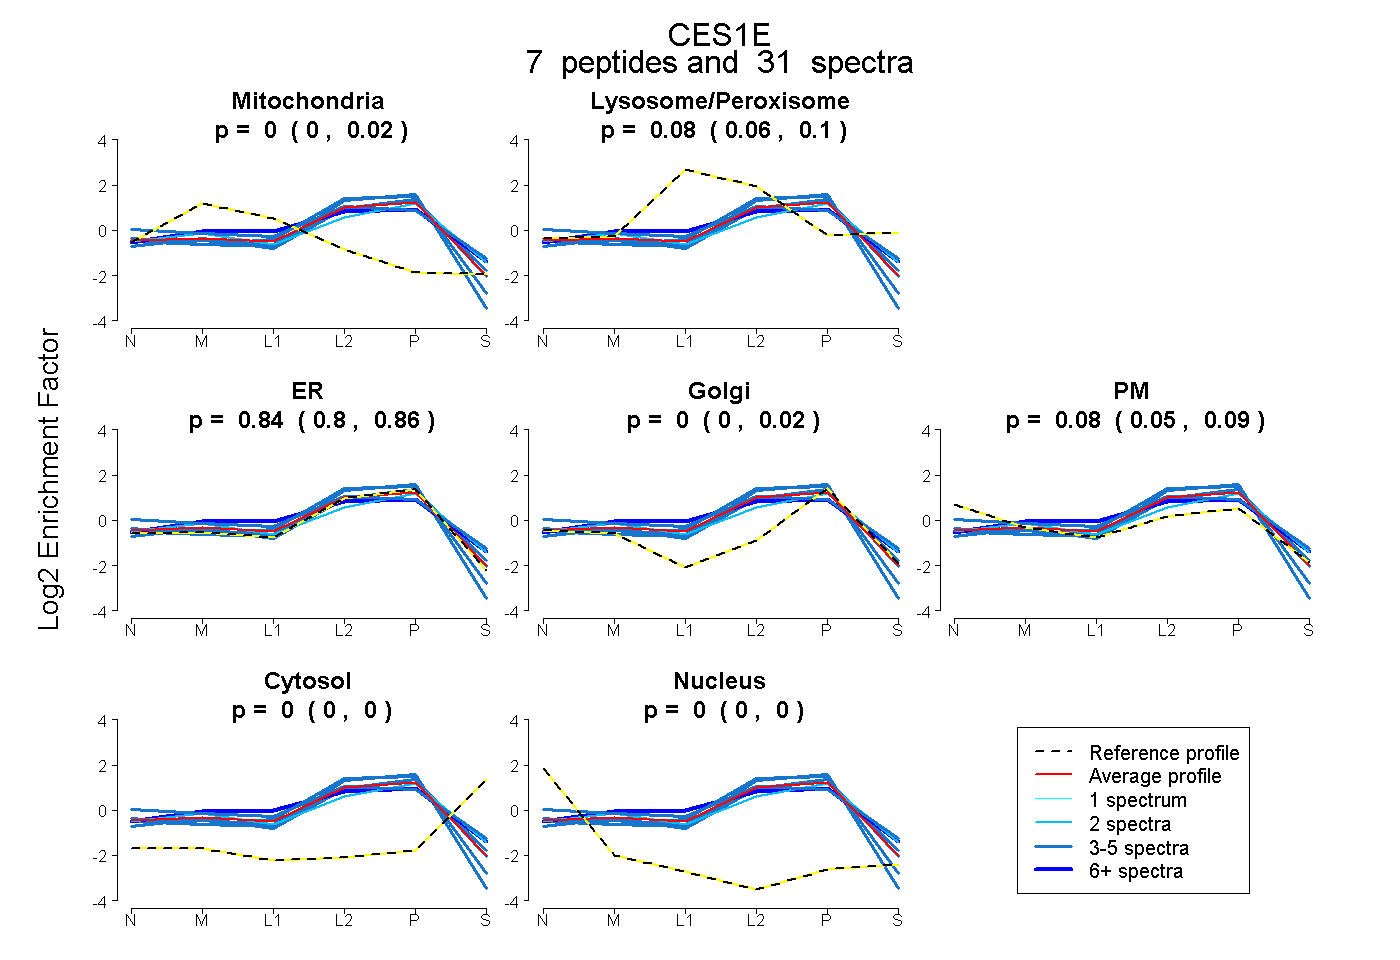 |
0.005 0.000 | 0.017 |
0.079 0.062 | 0.097 |
0.839 0.798 | 0.864 |
0.000 0.000 | 0.024 |
0.077 0.048 | 0.095 |
0.000 0.000 | 0.000 |
0.000 0.000 | 0.000 |
|||
| Plot | Lyso | Other | |||||||||||
| Expt C |
7 peptides |
91 spectra |
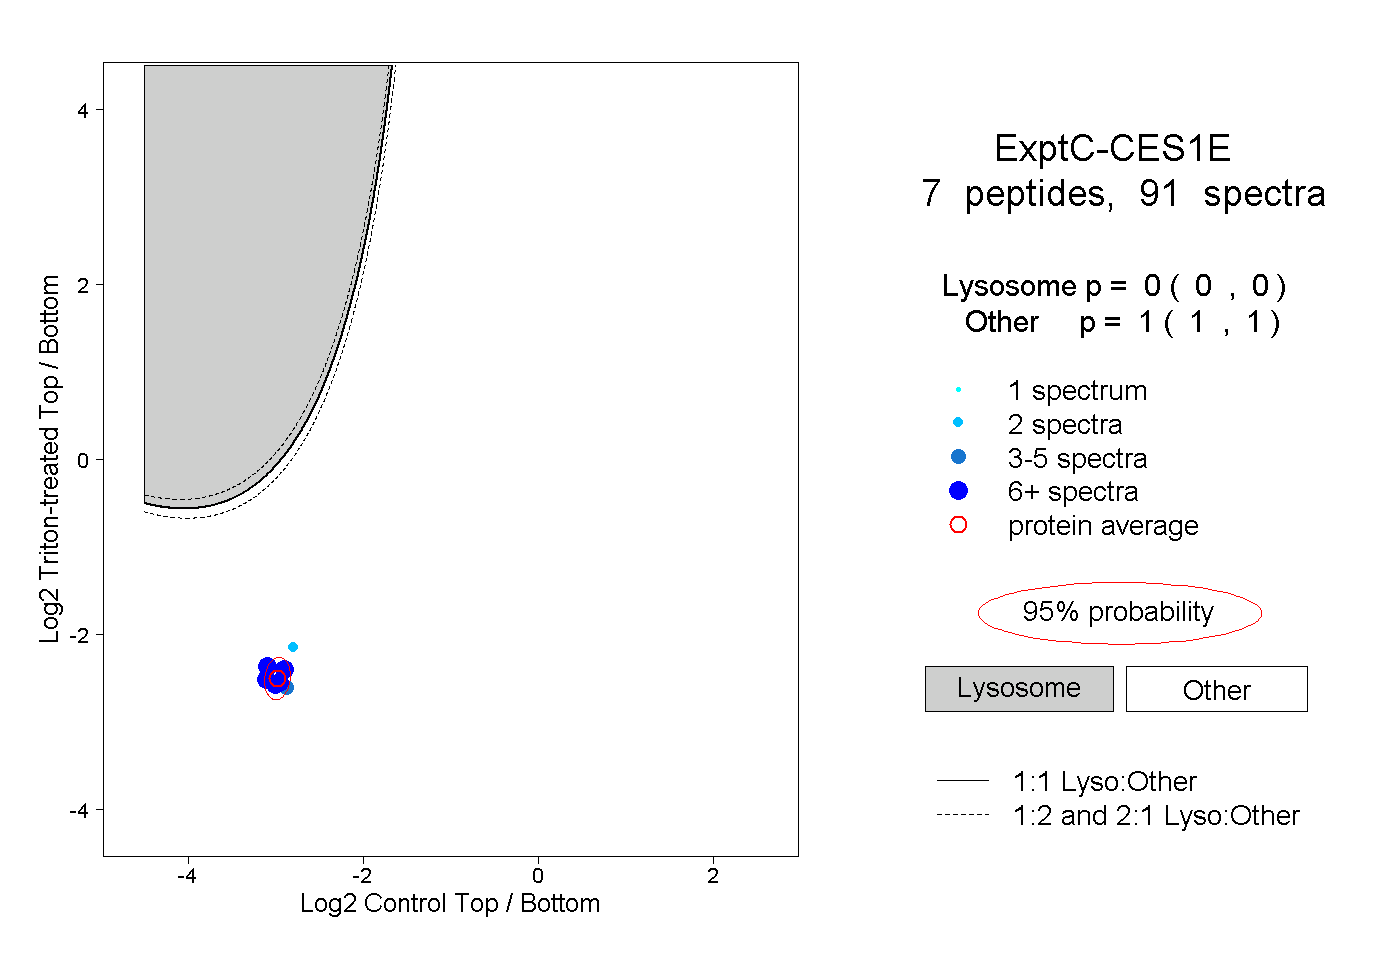 |
0.000 0.000 | 0.000 |
1.000 1.000 | 1.000 |
||||||||
| Plot | Lyso | Other | |||||||||||
| Expt D |
2 peptides |
7 spectra |
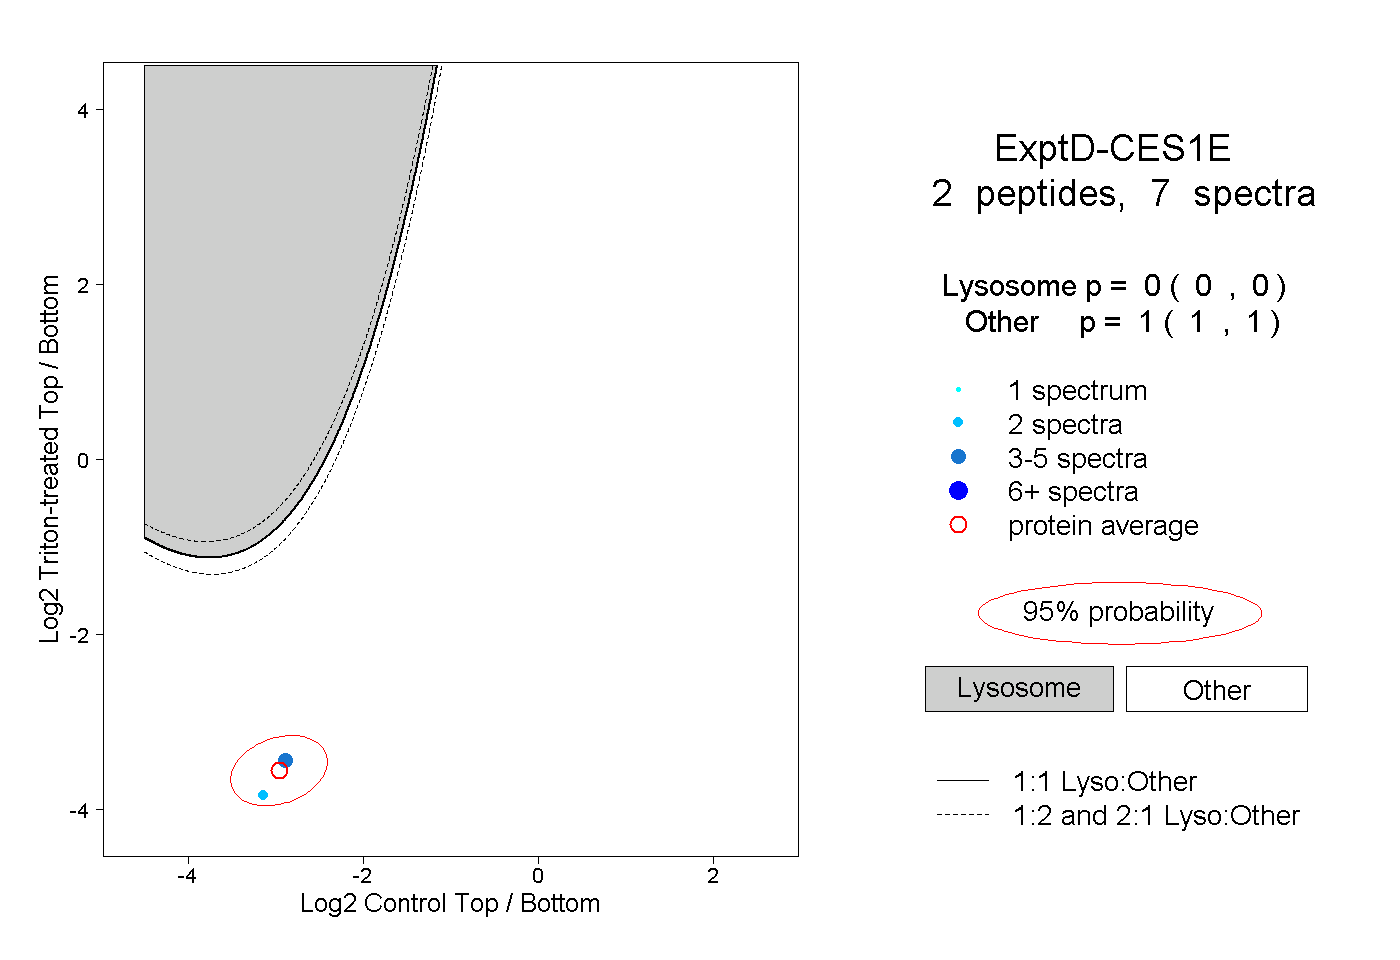 |
0.000 0.000 | 0.000 |
1.000 1.000 | 1.000 |