 8
8peptides
spectra
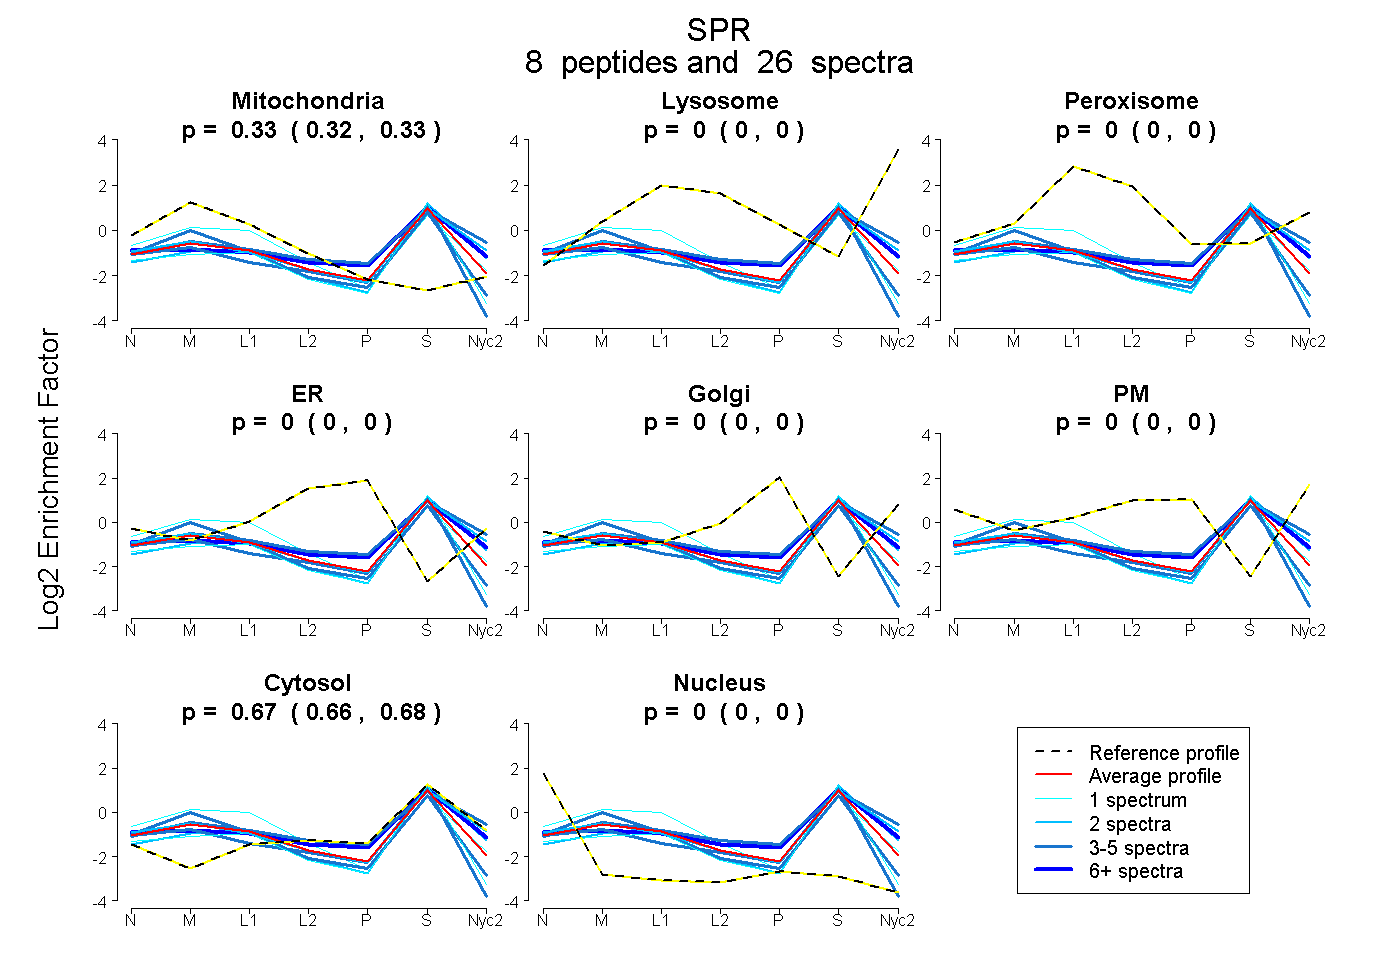
0.319 | 0.334
0.000 | 0.000
0.000 | 0.000
0.000 | 0.000
0.000 | 0.000
0.000 | 0.000
0.665 | 0.680
0.000 | 0.000
4peptides
spectra
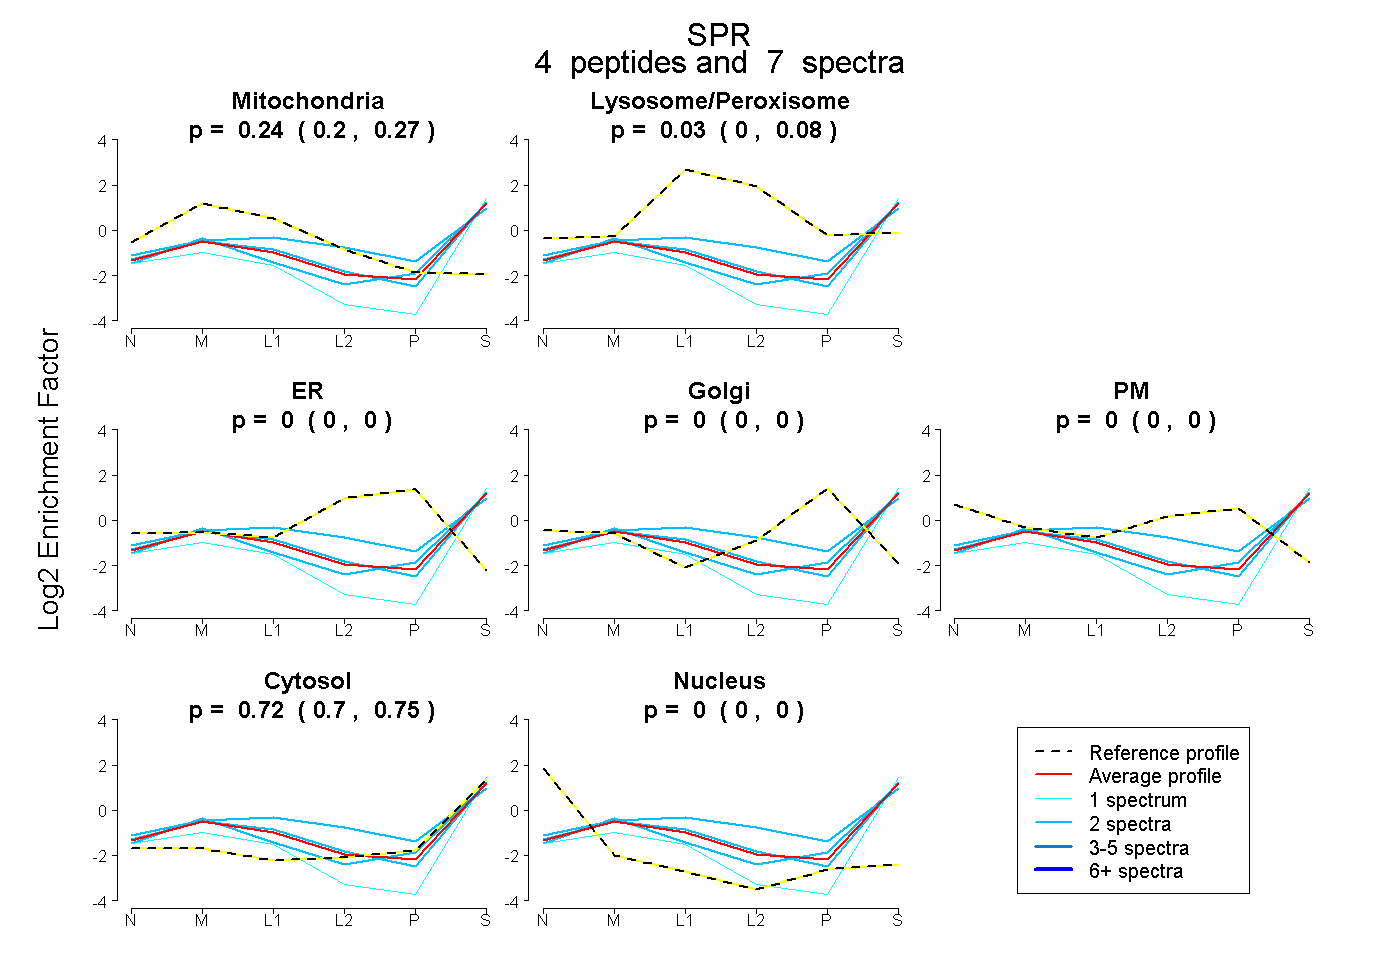
0.196 | 0.273
0.000 | 0.083
0.000 | 0.000
0.000 | 0.000
0.000 | 0.000
0.696 | 0.748
0.000 | 0.000
8peptides
spectra
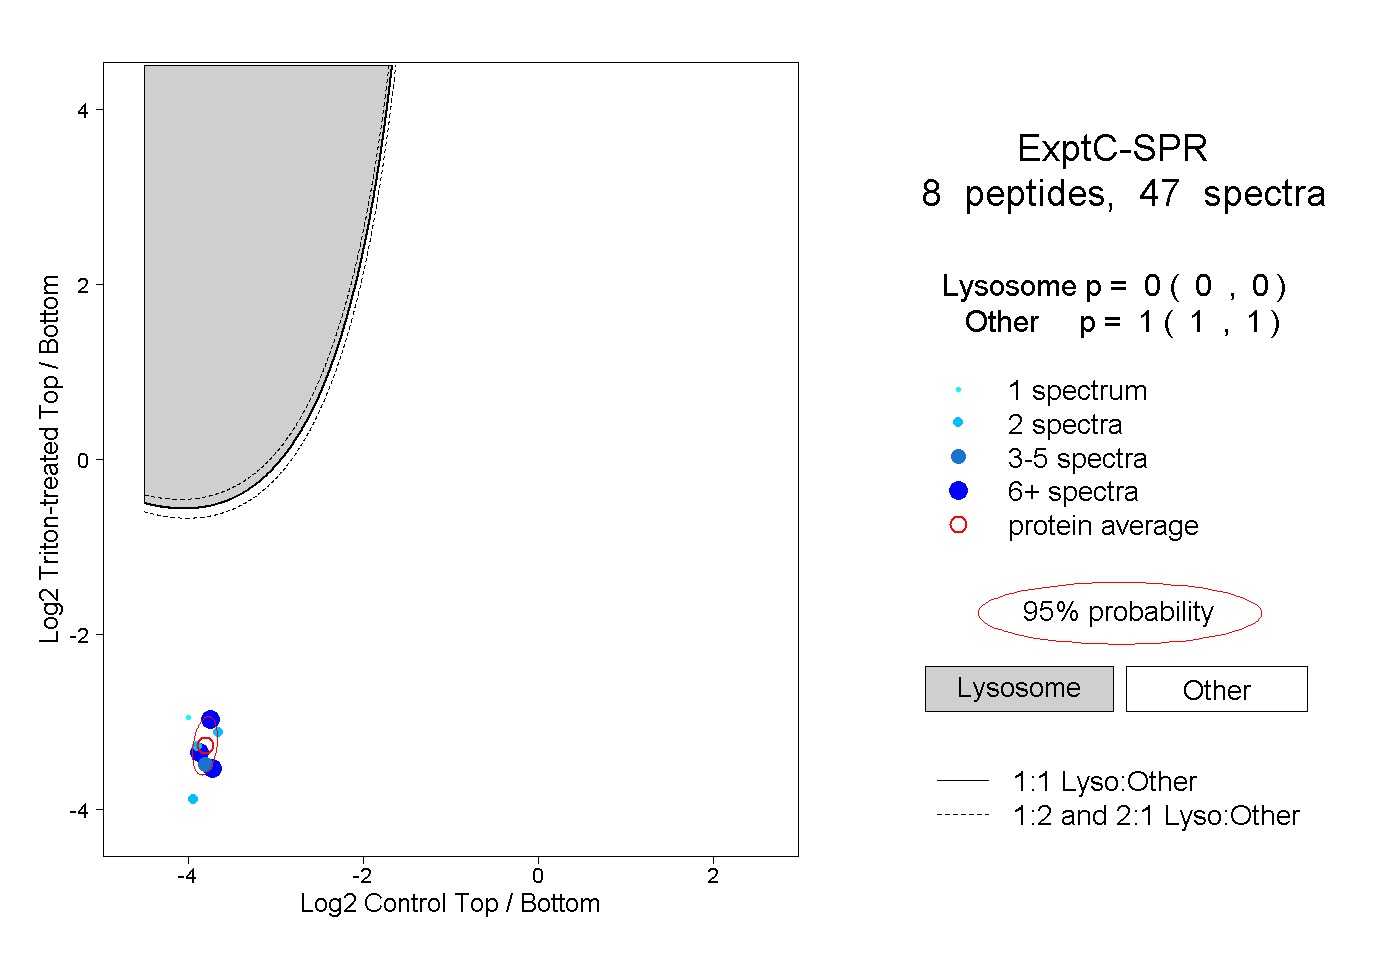
0.000 | 0.000
1.000 | 1.000
2peptides
spectra
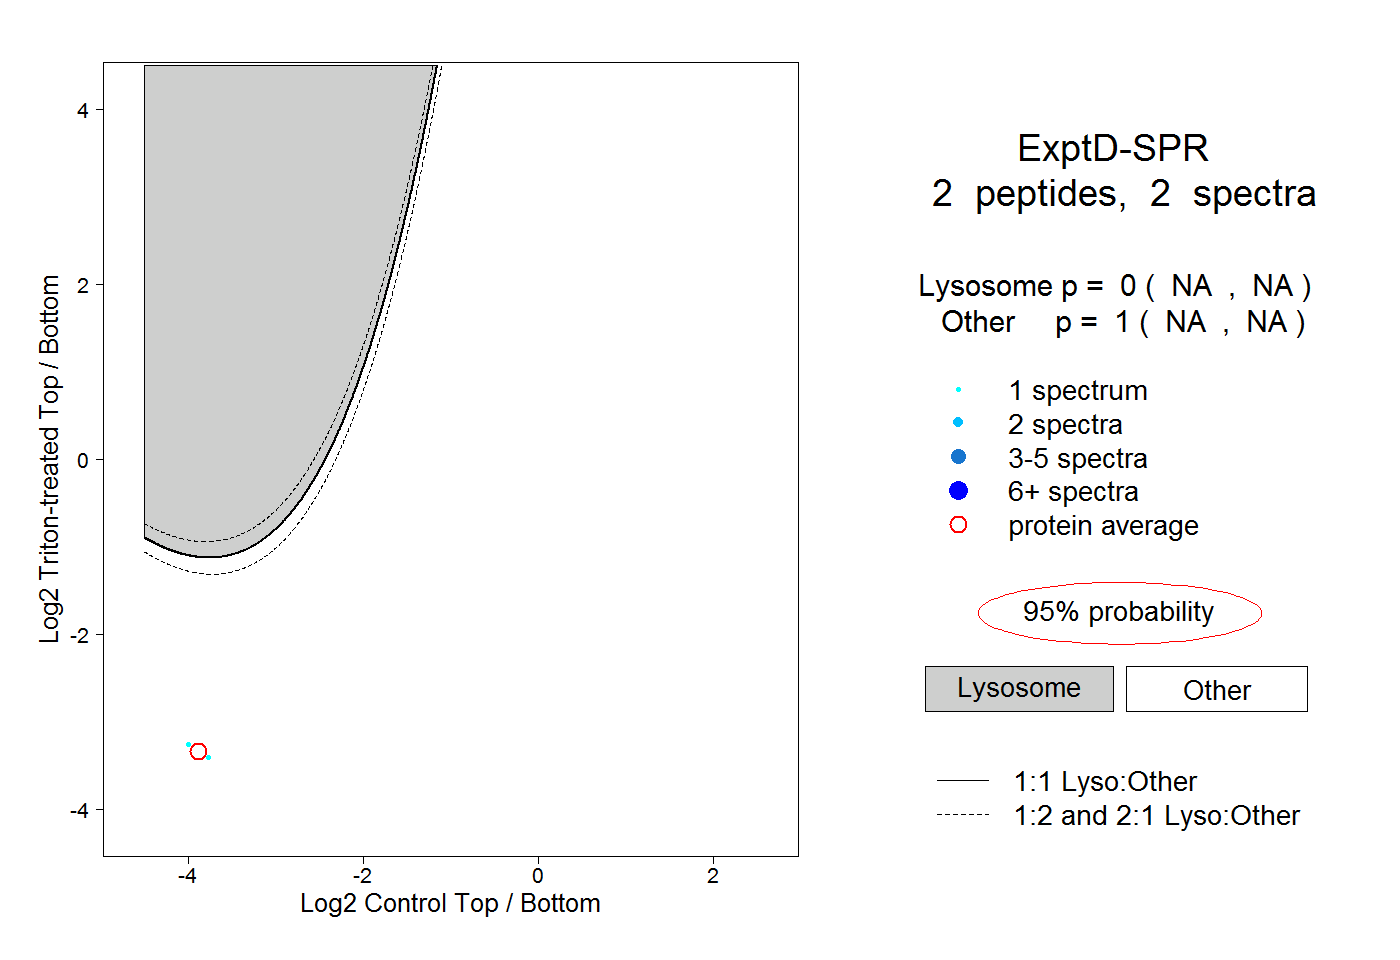
NA | NA
NA | NA