 8
8peptides
spectra
0.319 | 0.334
0.000 | 0.000
0.000 | 0.000
0.000 | 0.000
0.000 | 0.000
0.000 | 0.000
0.665 | 0.680
0.000 | 0.000
| Plot | Mito | Lyso | Perox | ER | Golgi | PM | Cytosol | Nucleus | |||||
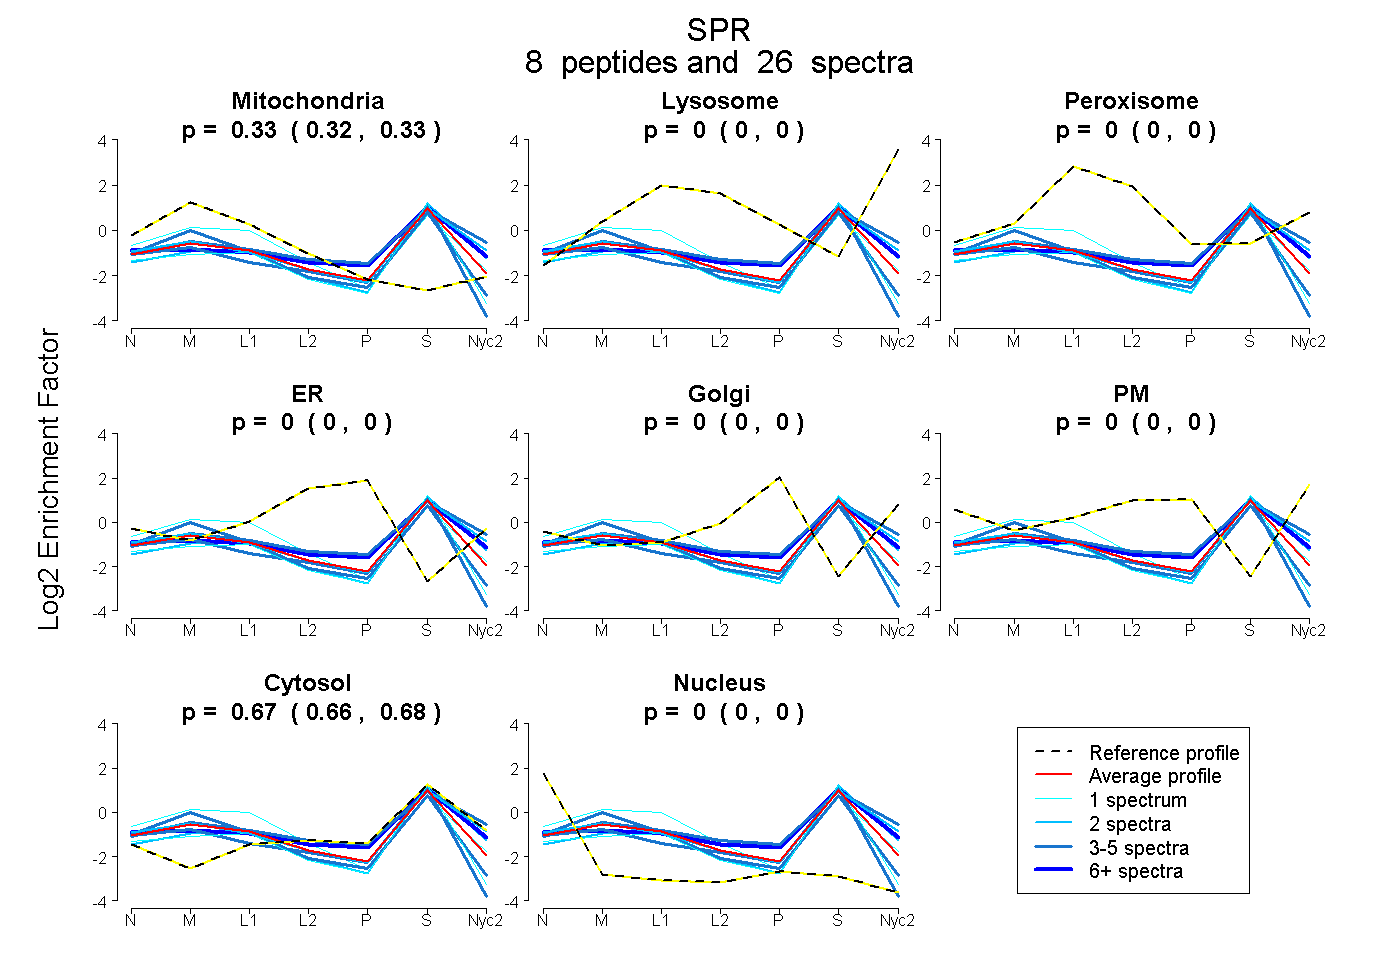
| Expt A |
8 peptides |
26 spectra |
|
0.327 0.319 | 0.334 |
0.000 0.000 | 0.000 |
0.000 0.000 | 0.000 |
0.000 0.000 | 0.000 |
0.000 0.000 | 0.000 |
0.000 0.000 | 0.000 |
0.673 0.665 | 0.680 |
0.000 0.000 | 0.000 |
| 1 spectrum, DTFQSGAHVDFYDI | 0.480 | 0.000 | 0.020 | 0.000 | 0.000 | 0.000 | 0.500 | 0.000 | ||
| 2 spectra, VLSYAPGPLDTNMQQLAR | 0.301 | 0.000 | 0.000 | 0.000 | 0.000 | 0.000 | 0.699 | 0.000 | ||
| 5 spectra, SDSMLR | 0.231 | 0.095 | 0.000 | 0.000 | 0.000 | 0.000 | 0.674 | 0.000 | ||
| 3 spectra, GWGLYCAGK | 0.416 | 0.000 | 0.000 | 0.000 | 0.000 | 0.000 | 0.536 | 0.048 | ||
| 1 spectrum, TVVNISSLCALQPFK | 0.223 | 0.000 | 0.000 | 0.000 | 0.000 | 0.000 | 0.657 | 0.120 | ||
| 7 spectra, ETSMDPELR | 0.252 | 0.000 | 0.011 | 0.000 | 0.000 | 0.000 | 0.737 | 0.000 | ||
| 5 spectra, LGCAVCVLTGASR | 0.248 | 0.000 | 0.000 | 0.000 | 0.000 | 0.000 | 0.593 | 0.159 | ||
| 2 spectra, DMLYQVLAVEEPSVR | 0.237 | 0.000 | 0.000 | 0.000 | 0.000 | 0.000 | 0.763 | 0.000 |
| Plot | Mito | Lyso or Perox | ER | Golgi | PM | Cytosol | Nucleus | ||||||
| Expt B |
4 peptides |
7 spectra |
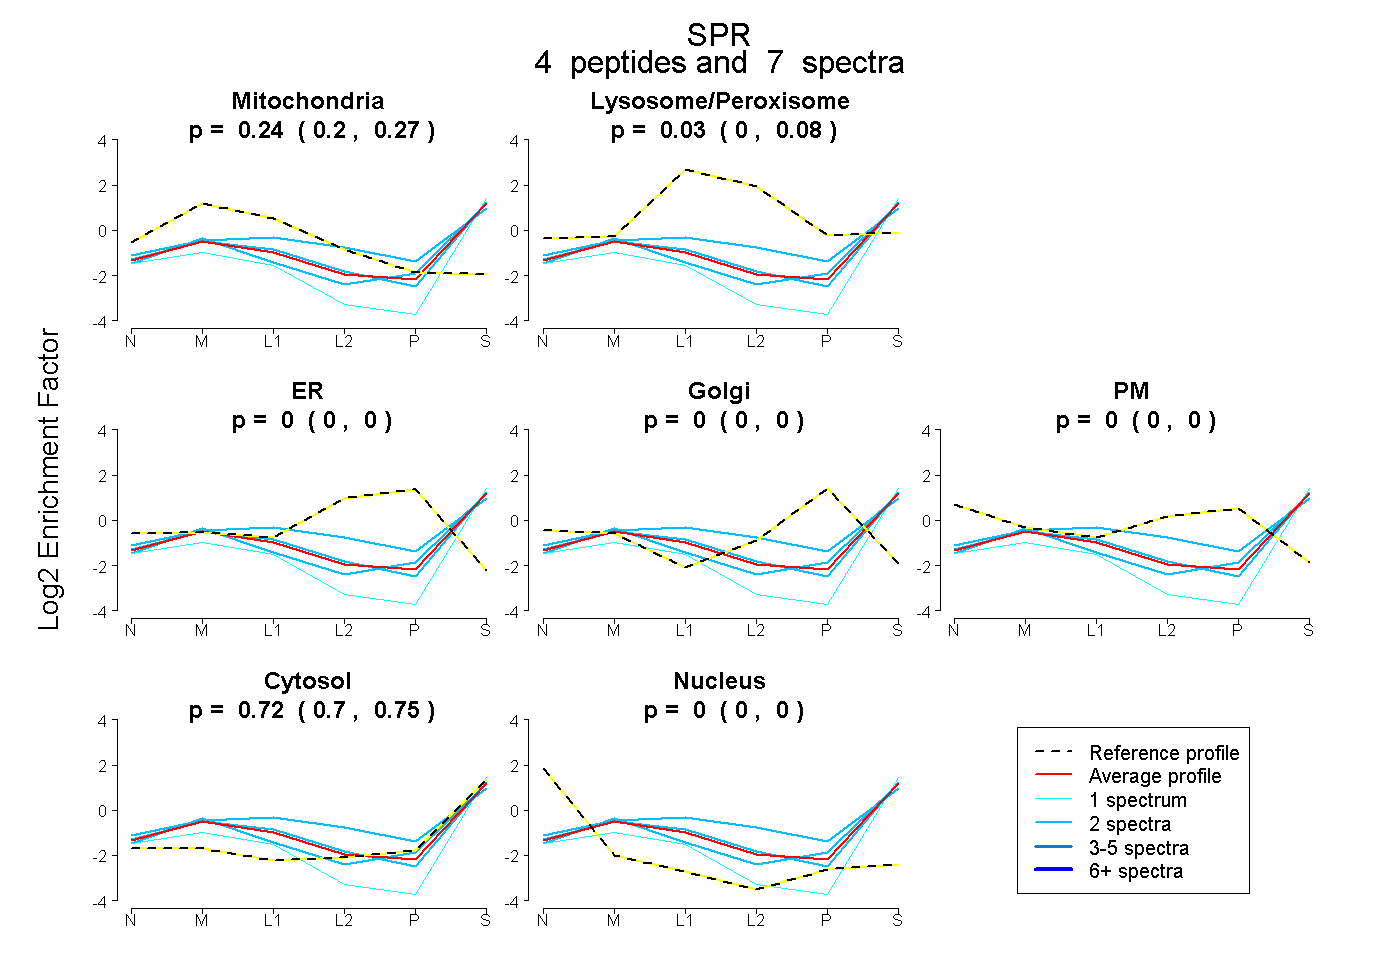 |
0.244 0.196 | 0.273 |
0.032 0.000 | 0.083 |
0.000 0.000 | 0.000 |
0.000 0.000 | 0.000 |
0.000 0.000 | 0.000 |
0.724 0.696 | 0.748 |
0.000 0.000 | 0.000 |
|||
| Plot | Lyso | Other | |||||||||||
| Expt C |
8 peptides |
47 spectra |
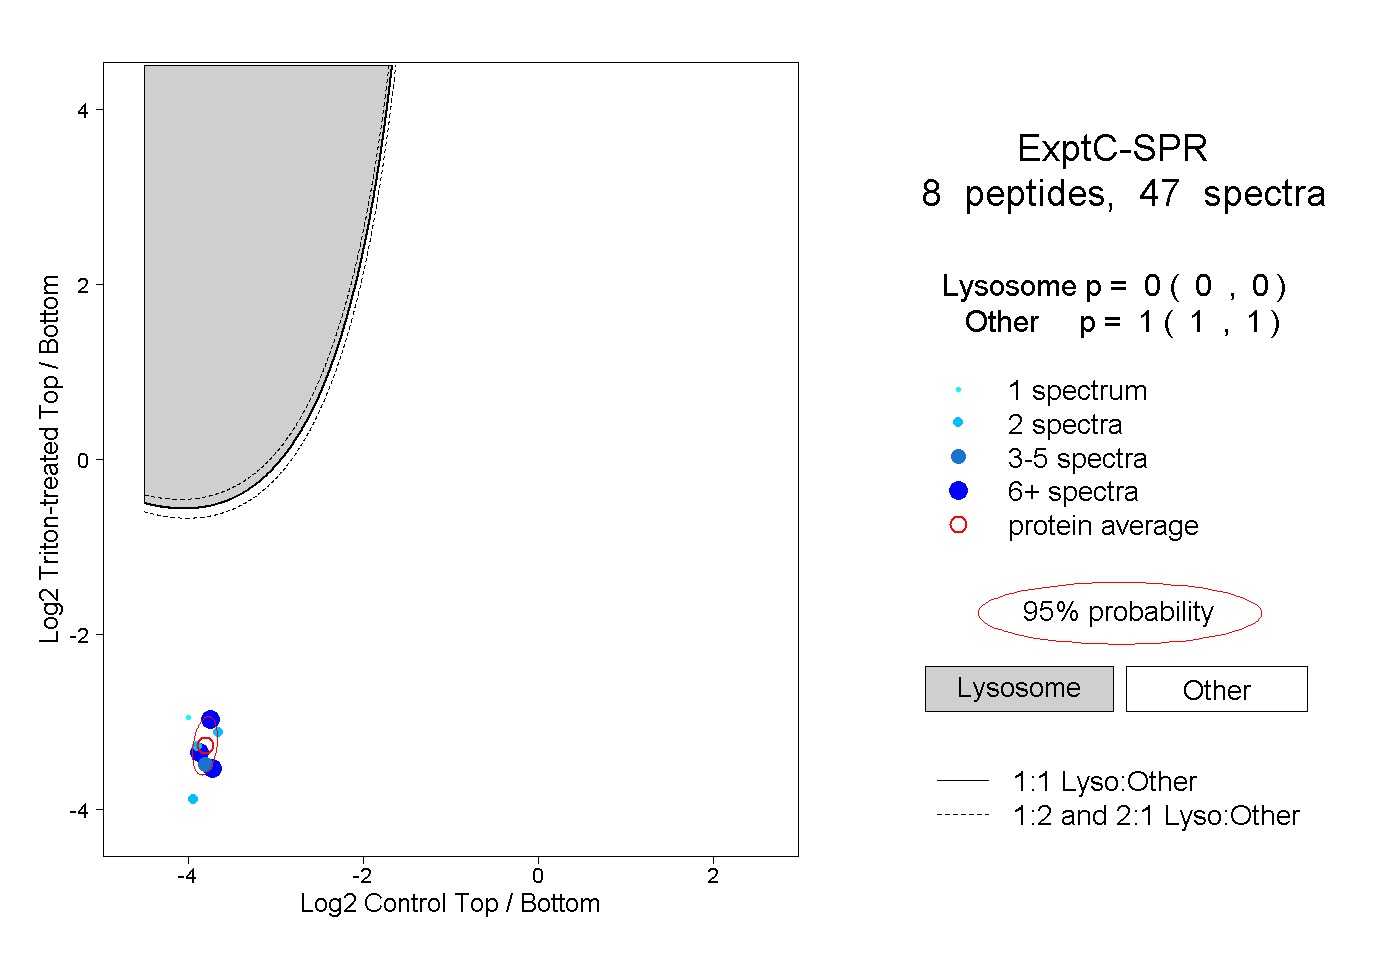 |
0.000 0.000 | 0.000 |
1.000 1.000 | 1.000 |
||||||||
| Plot | Lyso | Other | |||||||||||
| Expt D |
2 peptides |
2 spectra |
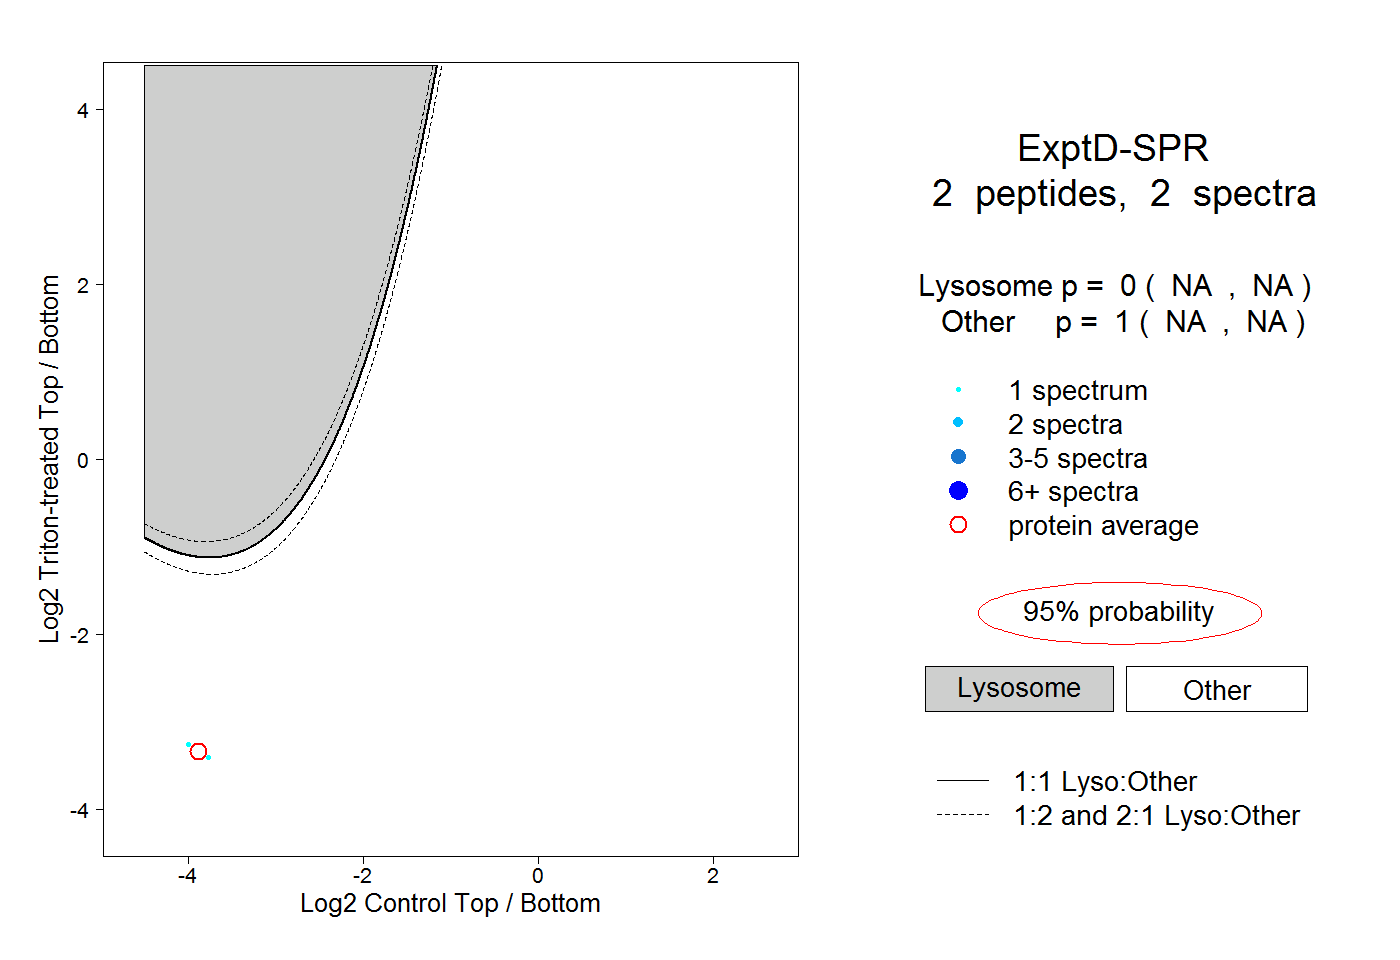 |
0.000 NA | NA |
1.000 NA | NA |