 12
12peptides
spectra
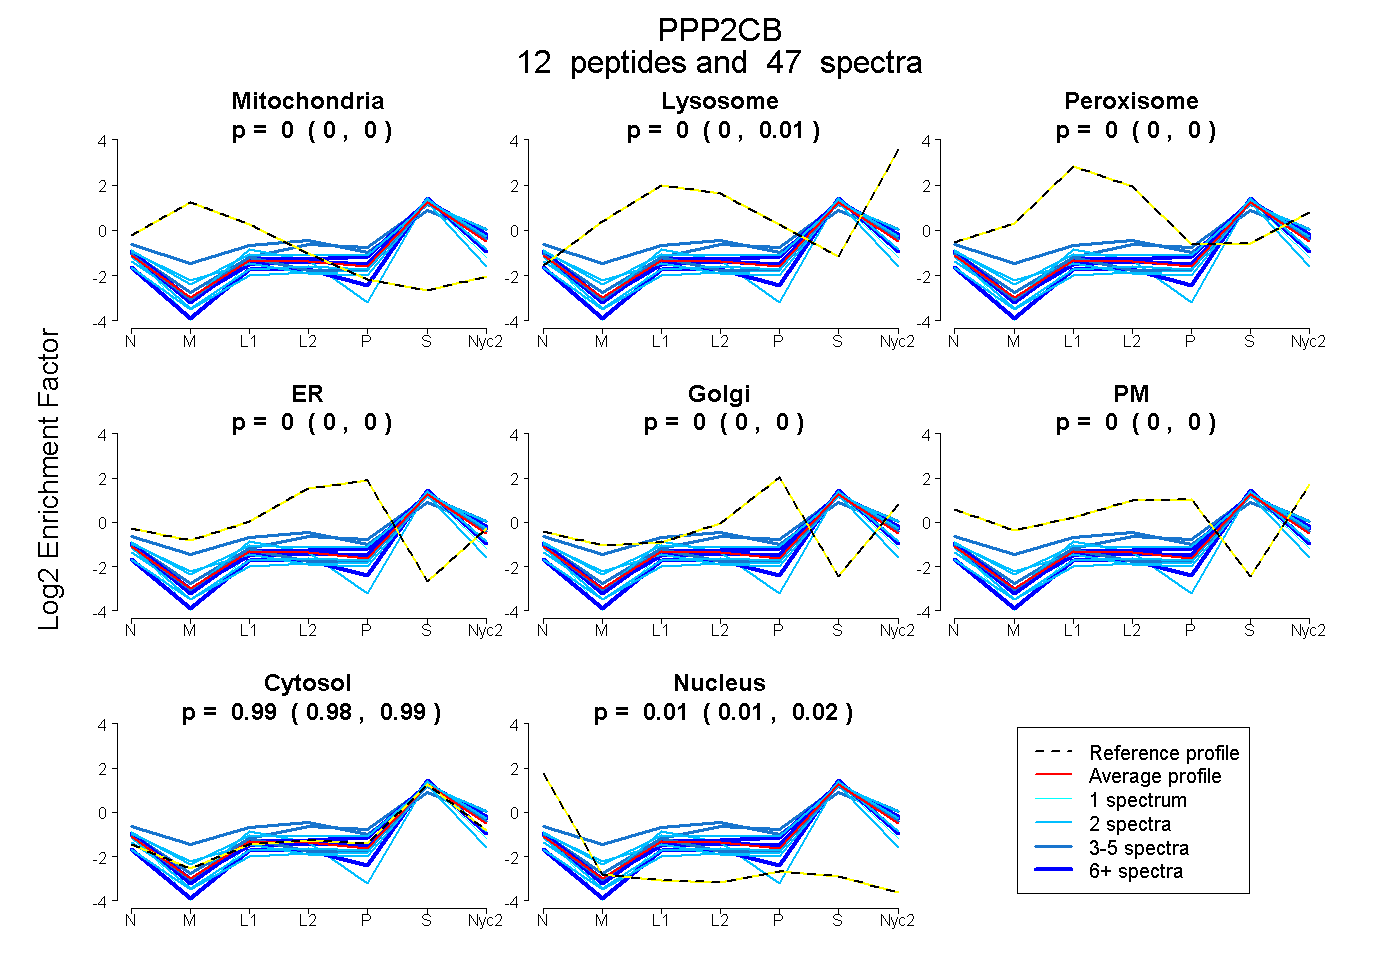
0.000 | 0.000
0.000 | 0.006
0.000 | 0.000
0.000 | 0.000
0.000 | 0.000
0.000 | 0.000
0.980 | 0.989
0.009 | 0.016
4peptides
spectra
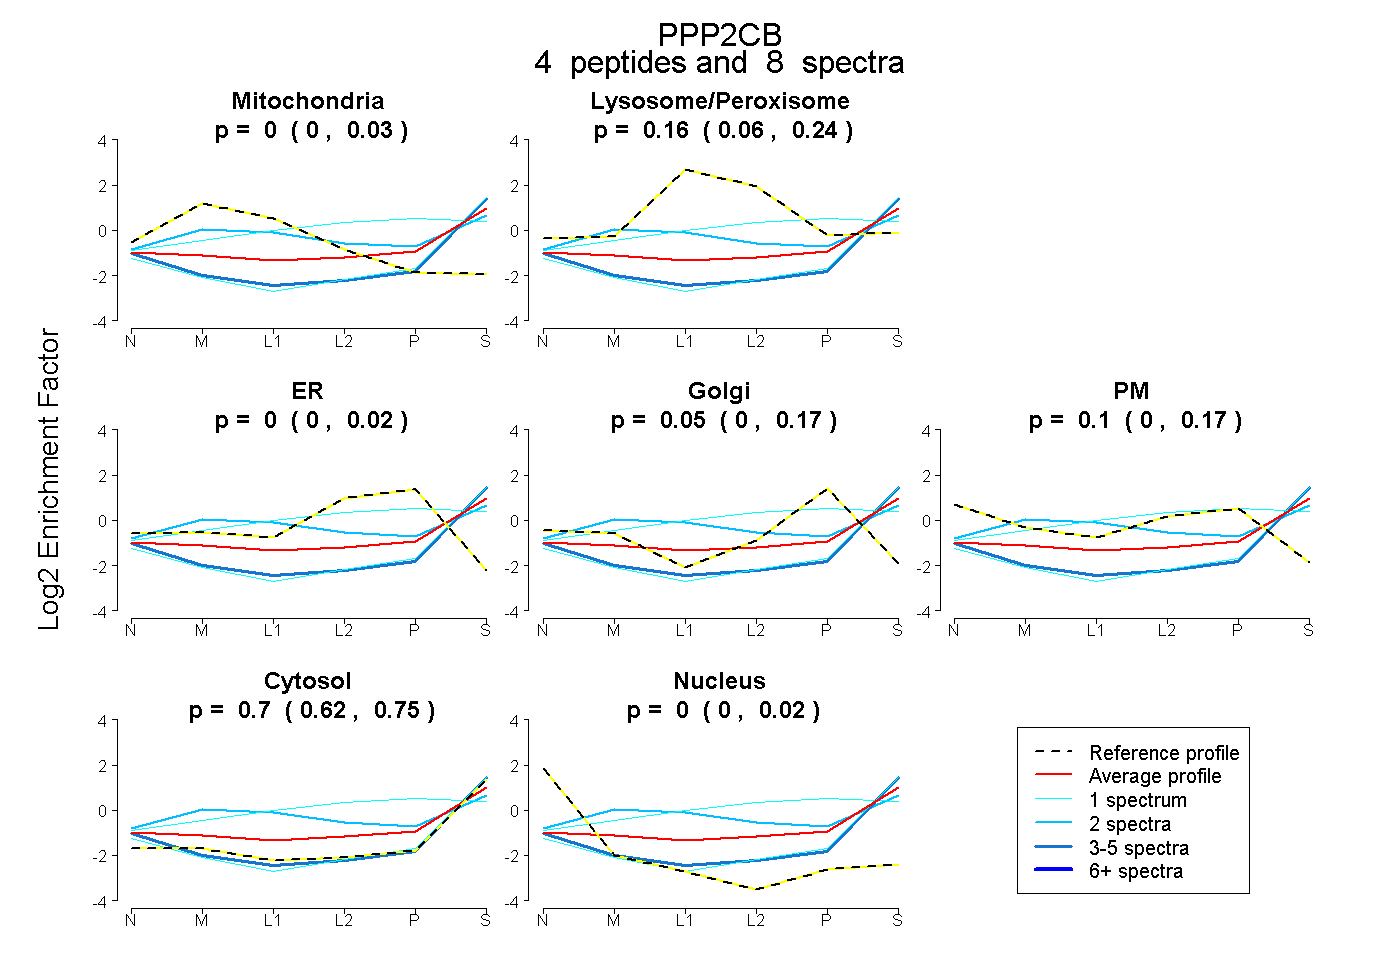
0.000 | 0.031
0.060 | 0.245
0.000 | 0.023
0.000 | 0.172
0.000 | 0.169
0.619 | 0.749
0.000 | 0.022
7peptides
spectra
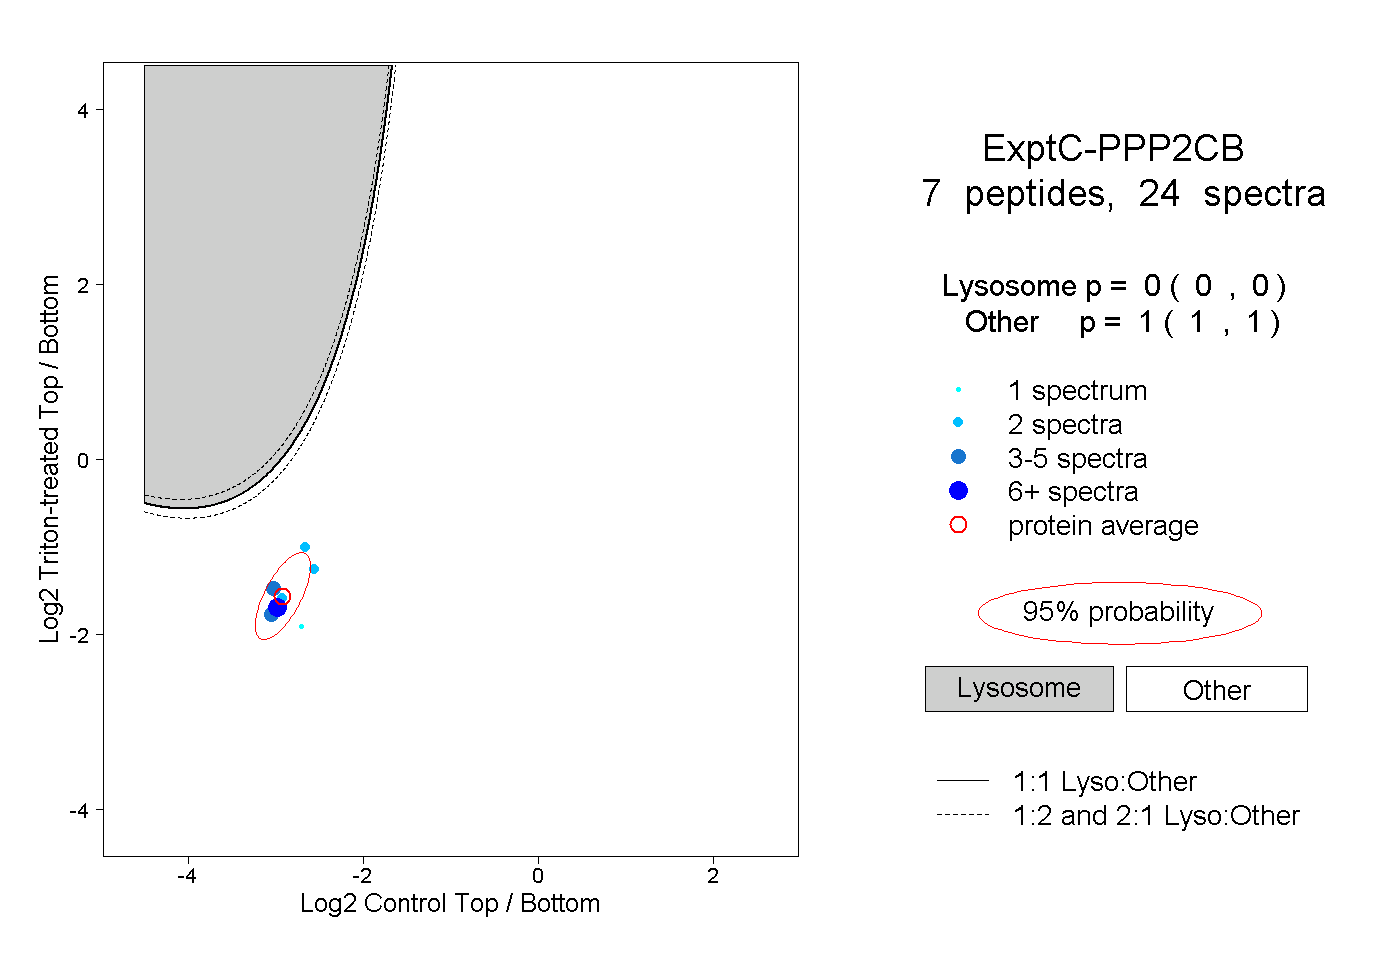
0.000 | 0.000
1.000 | 1.000
1peptide
spectrum
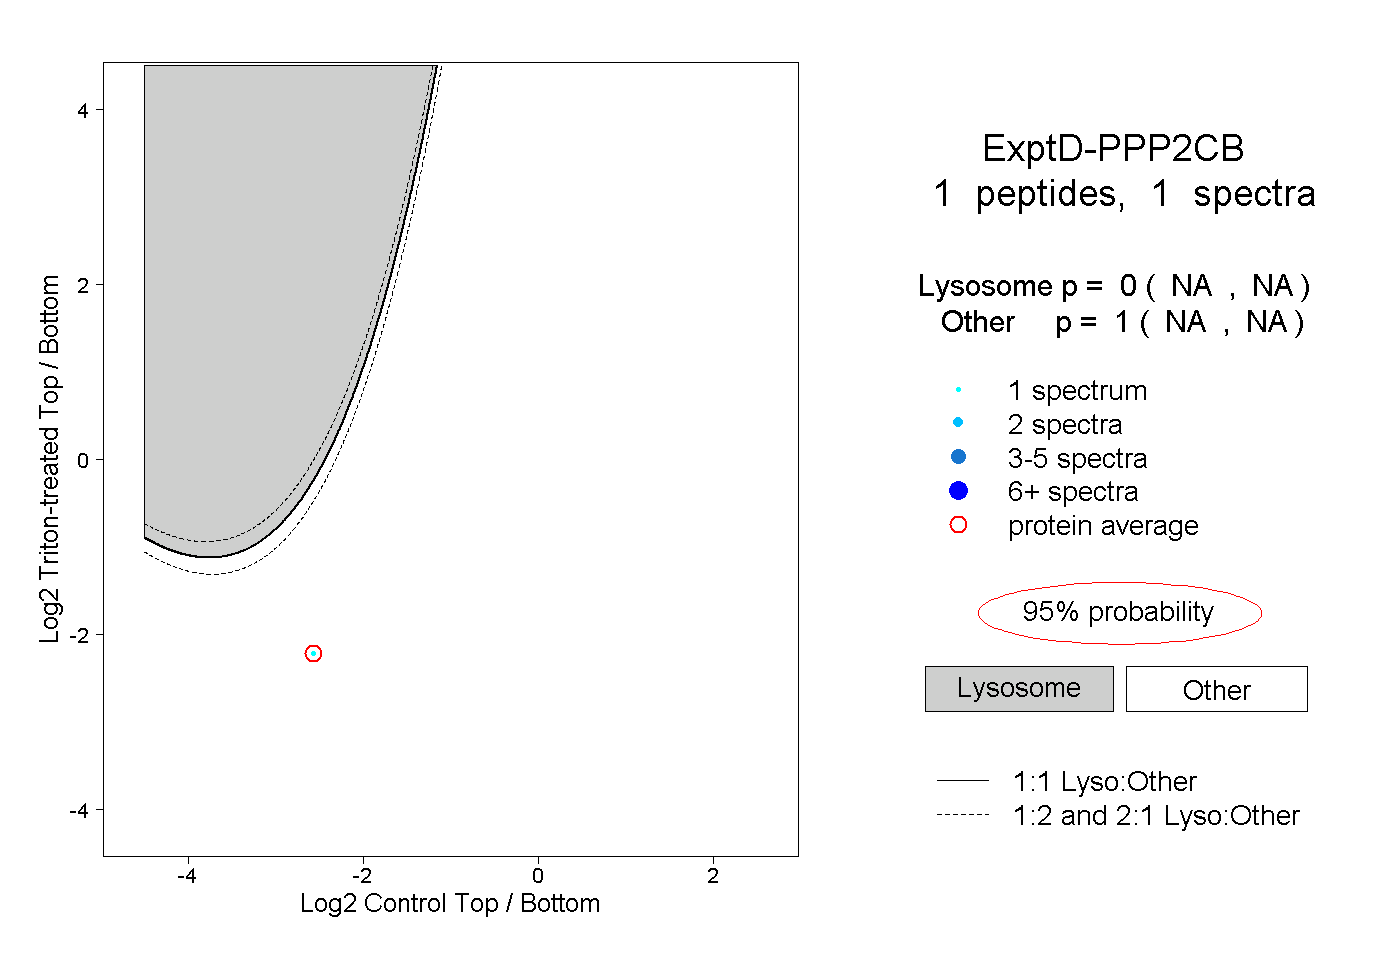
NA | NA
NA | NA