 12
12peptides
spectra
0.000 | 0.000
0.000 | 0.006
0.000 | 0.000
0.000 | 0.000
0.000 | 0.000
0.000 | 0.000
0.980 | 0.989
0.009 | 0.016
| Plot | Mito | Lyso | Perox | ER | Golgi | PM | Cytosol | Nucleus | |||||
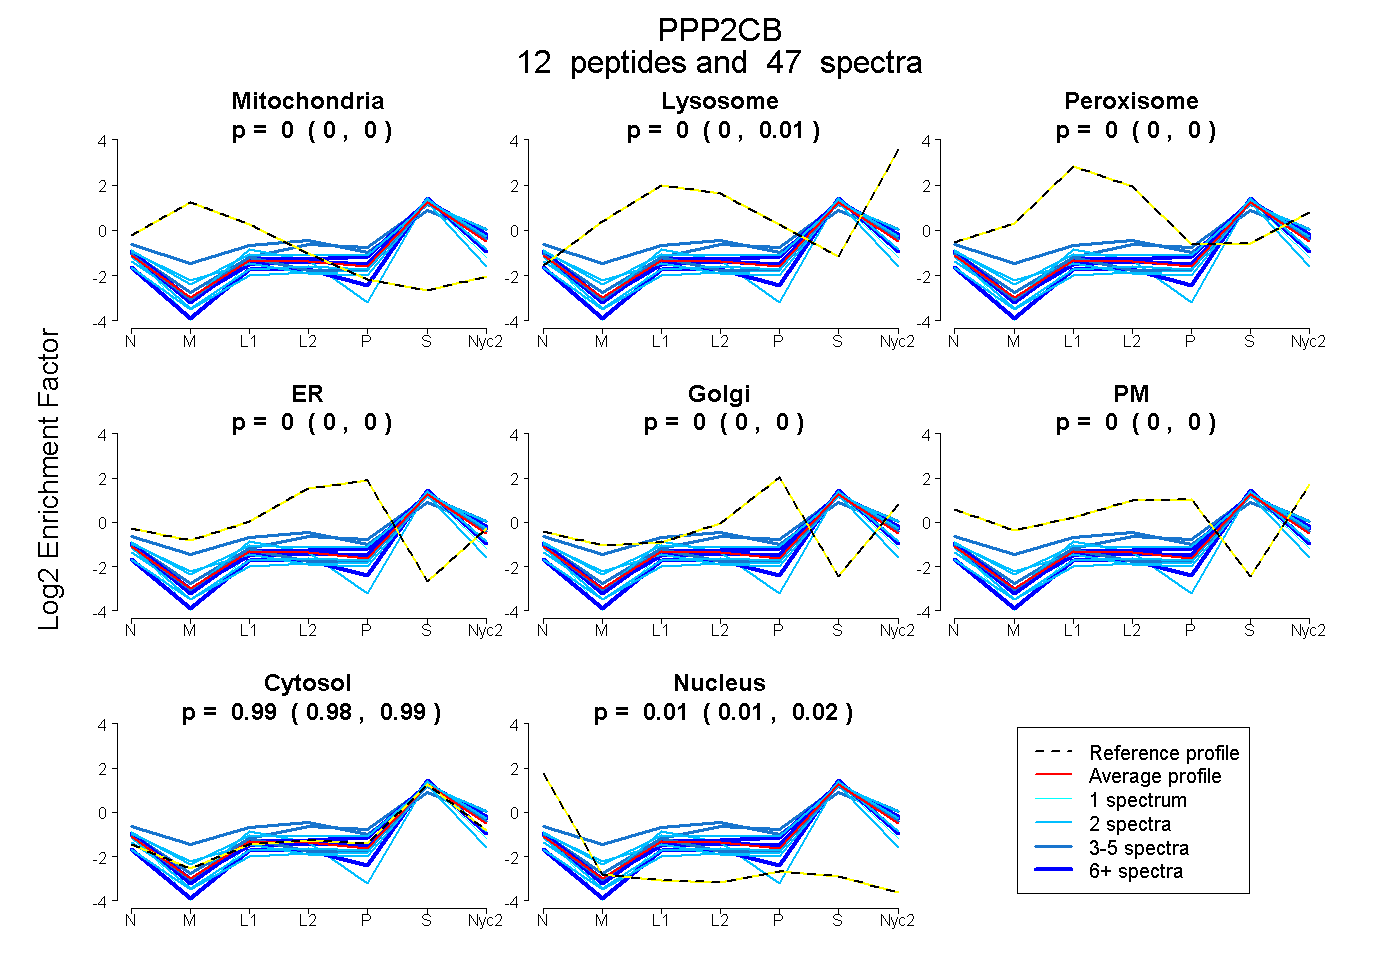
| Expt A |
12 peptides |
47 spectra |
|
0.000 0.000 | 0.000 |
0.001 0.000 | 0.006 |
0.000 0.000 | 0.000 |
0.000 0.000 | 0.000 |
0.000 0.000 | 0.000 |
0.000 0.000 | 0.000 |
0.986 0.980 | 0.989 |
0.013 0.009 | 0.016 |
| 8 spectra, GGWGISPR | 0.000 | 0.000 | 0.000 | 0.000 | 0.000 | 0.042 | 0.958 | 0.000 | ||
| 4 spectra, SPDTNYLFMGDYVDR | 0.000 | 0.000 | 0.000 | 0.000 | 0.000 | 0.000 | 0.971 | 0.029 | ||
| 7 spectra, LQEVPHEGPMCDLLWSDPDDR | 0.000 | 0.000 | 0.000 | 0.000 | 0.000 | 0.000 | 0.958 | 0.042 | ||
| 8 spectra, ESNVQEVR | 0.000 | 0.000 | 0.000 | 0.000 | 0.000 | 0.011 | 0.977 | 0.012 | ||
| 2 spectra, NVVTIFSAPNYCYR | 0.000 | 0.000 | 0.000 | 0.000 | 0.000 | 0.000 | 0.968 | 0.032 | ||
| 2 spectra, YSFLQFDPAPR | 0.000 | 0.000 | 0.000 | 0.000 | 0.000 | 0.000 | 0.980 | 0.020 | ||
| 2 spectra, YGNANVWK | 0.000 | 0.079 | 0.000 | 0.000 | 0.000 | 0.054 | 0.867 | 0.000 | ||
| 2 spectra, QITQVYGFYDECLR | 0.016 | 0.000 | 0.000 | 0.000 | 0.000 | 0.000 | 0.860 | 0.124 | ||
| 4 spectra, AHQLVMEGYNWCHDR | 0.000 | 0.000 | 0.177 | 0.000 | 0.000 | 0.111 | 0.712 | 0.000 | ||
| 1 spectrum, ELDQWVEQLNECK | 0.000 | 0.000 | 0.000 | 0.000 | 0.000 | 0.000 | 0.935 | 0.065 | ||
| 5 spectra, CGNQAAIMELDDTLK | 0.000 | 0.051 | 0.000 | 0.000 | 0.000 | 0.100 | 0.849 | 0.000 | ||
| 2 spectra, GAGYTFGQDISETFNHANGLTLVSR | 0.000 | 0.000 | 0.000 | 0.000 | 0.000 | 0.000 | 0.996 | 0.004 |
| Plot | Mito | Lyso or Perox | ER | Golgi | PM | Cytosol | Nucleus | ||||||
| Expt B |
4 peptides |
8 spectra |
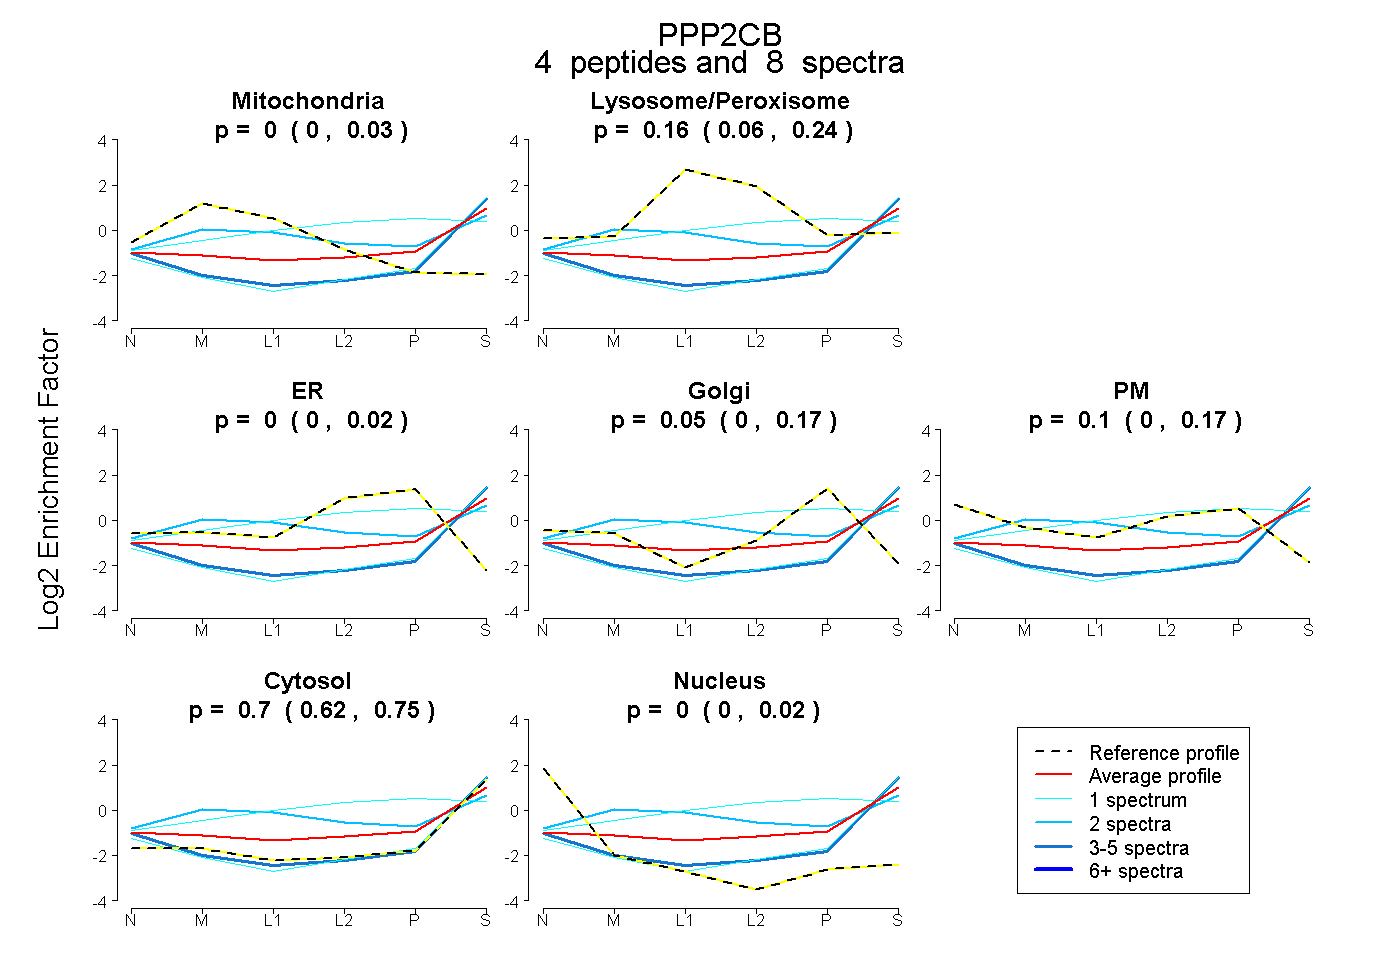 |
0.000 0.000 | 0.031 |
0.162 0.060 | 0.245 |
0.000 0.000 | 0.023 |
0.046 0.000 | 0.172 |
0.098 0.000 | 0.169 |
0.695 0.619 | 0.749 |
0.000 0.000 | 0.022 |
|||
| Plot | Lyso | Other | |||||||||||
| Expt C |
7 peptides |
24 spectra |
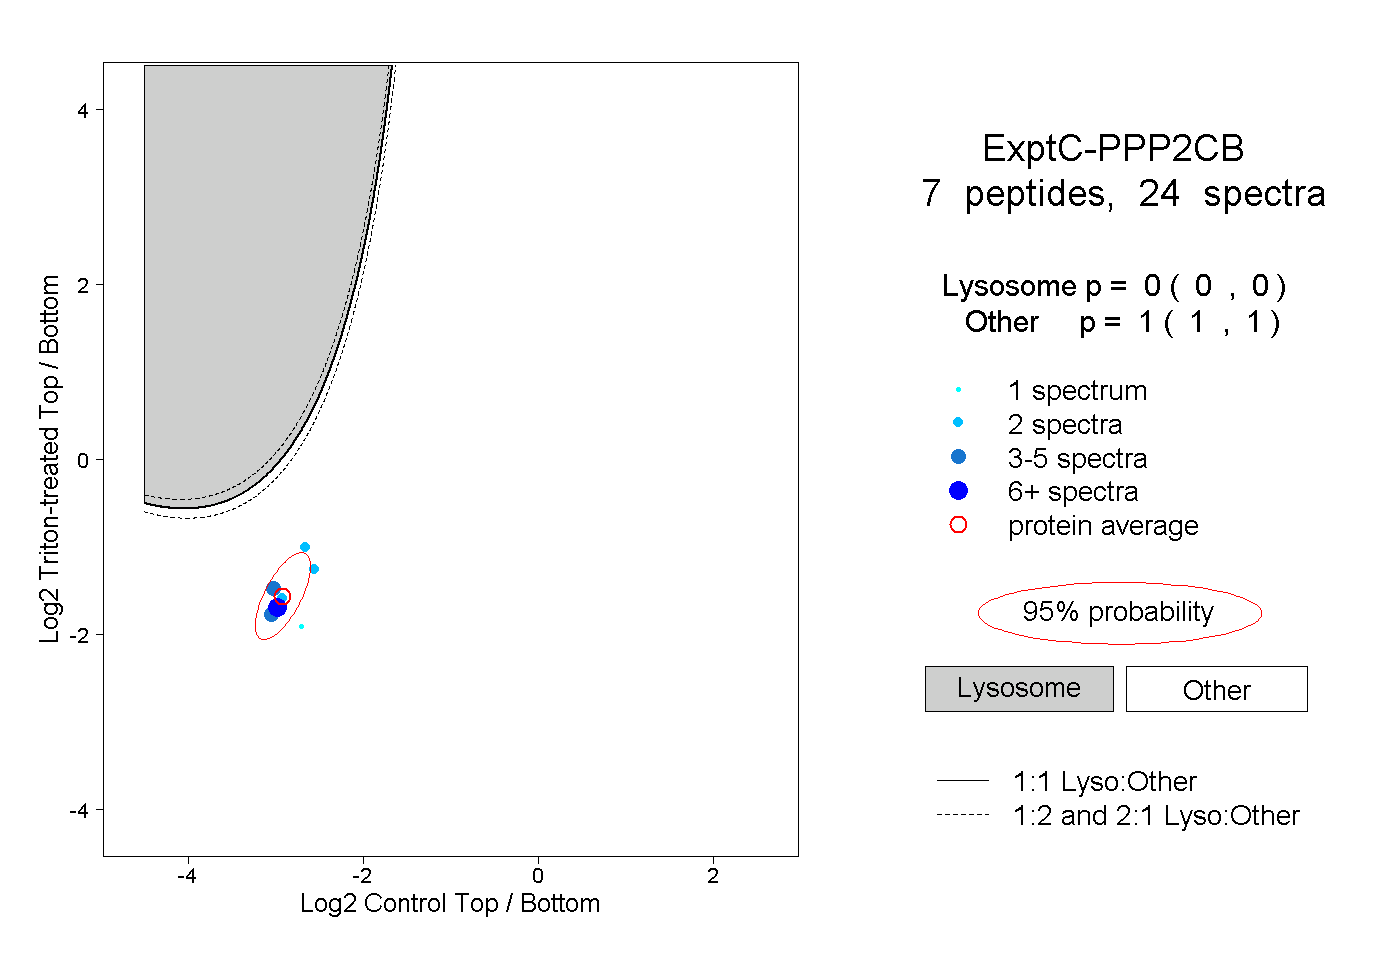 |
0.000 0.000 | 0.000 |
1.000 1.000 | 1.000 |
||||||||
| Plot | Lyso | Other | |||||||||||
| Expt D |
1 peptide |
1 spectrum |
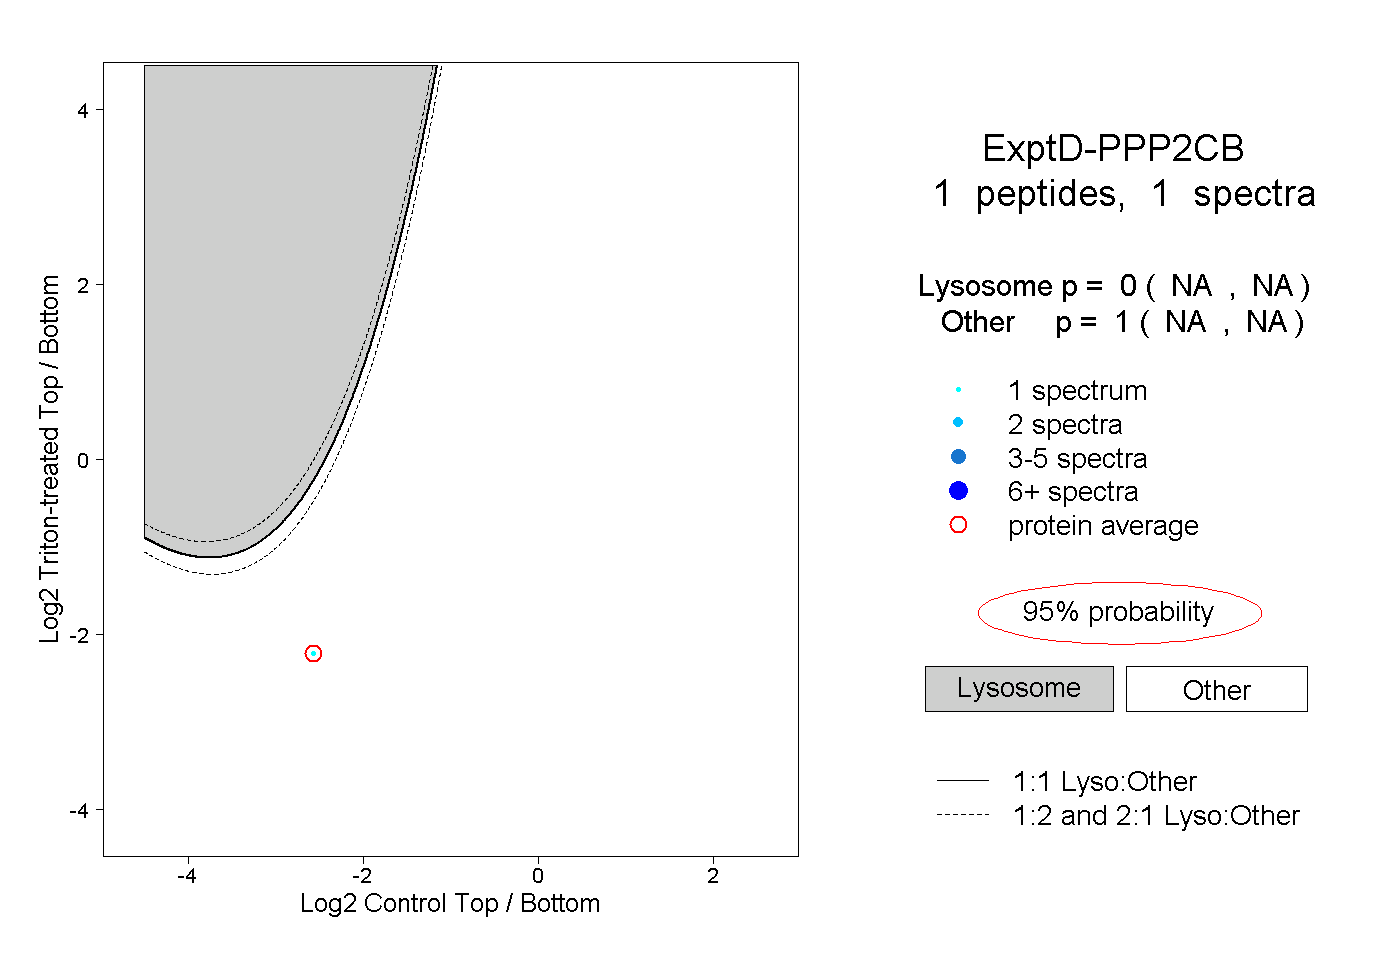 |
0.000 NA | NA |
1.000 NA | NA |