 11
11peptides
spectra
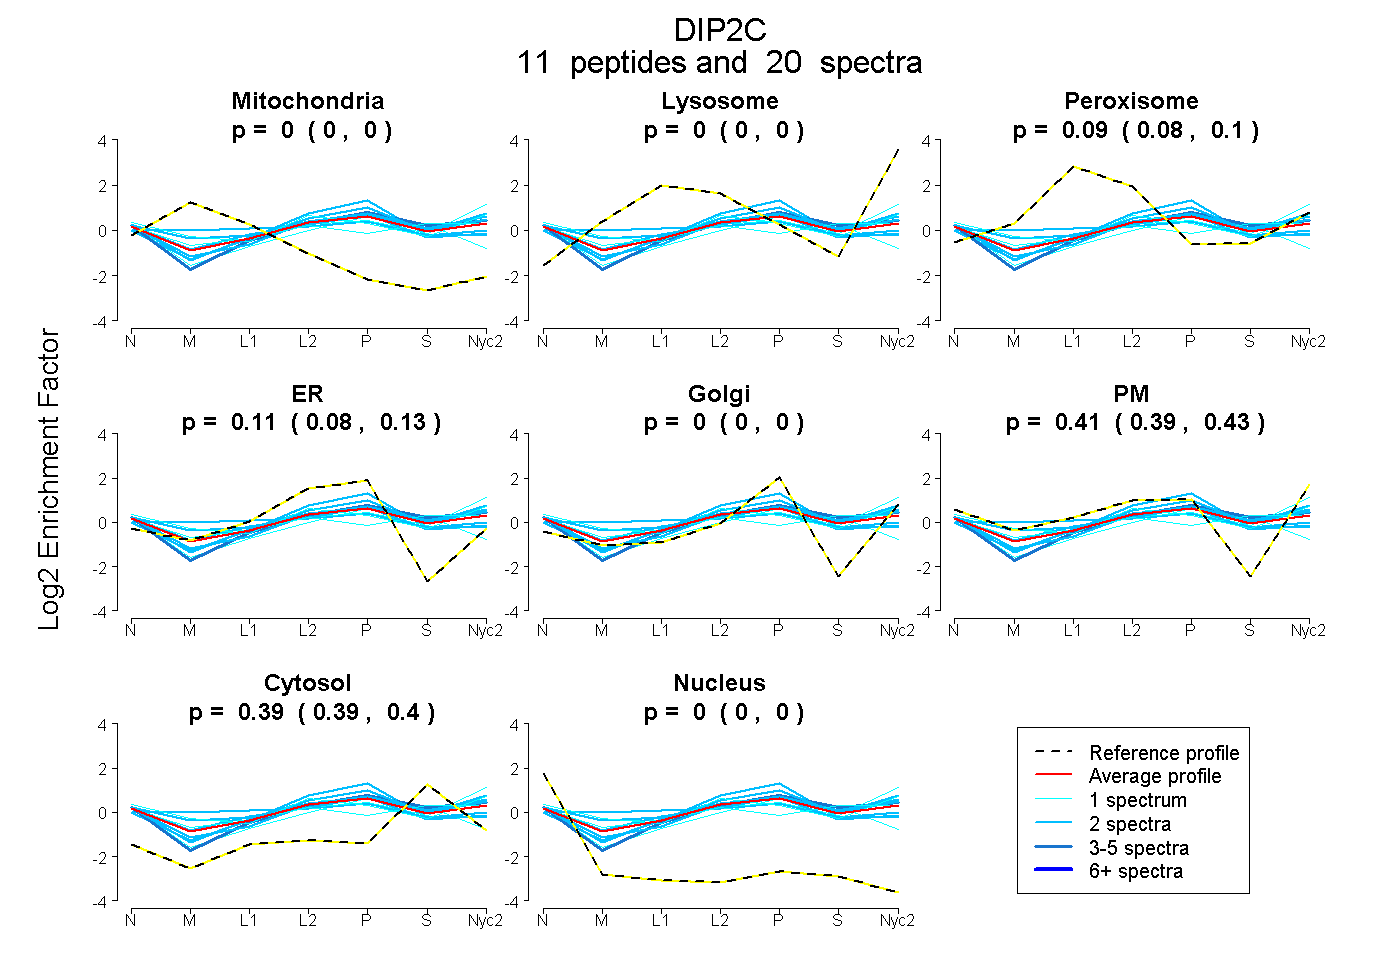
0.000 | 0.000
0.000 | 0.000
0.079 | 0.097
0.081 | 0.125
0.000 | 0.000
0.387 | 0.434
0.386 | 0.398
0.000 | 0.000
1peptide
spectrum
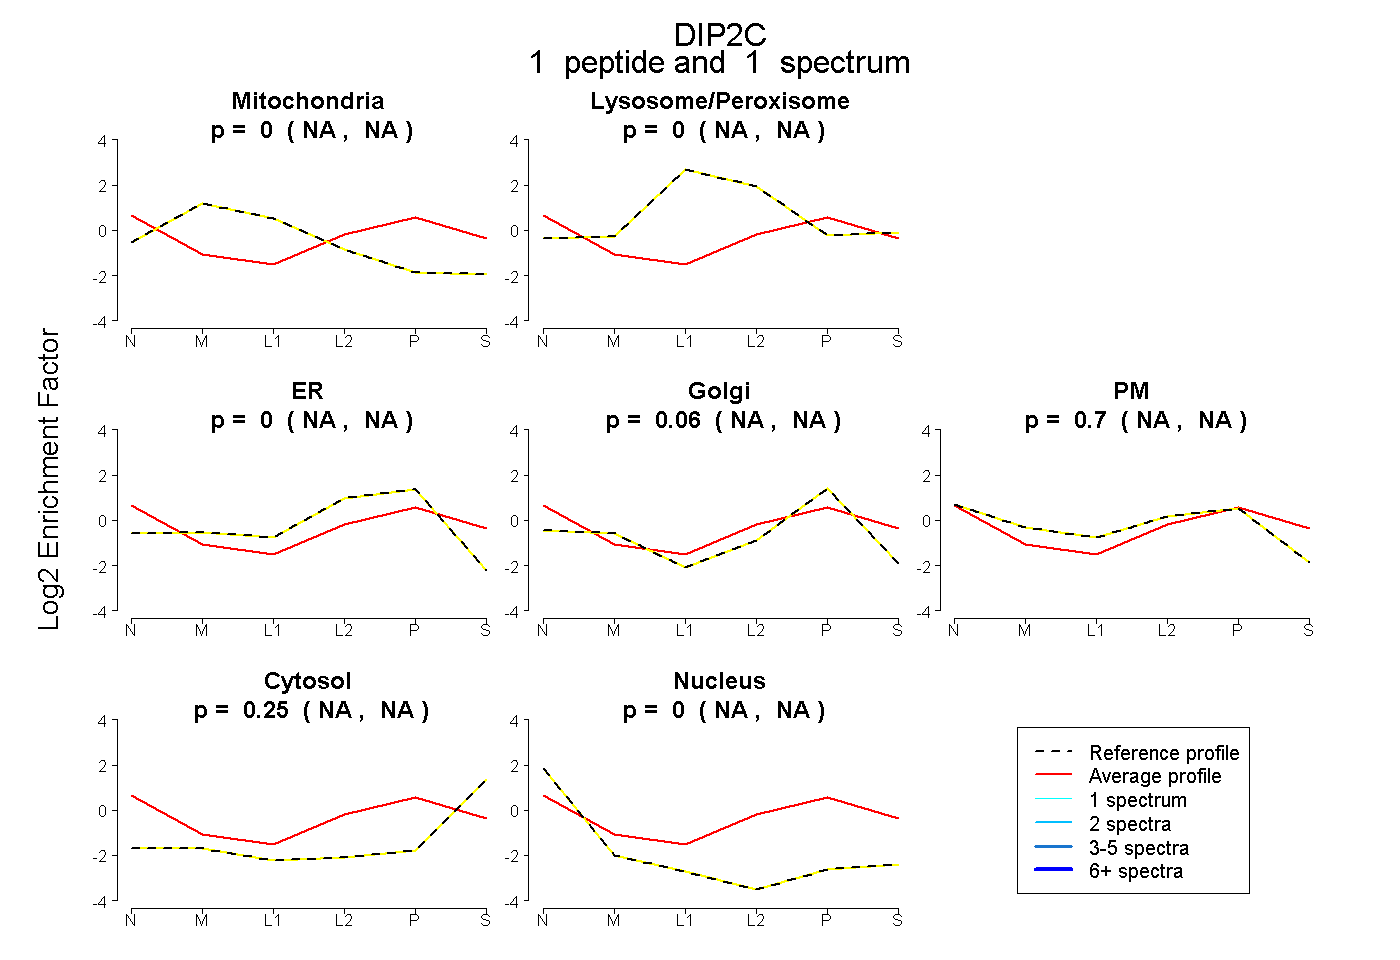
NA | NA
NA | NA
NA | NA
NA | NA
NA | NA
NA | NA
NA | NA
15peptides
spectra
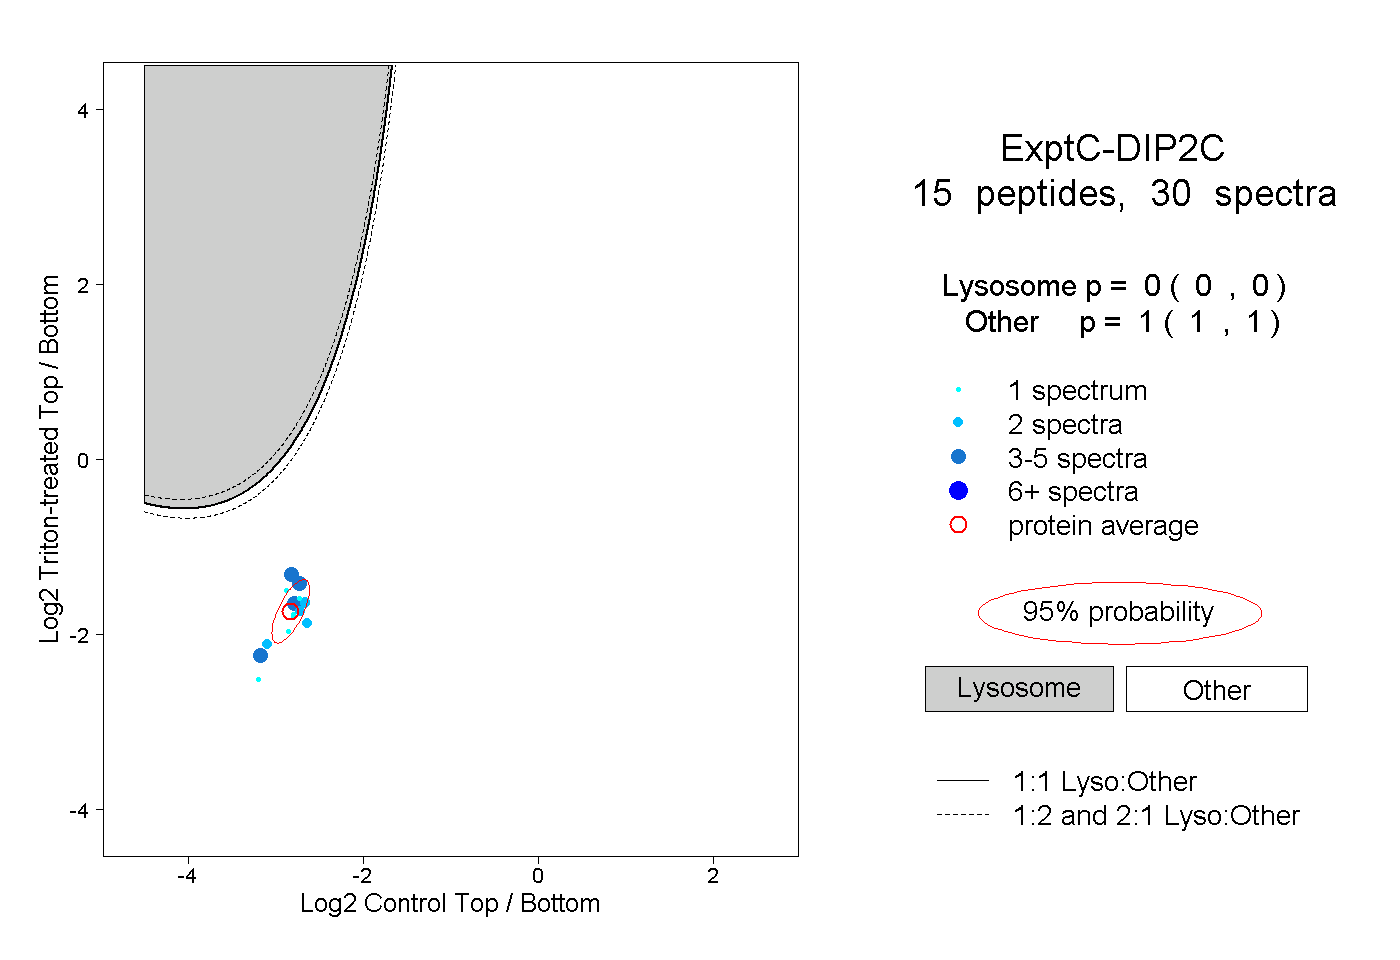
0.000 | 0.000
1.000 | 1.000
4peptides
spectra
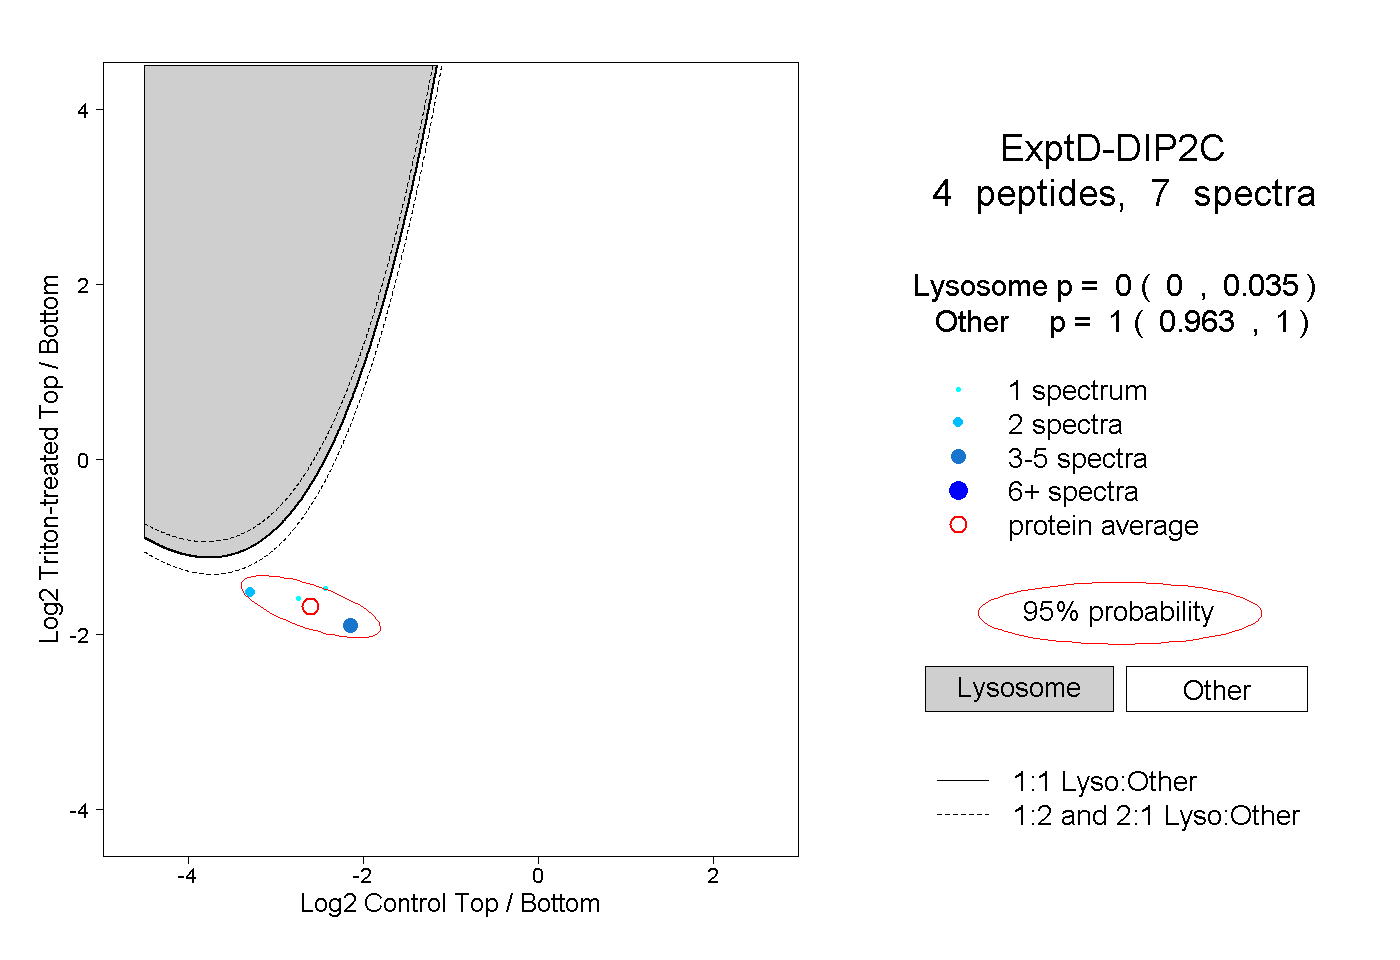
0.000 | 0.035
0.963 | 1.000