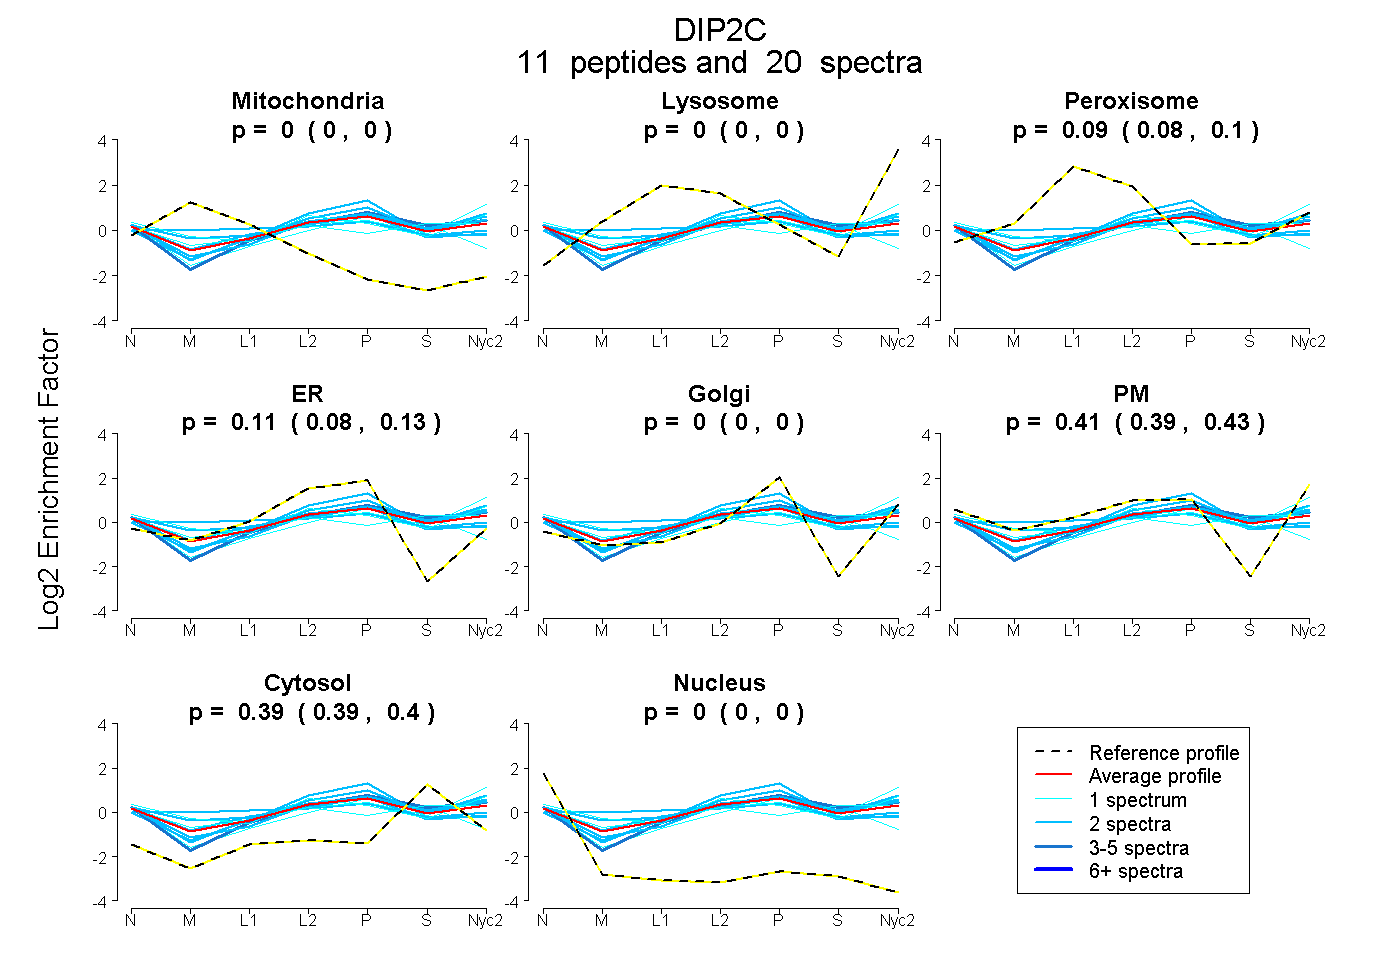
 11
11peptides
spectra
0.000 | 0.000
0.000 | 0.000
0.079 | 0.097
0.081 | 0.125
0.000 | 0.000
0.387 | 0.434
0.386 | 0.398
0.000 | 0.000
| Plot | Mito | Lyso | Perox | ER | Golgi | PM | Cytosol | Nucleus | |||||
| Expt A |
11 peptides |
20 spectra |
|
0.000 0.000 | 0.000 |
0.000 0.000 | 0.000 |
0.089 0.079 | 0.097 |
0.107 0.081 | 0.125 |
0.000 0.000 | 0.000 |
0.412 0.387 | 0.434 |
0.392 0.386 | 0.398 |
0.000 0.000 | 0.000 |
| 2 spectra, RPTDDSNQPPGR | 0.031 | 0.000 | 0.126 | 0.257 | 0.000 | 0.265 | 0.321 | 0.000 | ||
| 2 spectra, LLWFVTESK | 0.000 | 0.000 | 0.008 | 0.039 | 0.000 | 0.530 | 0.423 | 0.000 | ||
| 4 spectra, DLGQIEDNDQAR | 0.000 | 0.000 | 0.006 | 0.089 | 0.000 | 0.445 | 0.460 | 0.000 | ||
| 1 spectrum, VDSEEK | 0.000 | 0.000 | 0.118 | 0.000 | 0.000 | 0.561 | 0.321 | 0.000 | ||
| 1 spectrum, TWPLILDTDDLPK | 0.000 | 0.000 | 0.177 | 0.000 | 0.000 | 0.369 | 0.454 | 0.000 | ||
| 1 spectrum, AVSTSFGCR | 0.000 | 0.000 | 0.000 | 0.386 | 0.000 | 0.073 | 0.533 | 0.008 | ||
| 2 spectra, DGSVLGVTVTR | 0.092 | 0.000 | 0.296 | 0.000 | 0.247 | 0.112 | 0.253 | 0.000 | ||
| 2 spectra, DLGLHPR | 0.000 | 0.000 | 0.046 | 0.505 | 0.000 | 0.104 | 0.346 | 0.000 | ||
| 2 spectra, ILPGVR | 0.000 | 0.000 | 0.030 | 0.080 | 0.000 | 0.525 | 0.365 | 0.000 | ||
| 2 spectra, TGYLGFLR | 0.000 | 0.000 | 0.138 | 0.000 | 0.076 | 0.423 | 0.363 | 0.000 | ||
| 1 spectrum, IQQLVNTLK | 0.000 | 0.097 | 0.025 | 0.000 | 0.000 | 0.534 | 0.344 | 0.000 |
| Plot | Mito | Lyso or Perox | ER | Golgi | PM | Cytosol | Nucleus | ||||||
| Expt B |
1 peptide |
1 spectrum |
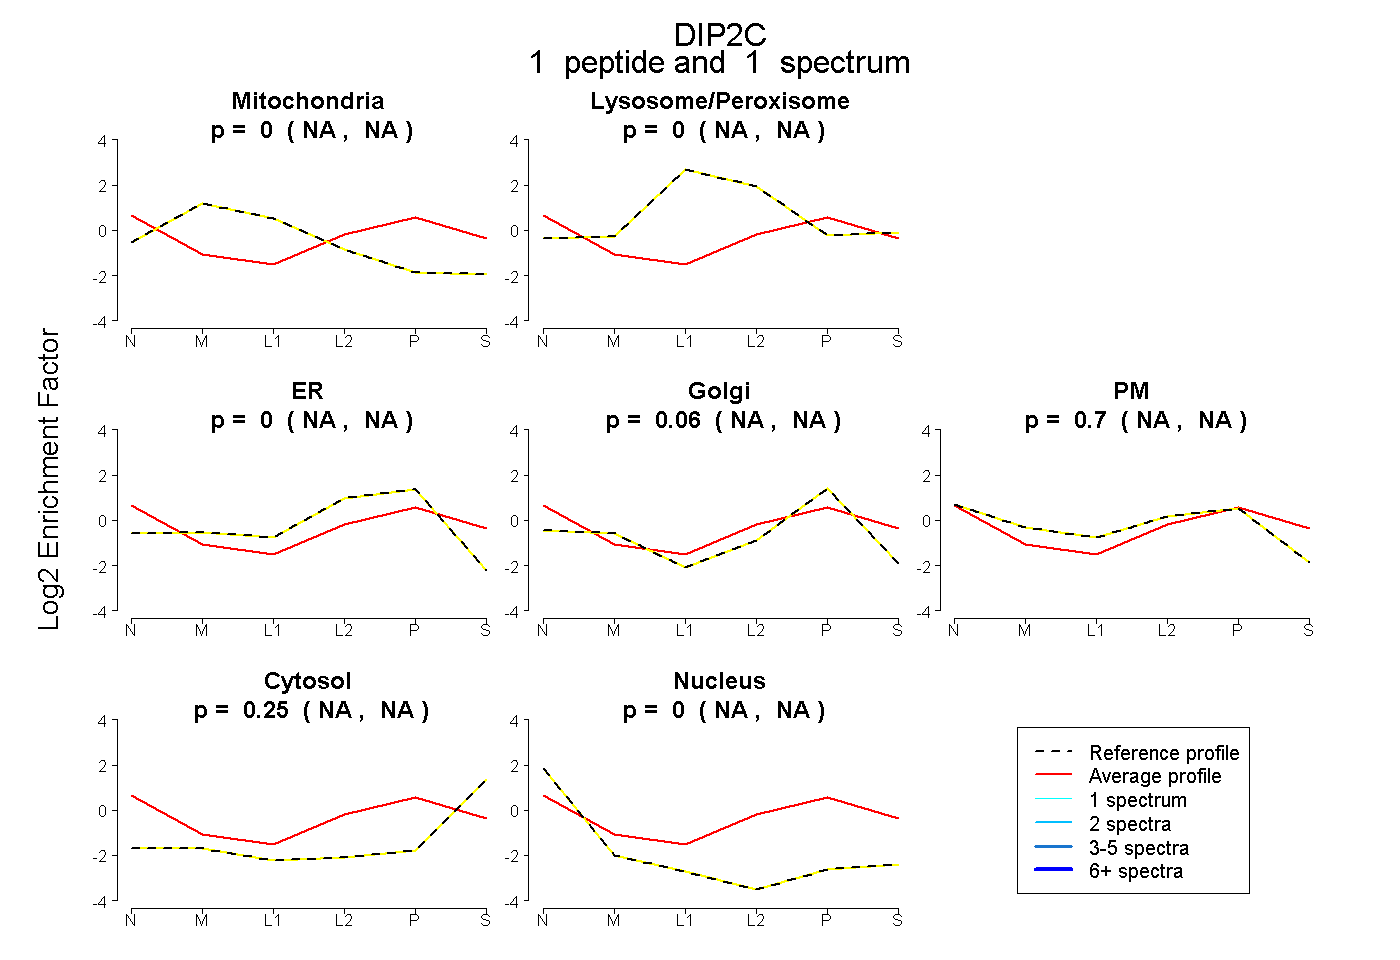 |
0.000 NA | NA |
0.000 NA | NA |
0.000 NA | NA |
0.055 NA | NA |
0.699 NA | NA |
0.245 NA | NA |
0.000 NA | NA |
|||
| Plot | Lyso | Other | |||||||||||
| Expt C |
15 peptides |
30 spectra |
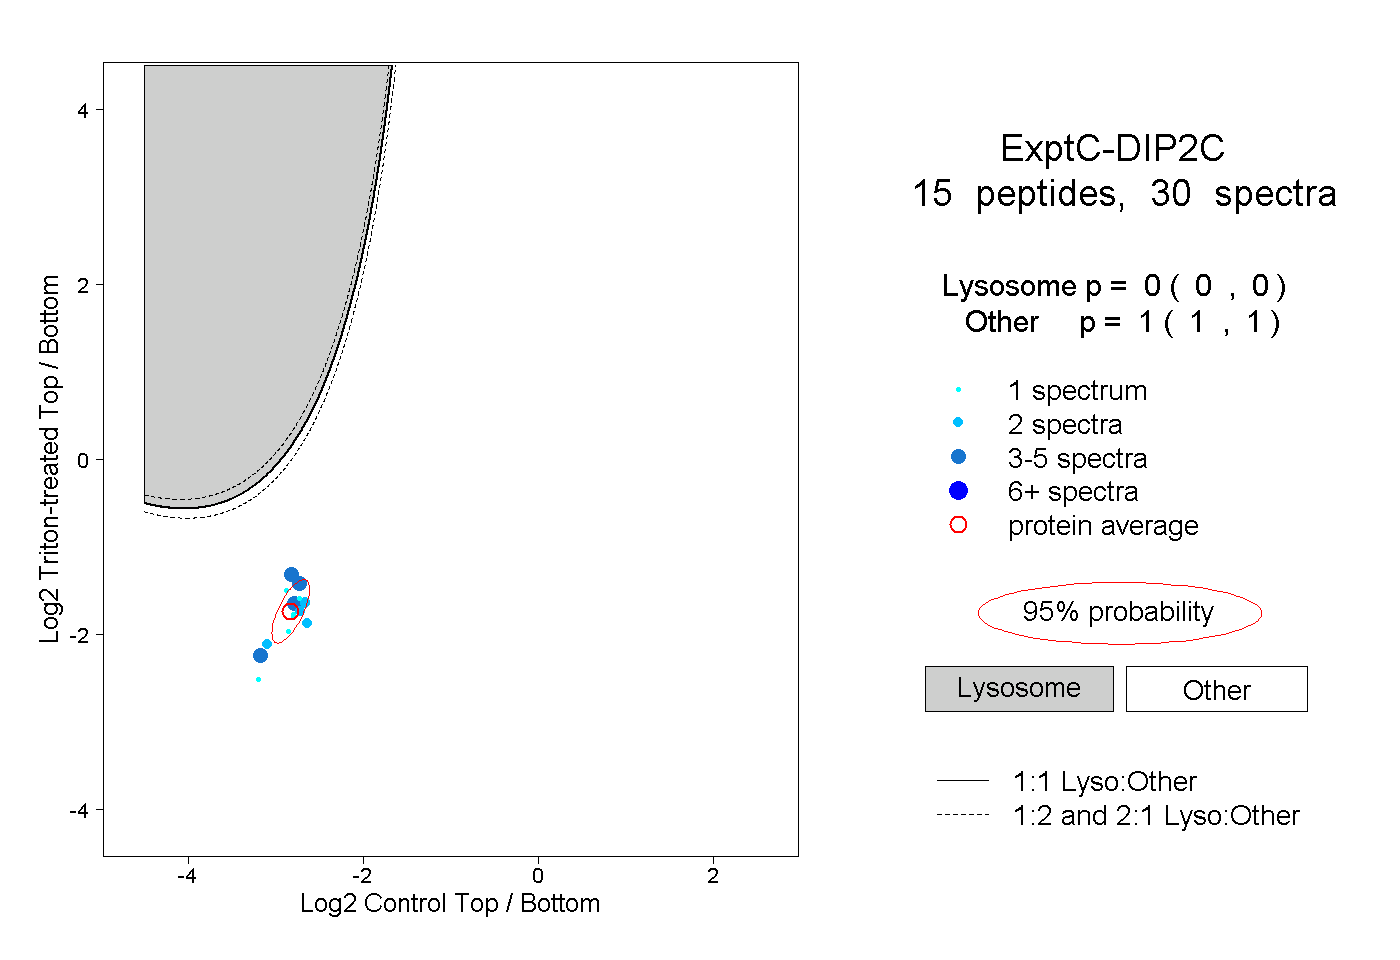 |
0.000 0.000 | 0.000 |
1.000 1.000 | 1.000 |
||||||||
| Plot | Lyso | Other | |||||||||||
| Expt D |
4 peptides |
7 spectra |
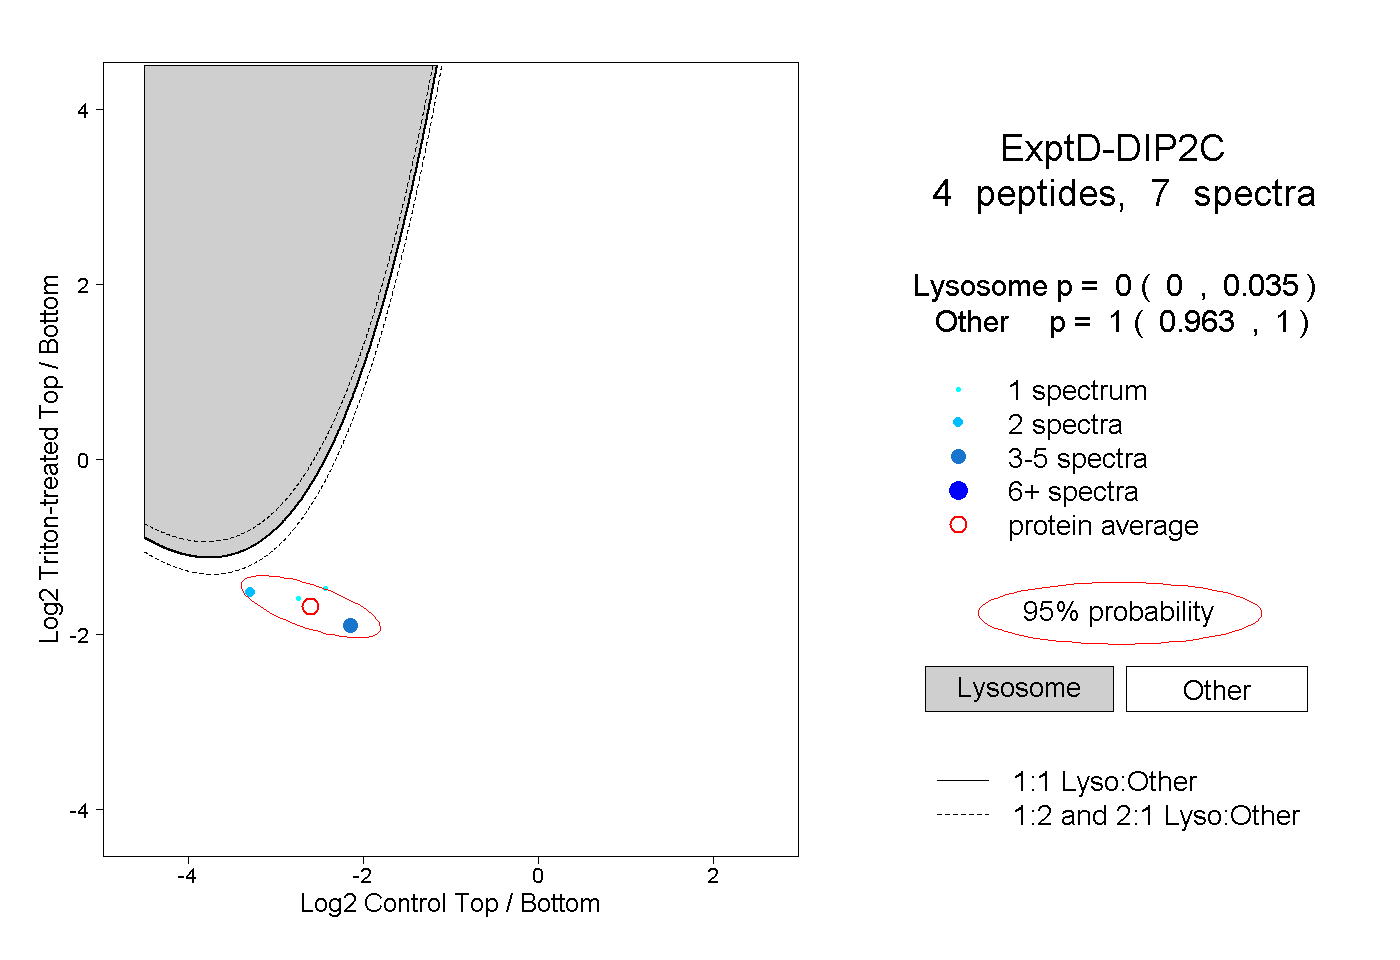 |
0.000 0.000 | 0.035 |
1.000 0.963 | 1.000 |