 5
5peptides
spectra
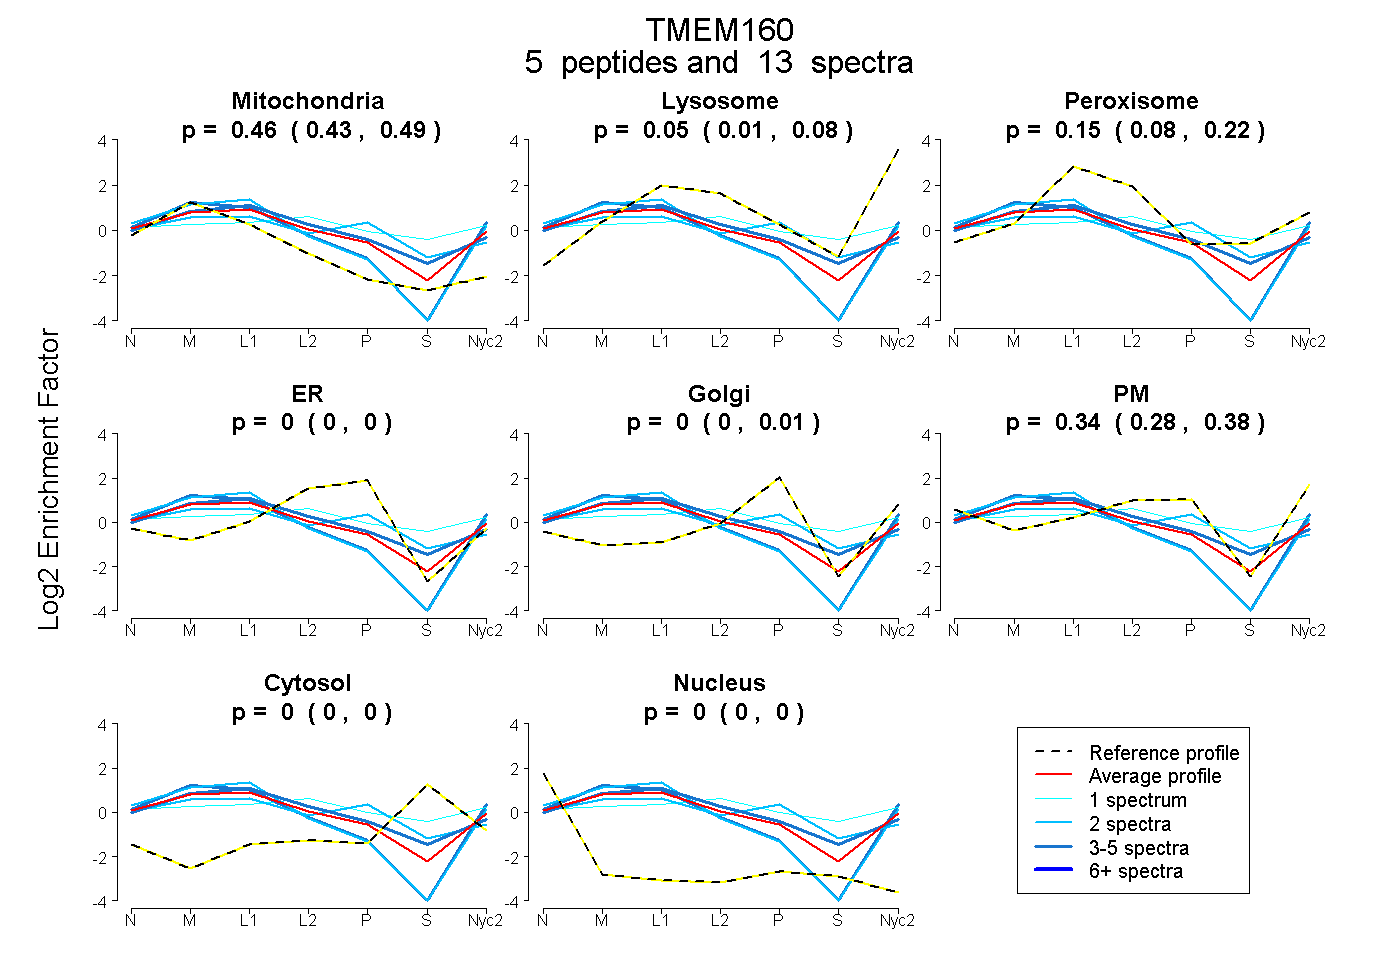
0.428 | 0.491
0.008 | 0.076
0.076 | 0.215
0.000 | 0.000
0.000 | 0.009
0.283 | 0.380
0.000 | 0.000
0.000 | 0.000
4peptides
spectra
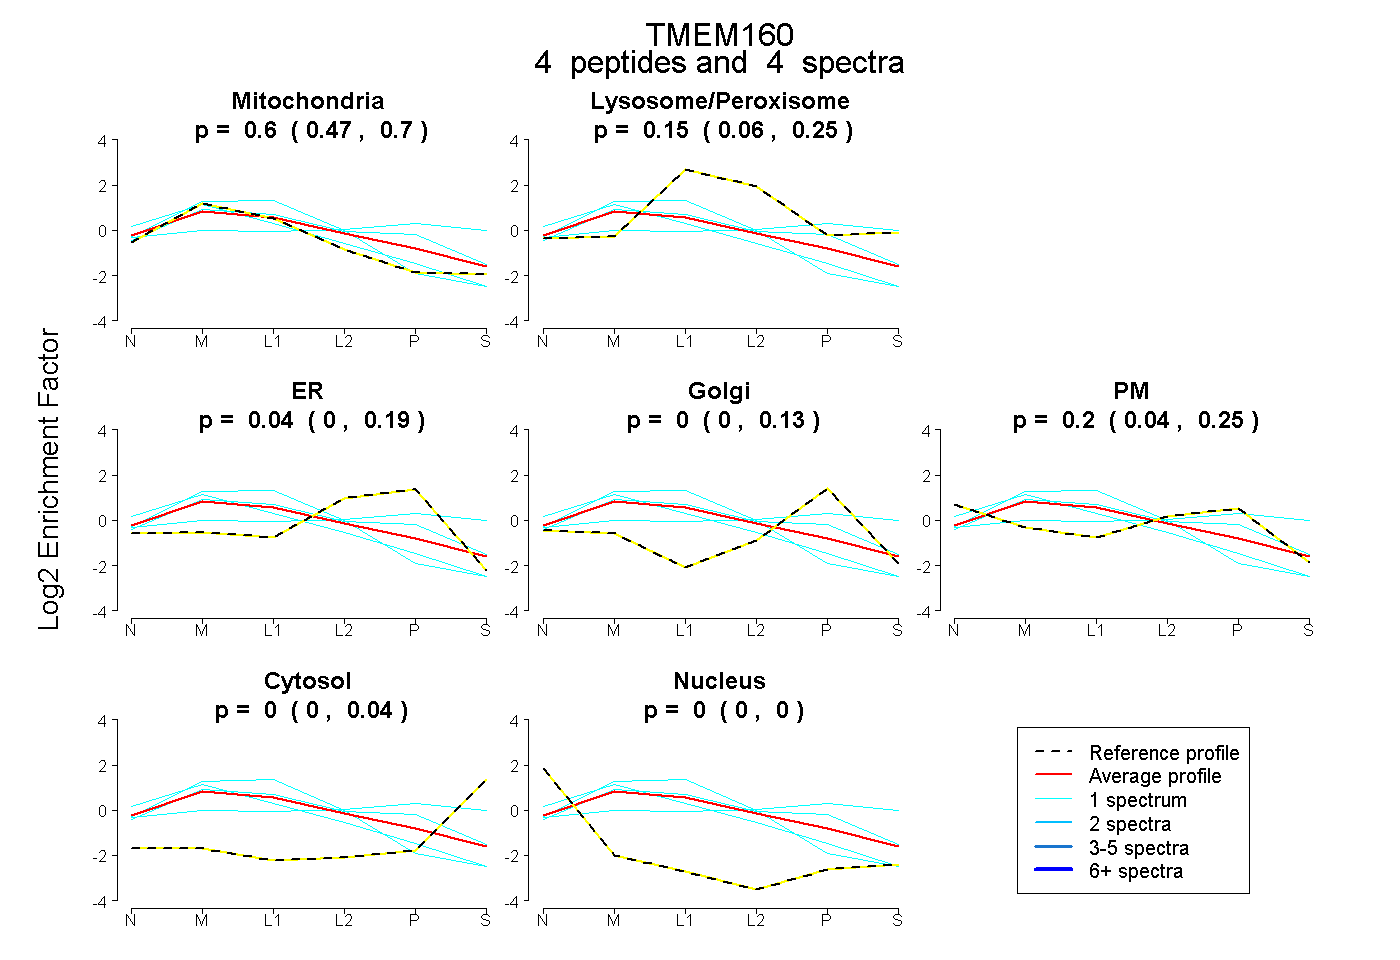
0.465 | 0.701
0.059 | 0.253
0.000 | 0.192
0.000 | 0.133
0.035 | 0.249
0.000 | 0.036
0.000 | 0.000
4peptides
spectra
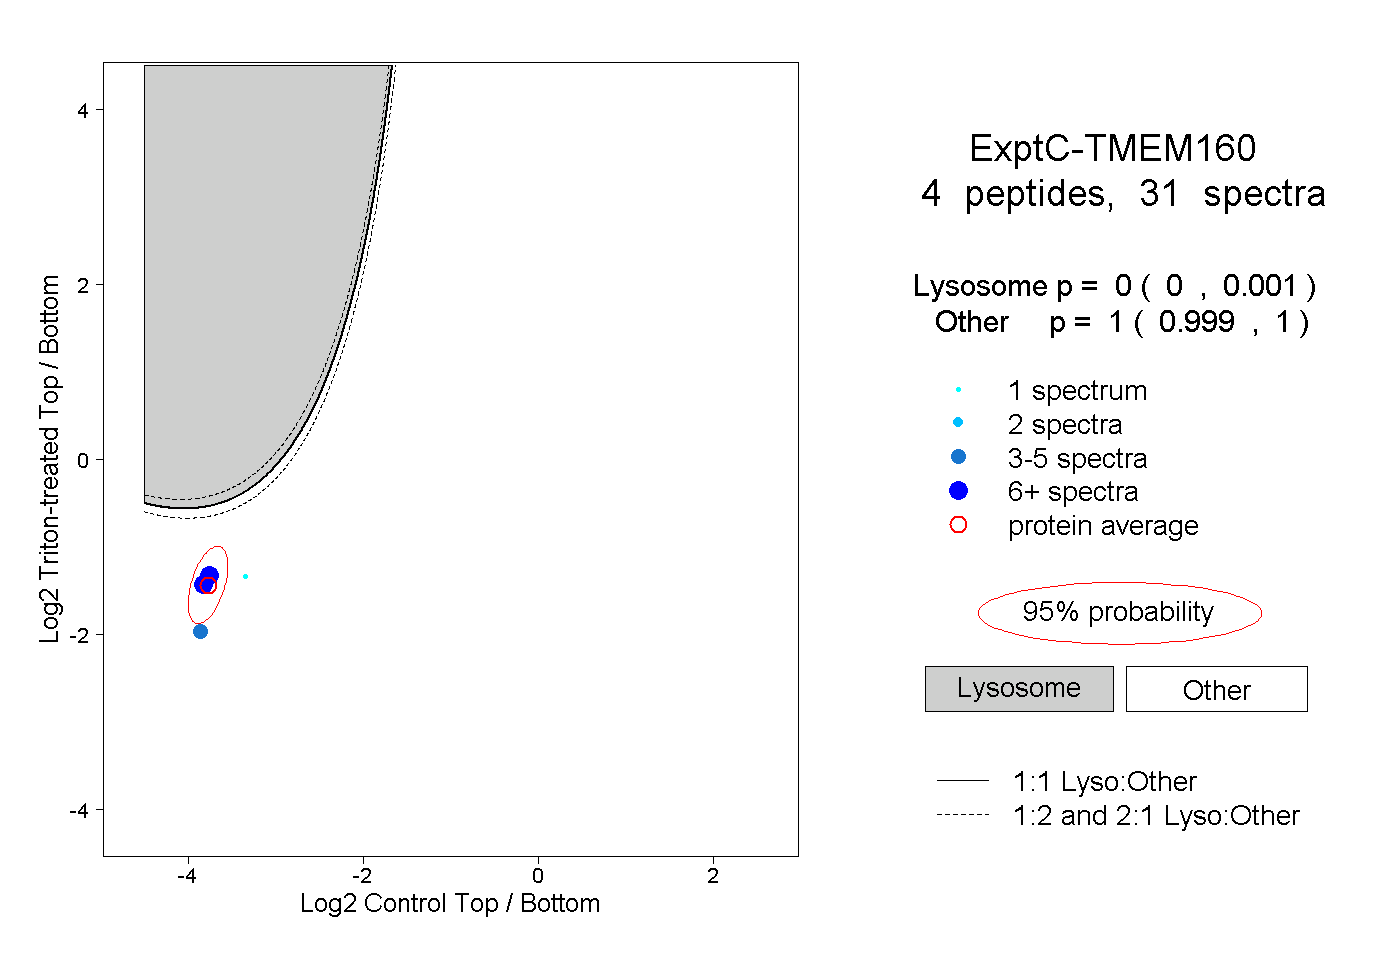
0.000 | 0.001
0.999 | 1.000
1peptide
spectrum
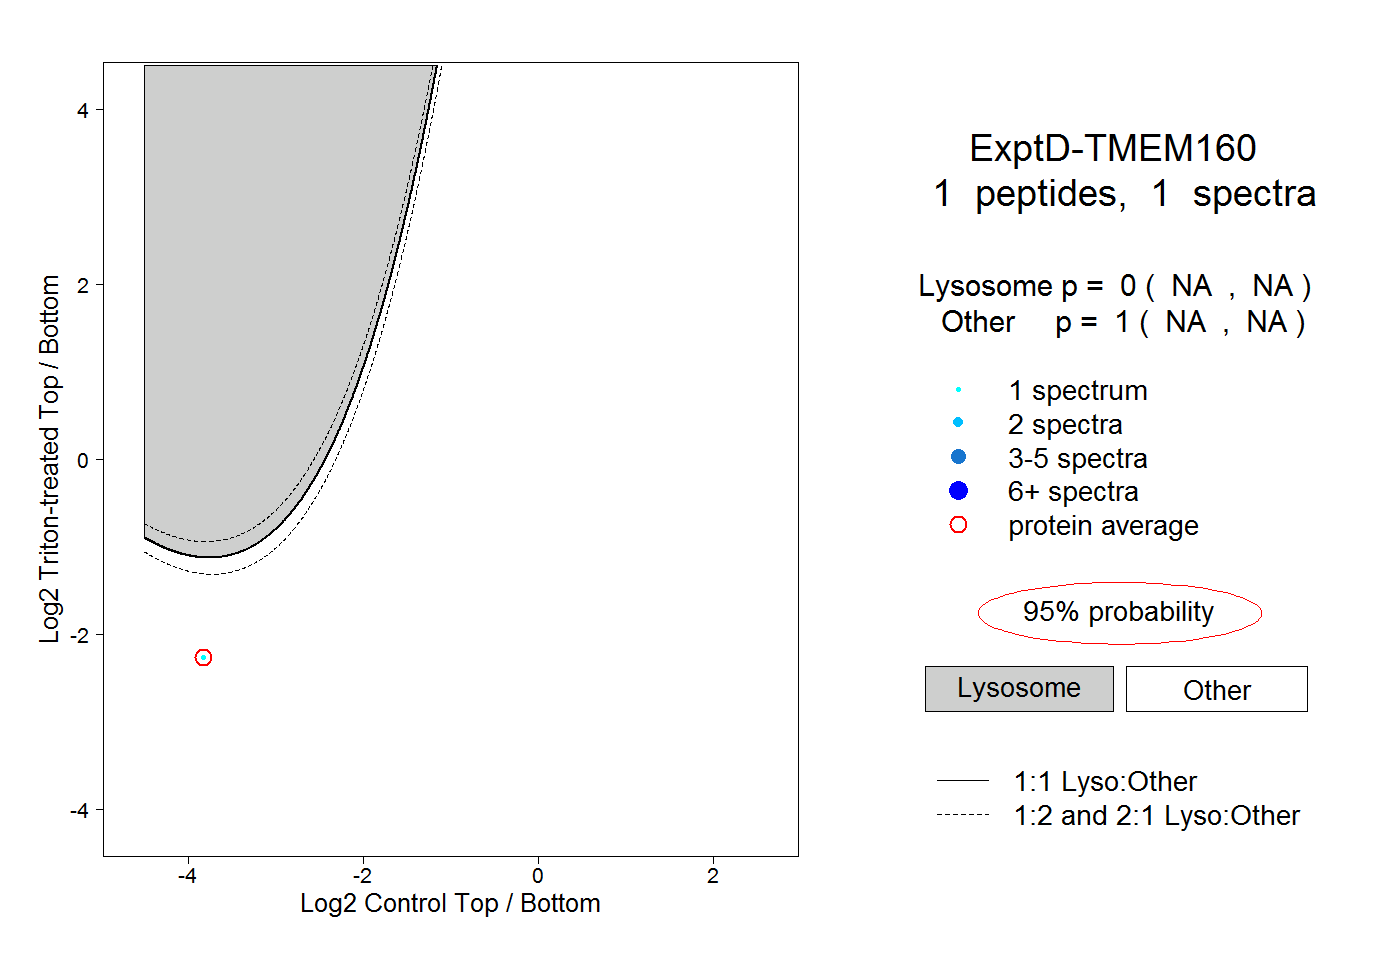
NA | NA
NA | NA