 5
5peptides
spectra
0.428 | 0.491
0.008 | 0.076
0.076 | 0.215
0.000 | 0.000
0.000 | 0.009
0.283 | 0.380
0.000 | 0.000
0.000 | 0.000
| Plot | Mito | Lyso | Perox | ER | Golgi | PM | Cytosol | Nucleus | |||||
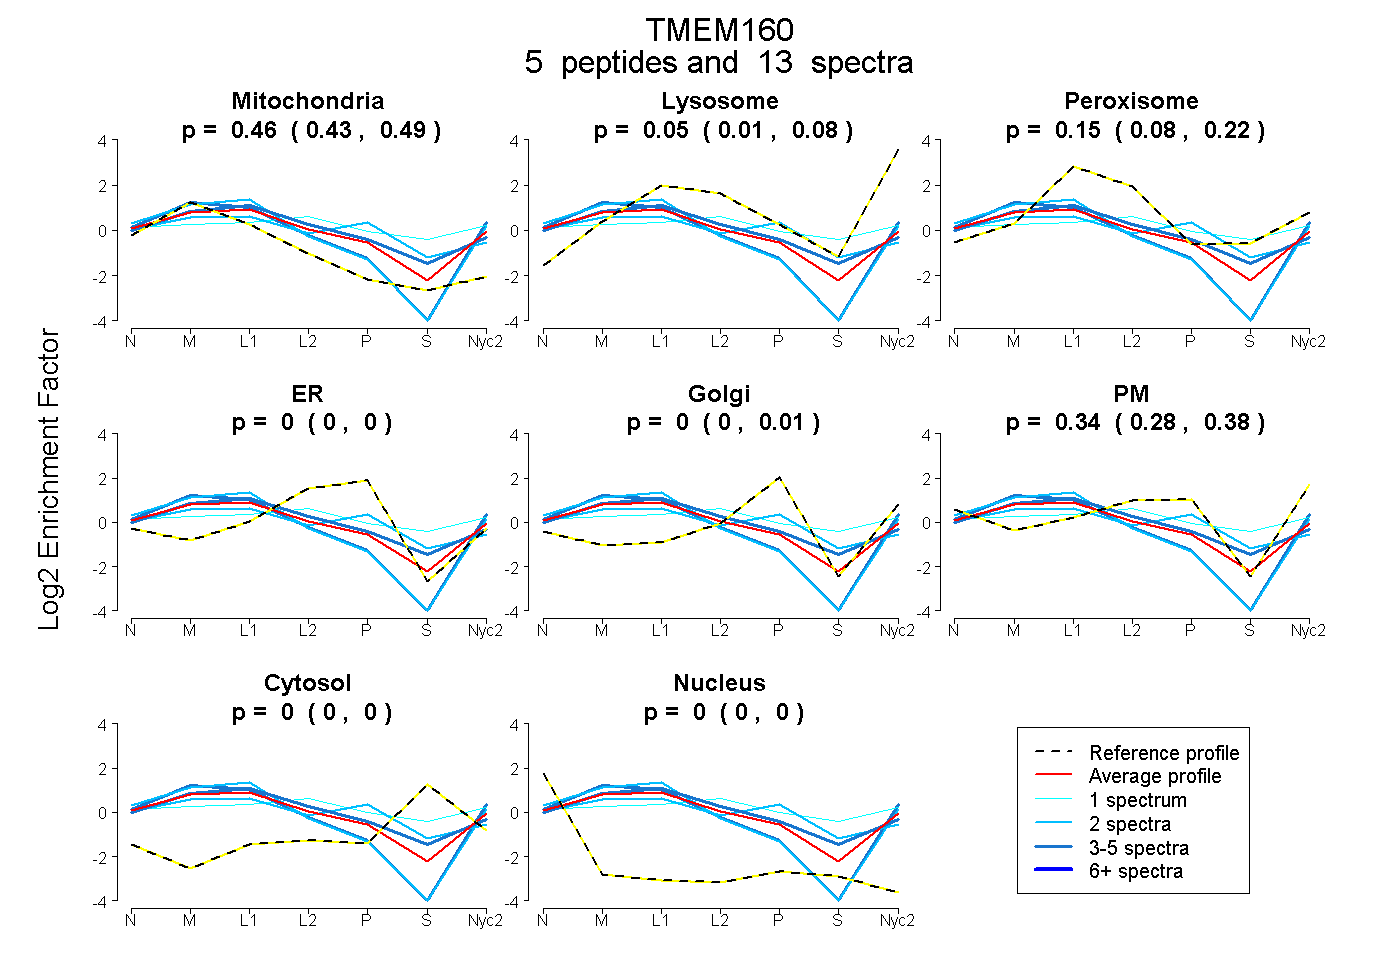
| Expt A |
5 peptides |
13 spectra |
|
0.463 0.428 | 0.491 |
0.046 0.008 | 0.076 |
0.150 0.076 | 0.215 |
0.000 0.000 | 0.000 |
0.000 0.000 | 0.009 |
0.341 0.283 | 0.380 |
0.000 0.000 | 0.000 |
0.000 0.000 | 0.000 |
| 1 spectrum, AGASPPPVSELDR | 0.124 | 0.000 | 0.315 | 0.000 | 0.000 | 0.344 | 0.217 | 0.000 | ||
| 2 spectra, GSFAPGHGPR | 0.332 | 0.000 | 0.288 | 0.000 | 0.345 | 0.000 | 0.035 | 0.000 | ||
| 5 spectra, GSLQPLQRPR | 0.396 | 0.000 | 0.384 | 0.000 | 0.130 | 0.090 | 0.000 | 0.000 | ||
| 2 spectra, AHETAFLSWFR | 0.606 | 0.116 | 0.000 | 0.000 | 0.000 | 0.277 | 0.000 | 0.000 | ||
| 3 spectra, ADAWLLR | 0.587 | 0.124 | 0.000 | 0.000 | 0.000 | 0.289 | 0.000 | 0.000 |
| Plot | Mito | Lyso or Perox | ER | Golgi | PM | Cytosol | Nucleus | ||||||
| Expt B |
4 peptides |
4 spectra |
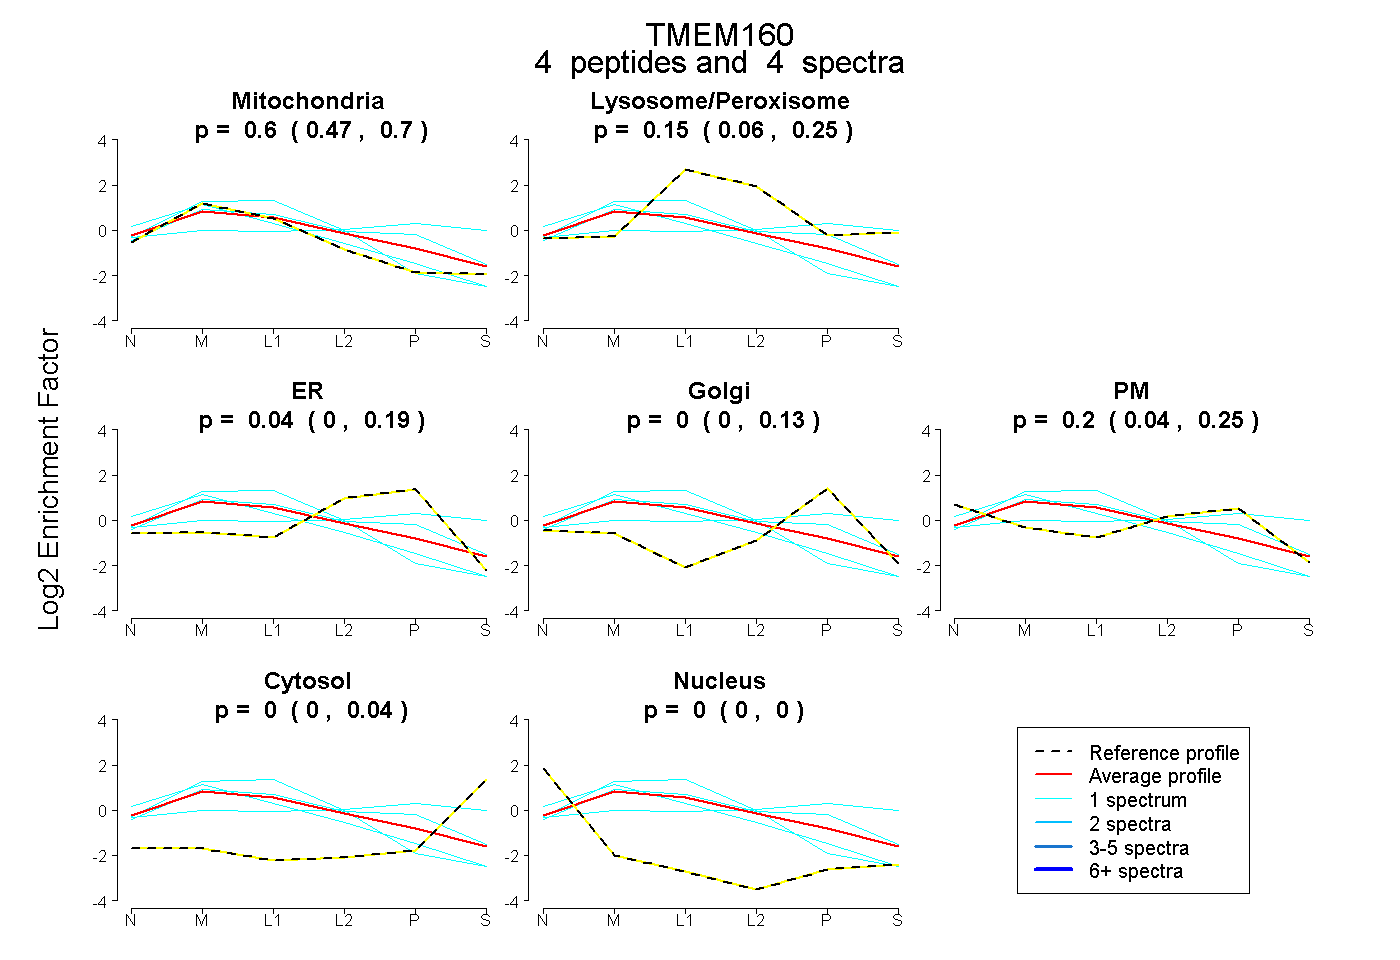 |
0.596 0.465 | 0.701 |
0.154 0.059 | 0.253 |
0.044 0.000 | 0.192 |
0.002 0.000 | 0.133 |
0.204 0.035 | 0.249 |
0.000 0.000 | 0.036 |
0.000 0.000 | 0.000 |
|||
| Plot | Lyso | Other | |||||||||||
| Expt C |
4 peptides |
31 spectra |
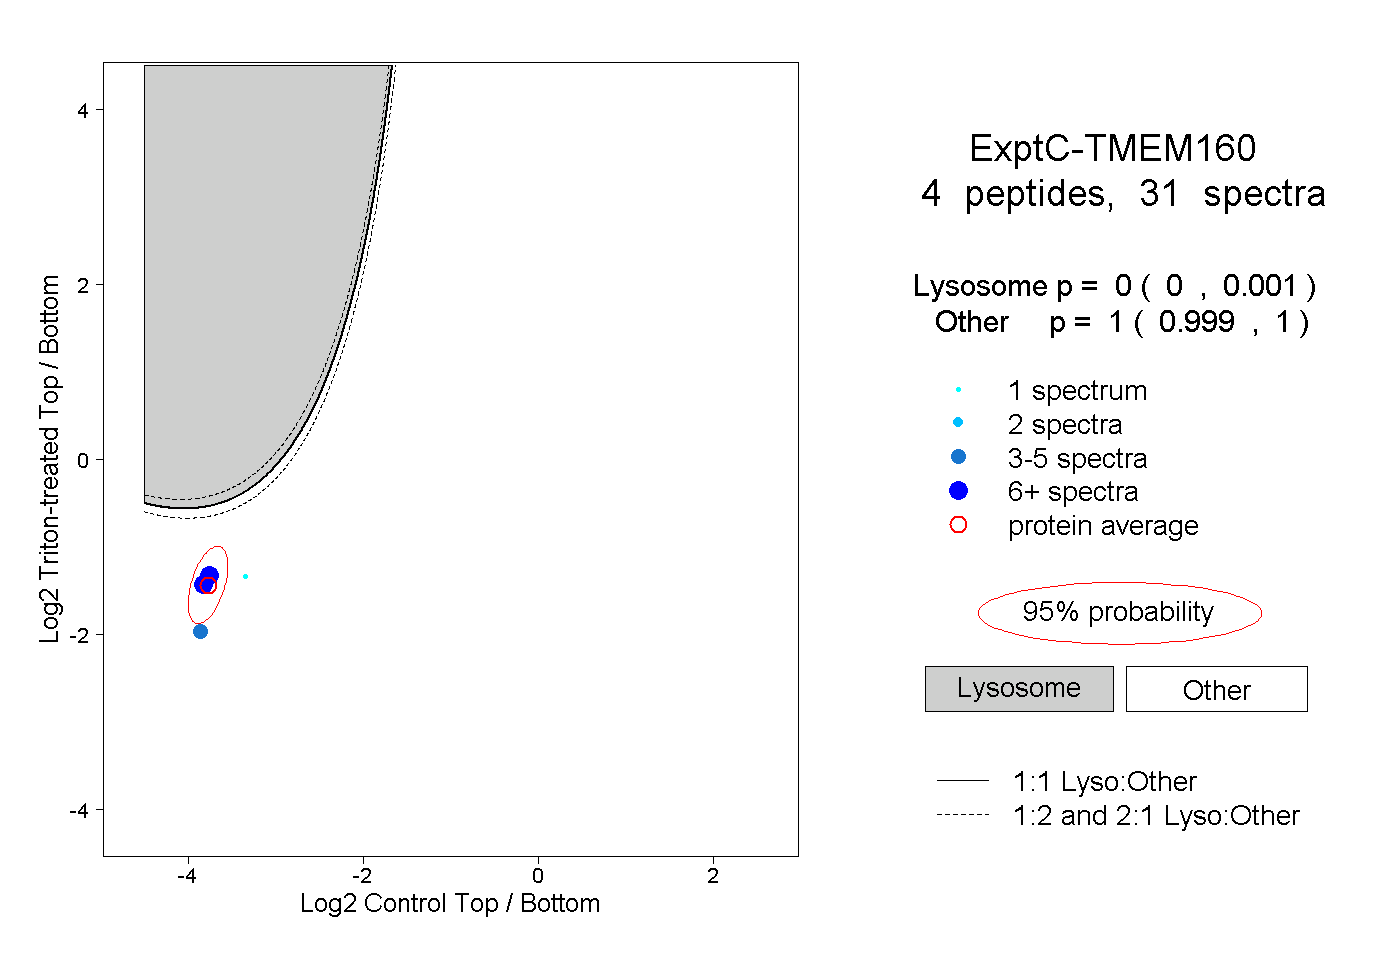 |
0.000 0.000 | 0.001 |
1.000 0.999 | 1.000 |
||||||||
| Plot | Lyso | Other | |||||||||||
| Expt D |
1 peptide |
1 spectrum |
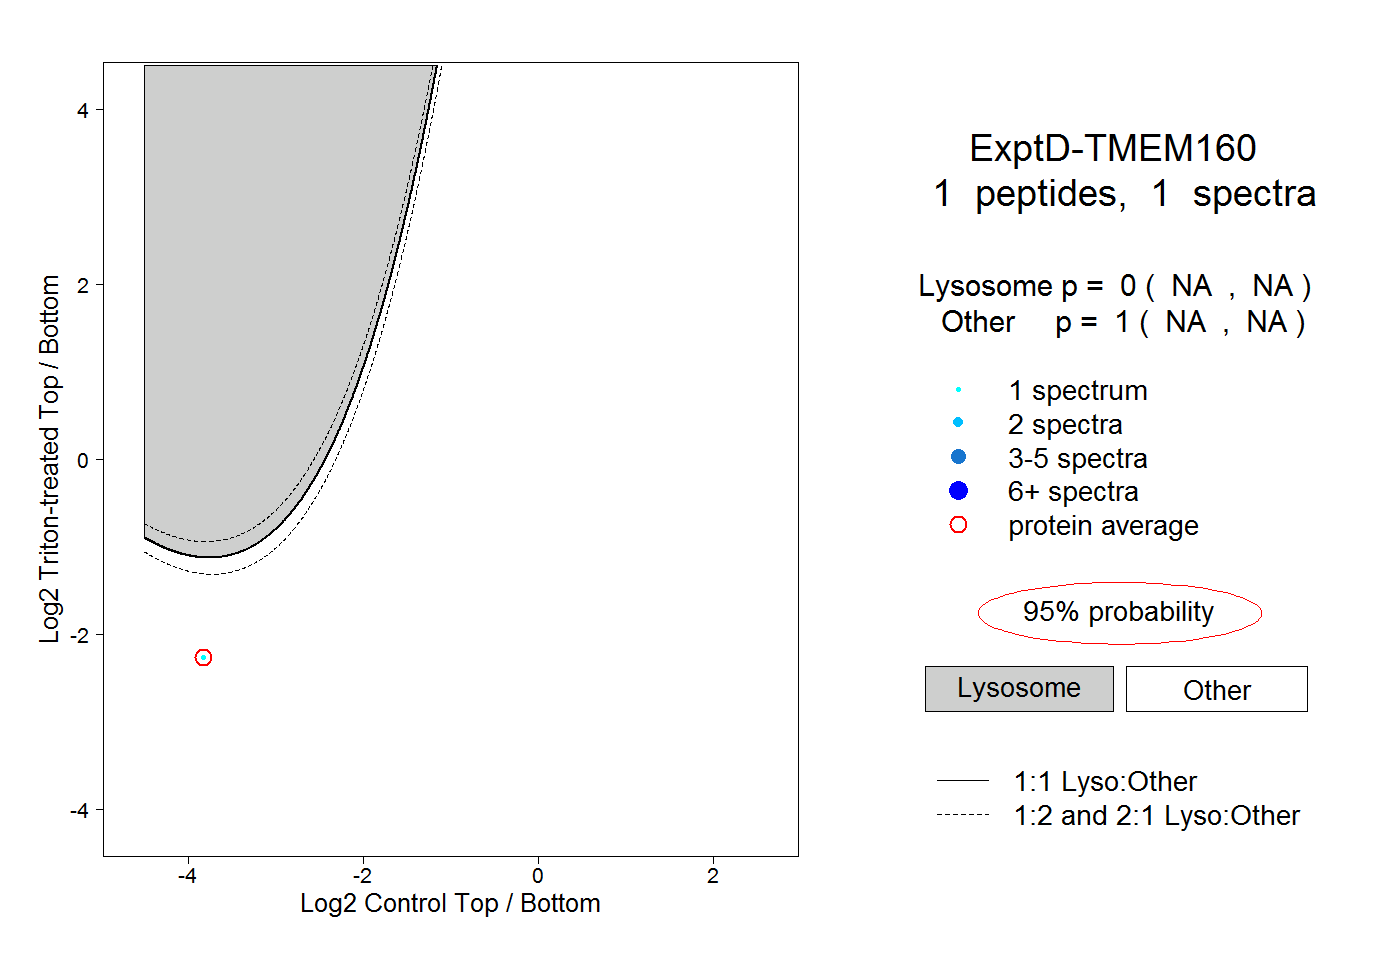 |
0.000 NA | NA |
1.000 NA | NA |