 10
10peptides
spectra
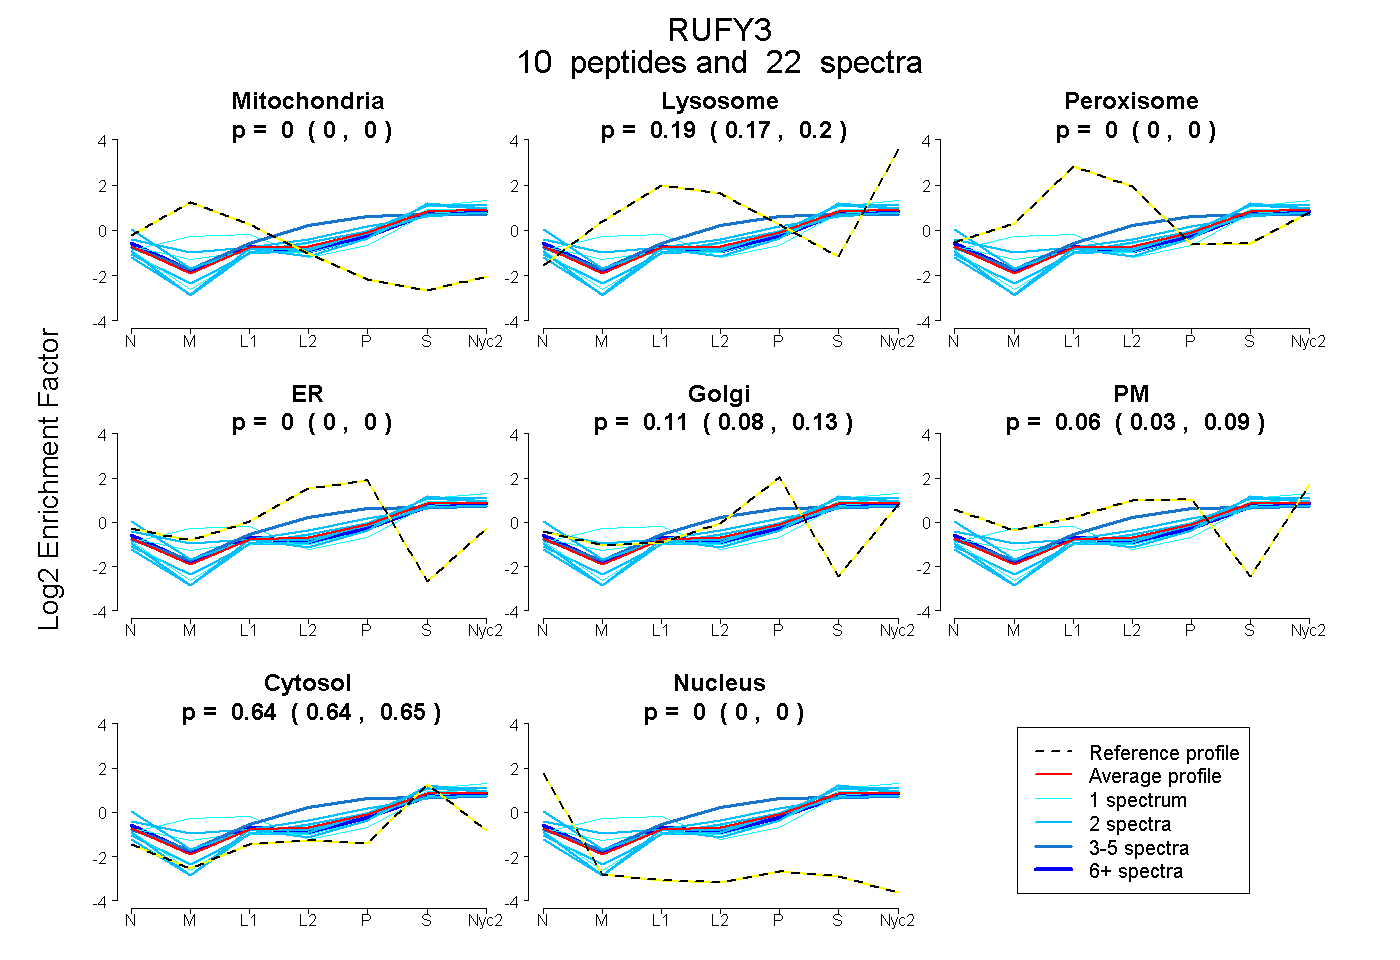
0.000 | 0.000
0.174 | 0.198
0.000 | 0.000
0.000 | 0.000
0.080 | 0.128
0.032 | 0.091
0.635 | 0.650
0.000 | 0.000
7peptides
spectra
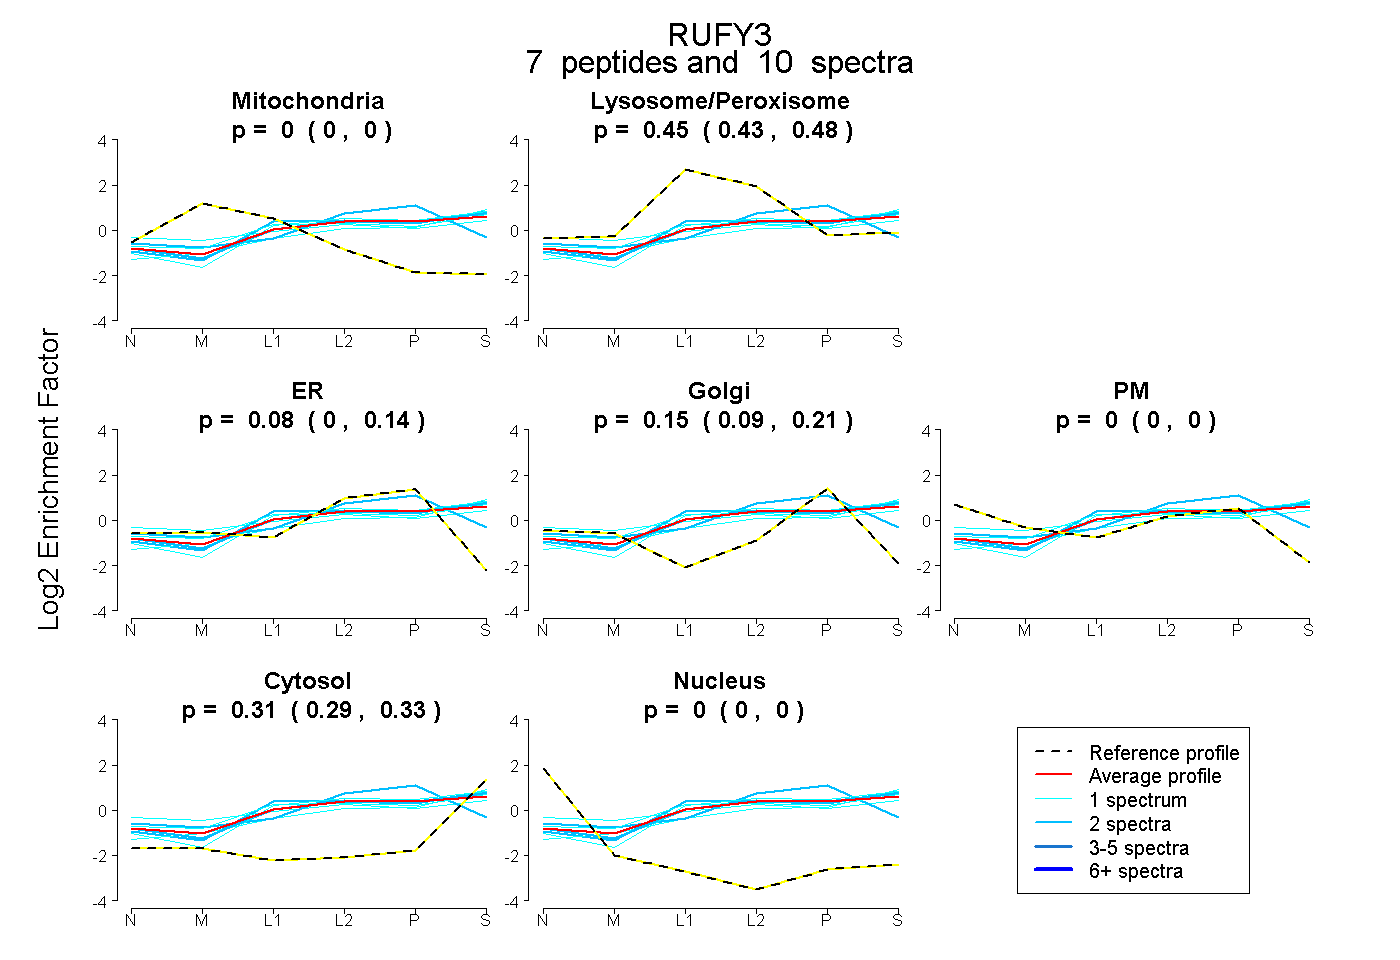
0.000 | 0.000
0.426 | 0.477
0.004 | 0.135
0.092 | 0.208
0.000 | 0.000
0.290 | 0.335
0.000 | 0.000
17peptides
spectra
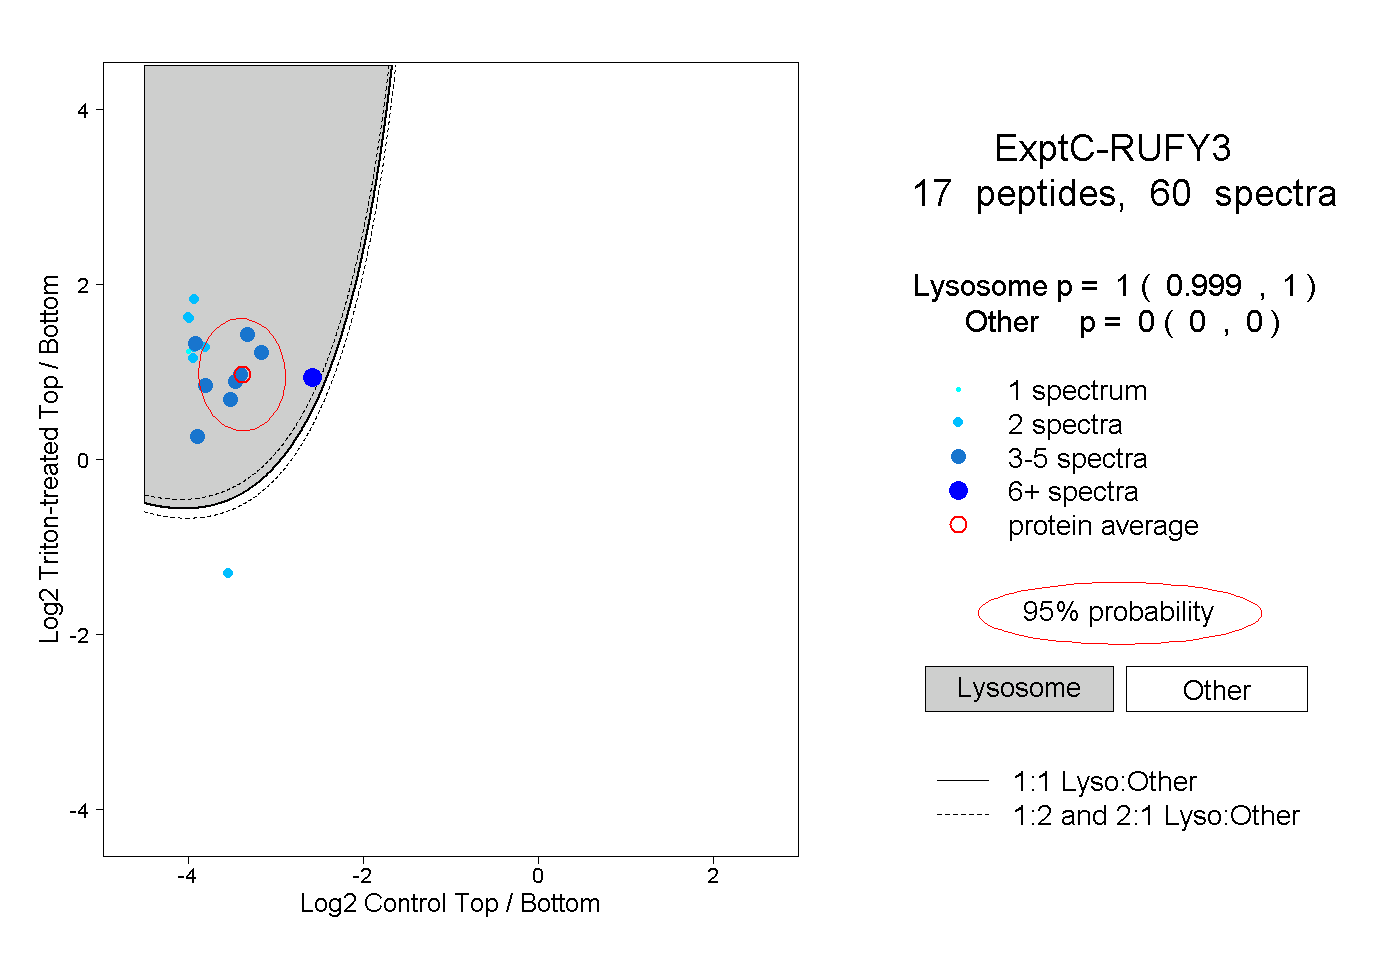
0.999 | 1.000
0.000 | 0.000
3peptides
spectra
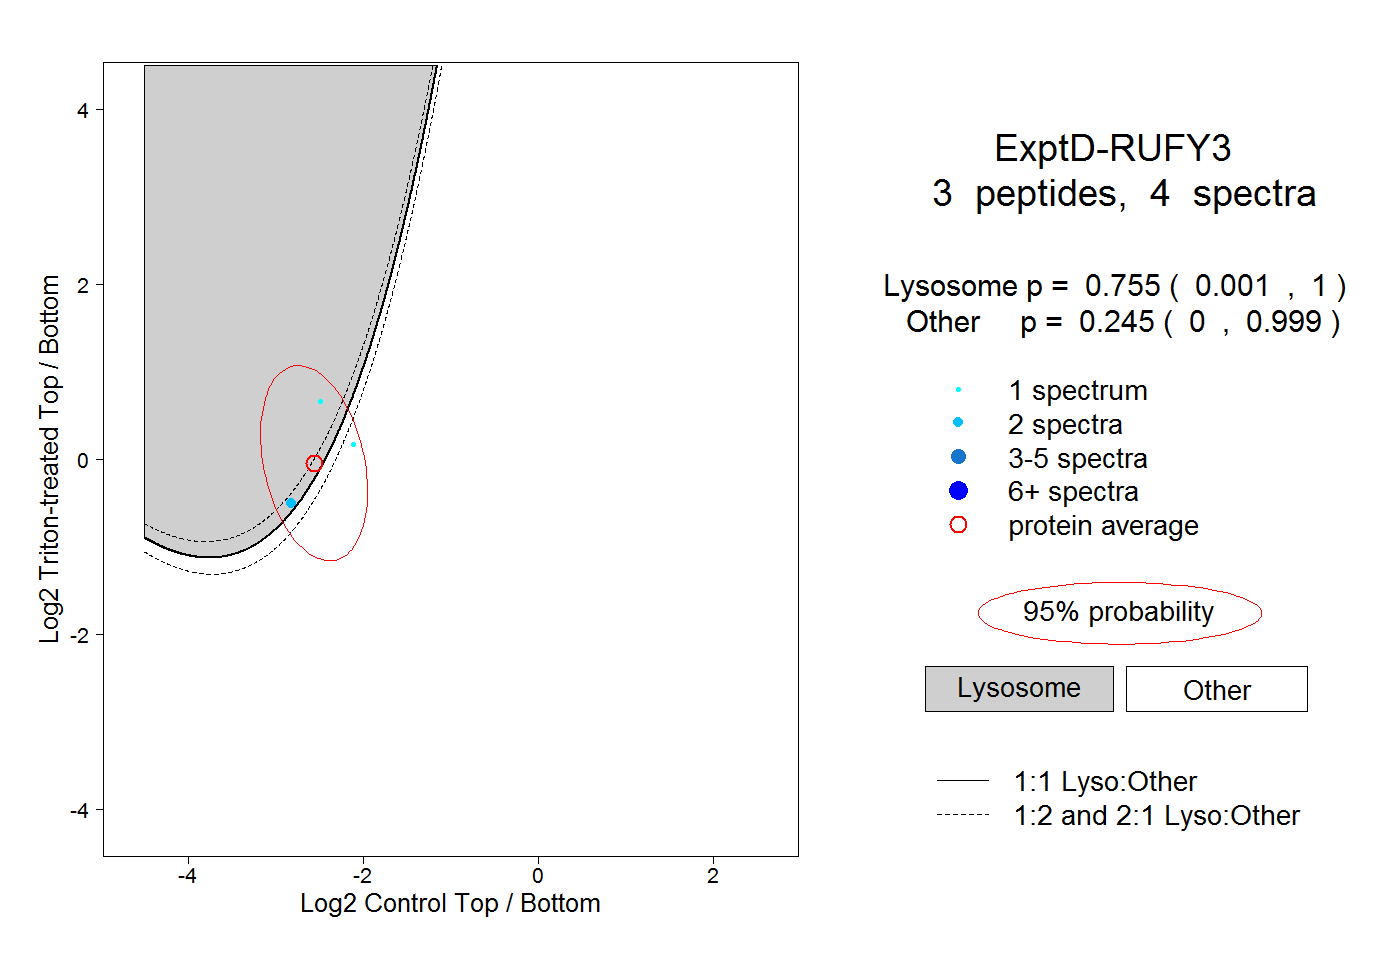
0.001 | 1.000
0.000 | 0.999