RUFY3
[ENSRNOP00000020608]
Main page
| | | Plot |
Mito |
Lyso |
|
Perox |
ER |
Golgi |
PM |
Cytosol |
Nucleus |
|
| Expt A |
 10
10
peptides |
22
spectra |
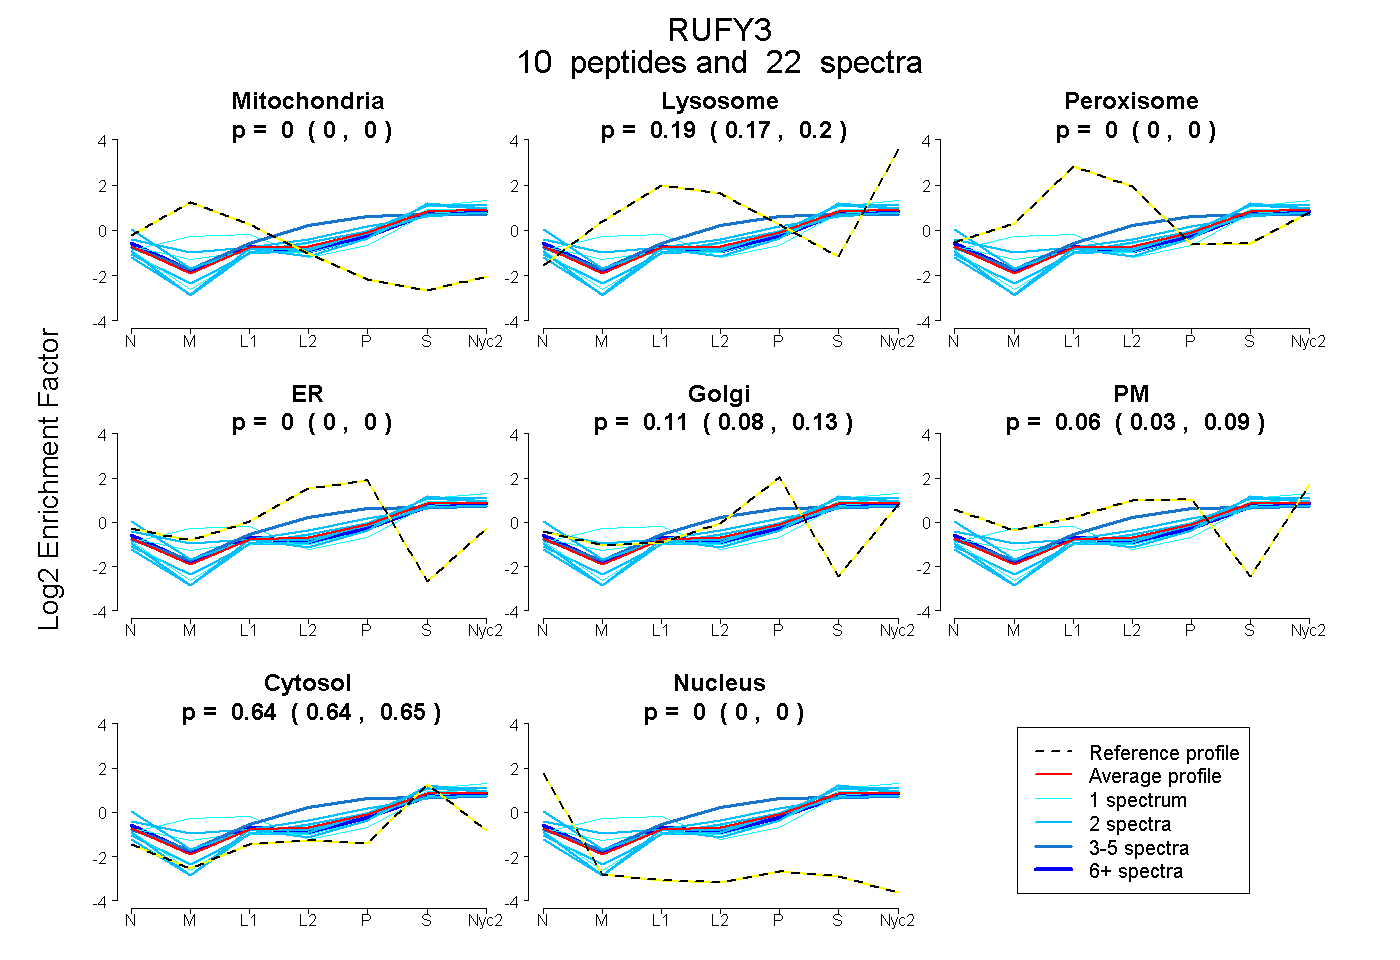 |
0.000
0.000 | 0.000 |
0.187
0.174 | 0.198 |
|
0.000
0.000 | 0.000 |
0.000
0.000 | 0.000 |
0.105
0.080 | 0.128 |
0.064
0.032 | 0.091 |
0.643
0.635 | 0.650 |
0.000
0.000 | 0.000 |
|
| | | Plot |
Mito |
|
Lyso or Perox |
|
ER |
Golgi |
PM |
Cytosol |
Nucleus |
|
| Expt B |
7
peptides |
10
spectra |
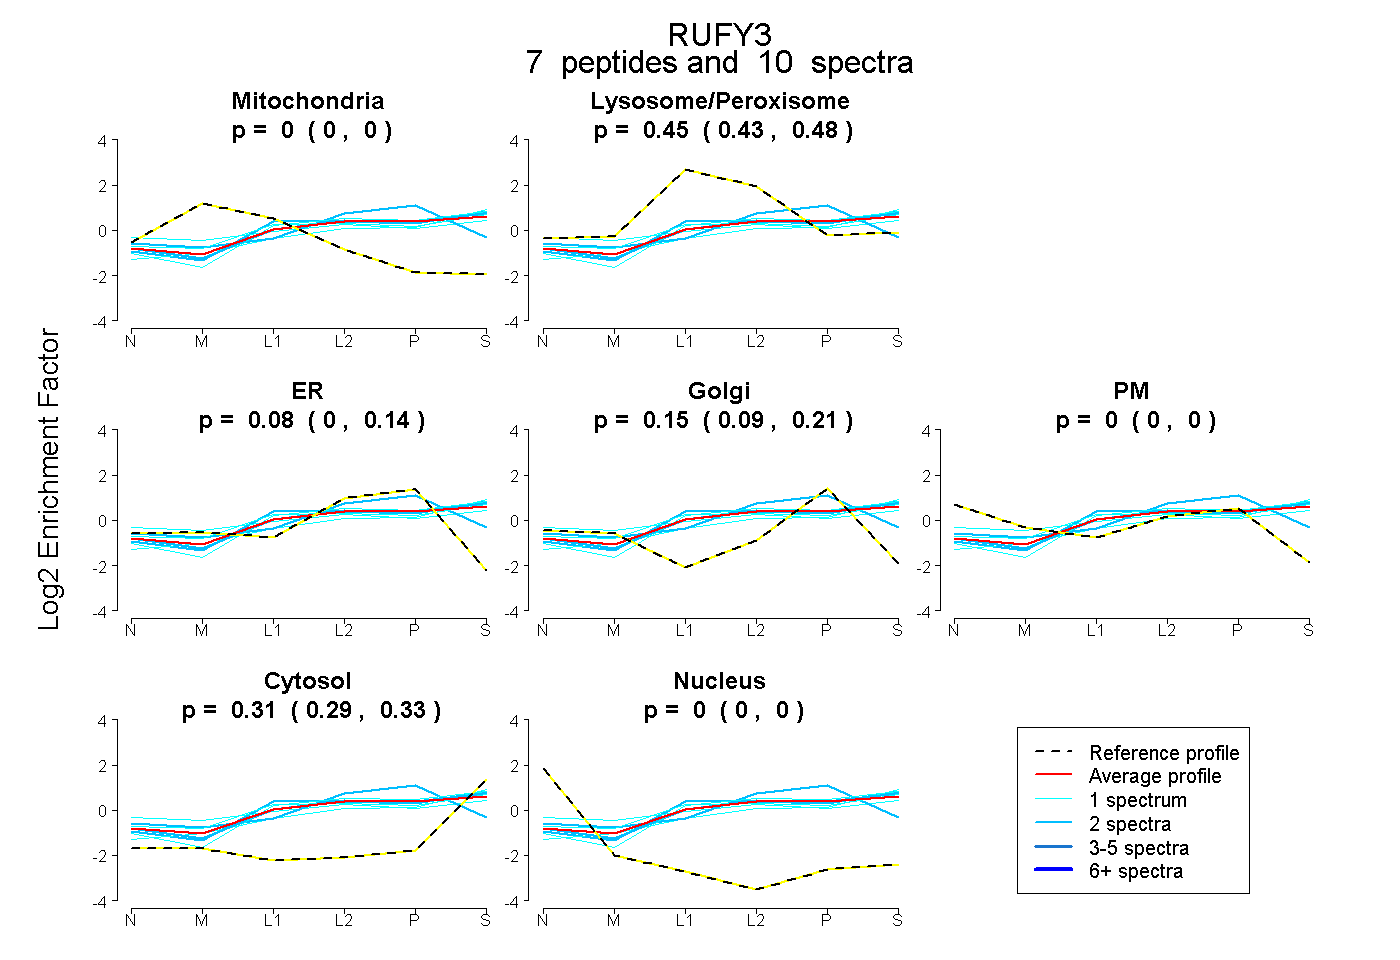 |
0.000
0.000 | 0.000 |
|
0.453
0.426 | 0.477 |
|
0.081
0.004 | 0.135 |
0.151
0.092 | 0.208 |
0.000
0.000 | 0.000 |
0.315
0.290 | 0.335 |
0.000
0.000 | 0.000 |
|
| 1 spectrum, LTEELAVANNR |
0.000 |
|
0.446 |
|
0.000 |
0.173 |
0.099 |
0.281 |
0.000 |
|
| 2 spectra, GLIESALNLGR |
0.000 |
|
0.518 |
|
0.050 |
0.080 |
0.000 |
0.352 |
0.000 |
|
| 8 spectra, TFLGQNK |
0.000 |
|
0.955 |
|
0.045 |
0.000 |
0.000 |
0.000 |
0.000 |
|
| 2 spectra, QDALVSLR |
0.000 |
|
0.309 |
|
0.352 |
0.200 |
0.000 |
0.138 |
0.000 |
|
| 1 spectrum, IITLQEEMER |
0.000 |
|
0.350 |
|
0.178 |
0.000 |
0.000 |
0.471 |
0.000 |
|
| 1 spectrum, TAEGQALSEAR |
0.000 |
|
0.446 |
|
0.178 |
0.000 |
0.000 |
0.376 |
0.000 |
|
| 2 spectra, SFWGPLELVEK |
0.000 |
|
0.447 |
|
0.120 |
0.089 |
0.000 |
0.345 |
0.000 |
|
| | | Plot |
|
Lyso |
|
|
|
|
|
|
|
Other |
| Expt C |
17
peptides |
60
spectra |
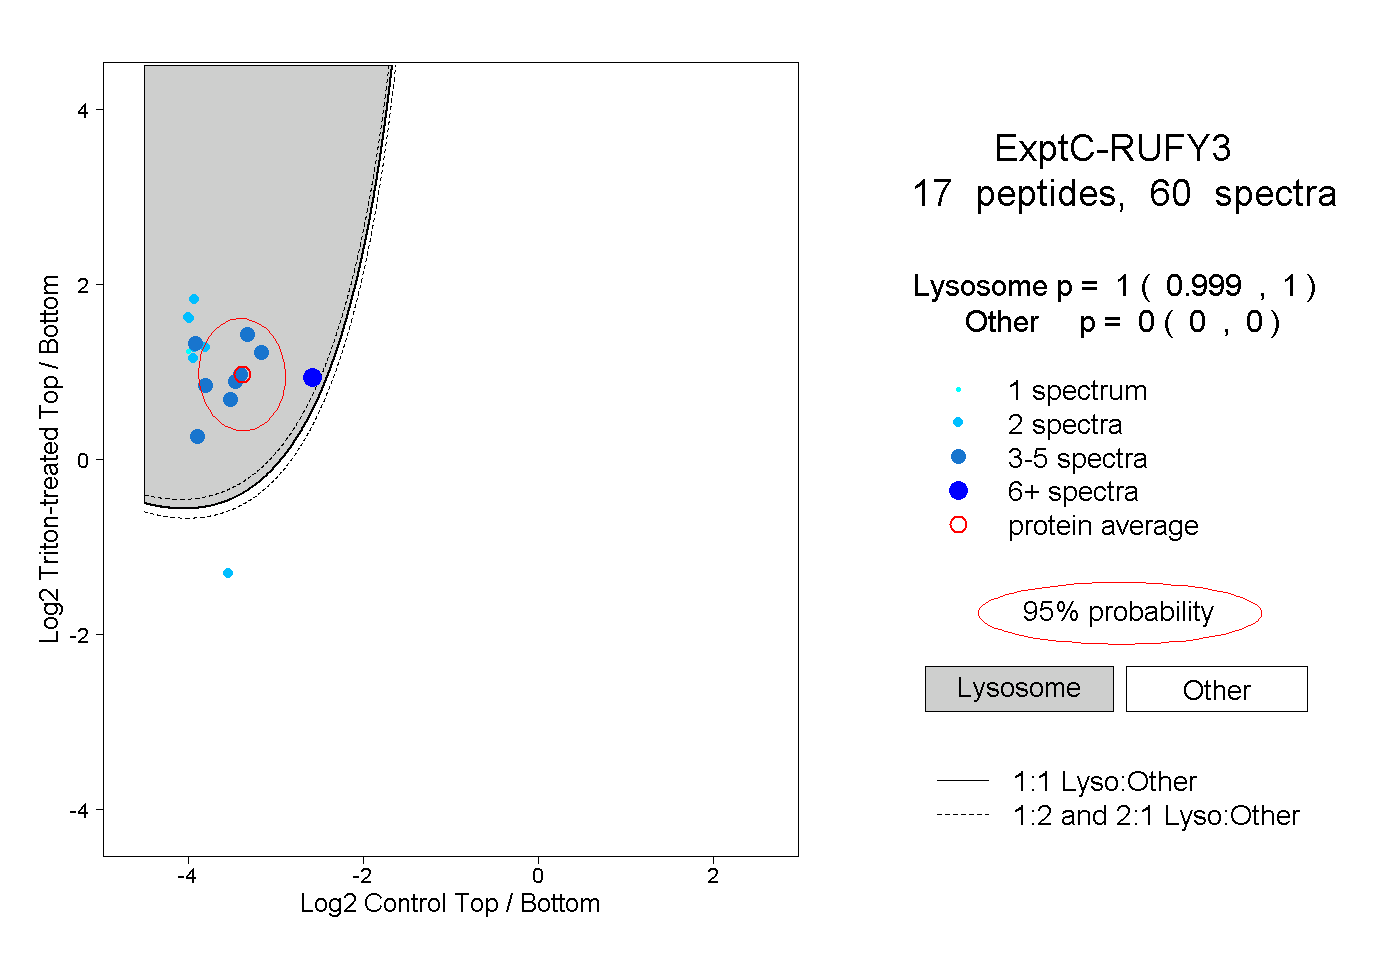 |
|
1.000
0.999 | 1.000 |
|
|
|
|
|
|
|
0.000
0.000 | 0.000 |
| | | Plot |
|
Lyso |
|
|
|
|
|
|
|
Other |
| Expt D |
3
peptides |
4
spectra |
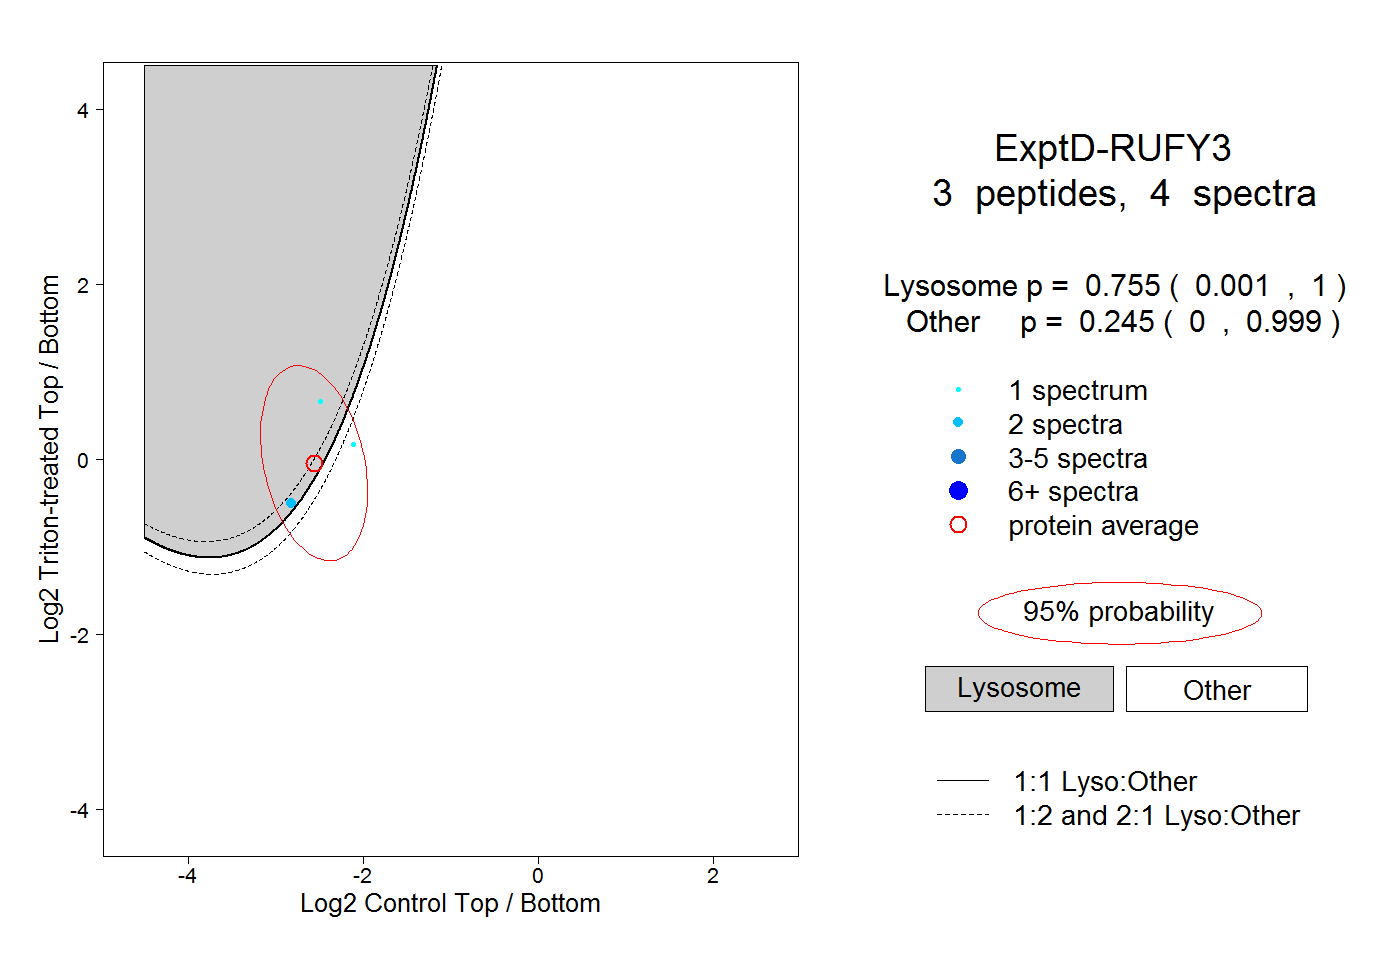 |
|
0.755
0.001 | 1.000 |
|
|
|
|
|
|
|
0.245
0.000 | 0.999 |