 8
8peptides
spectra
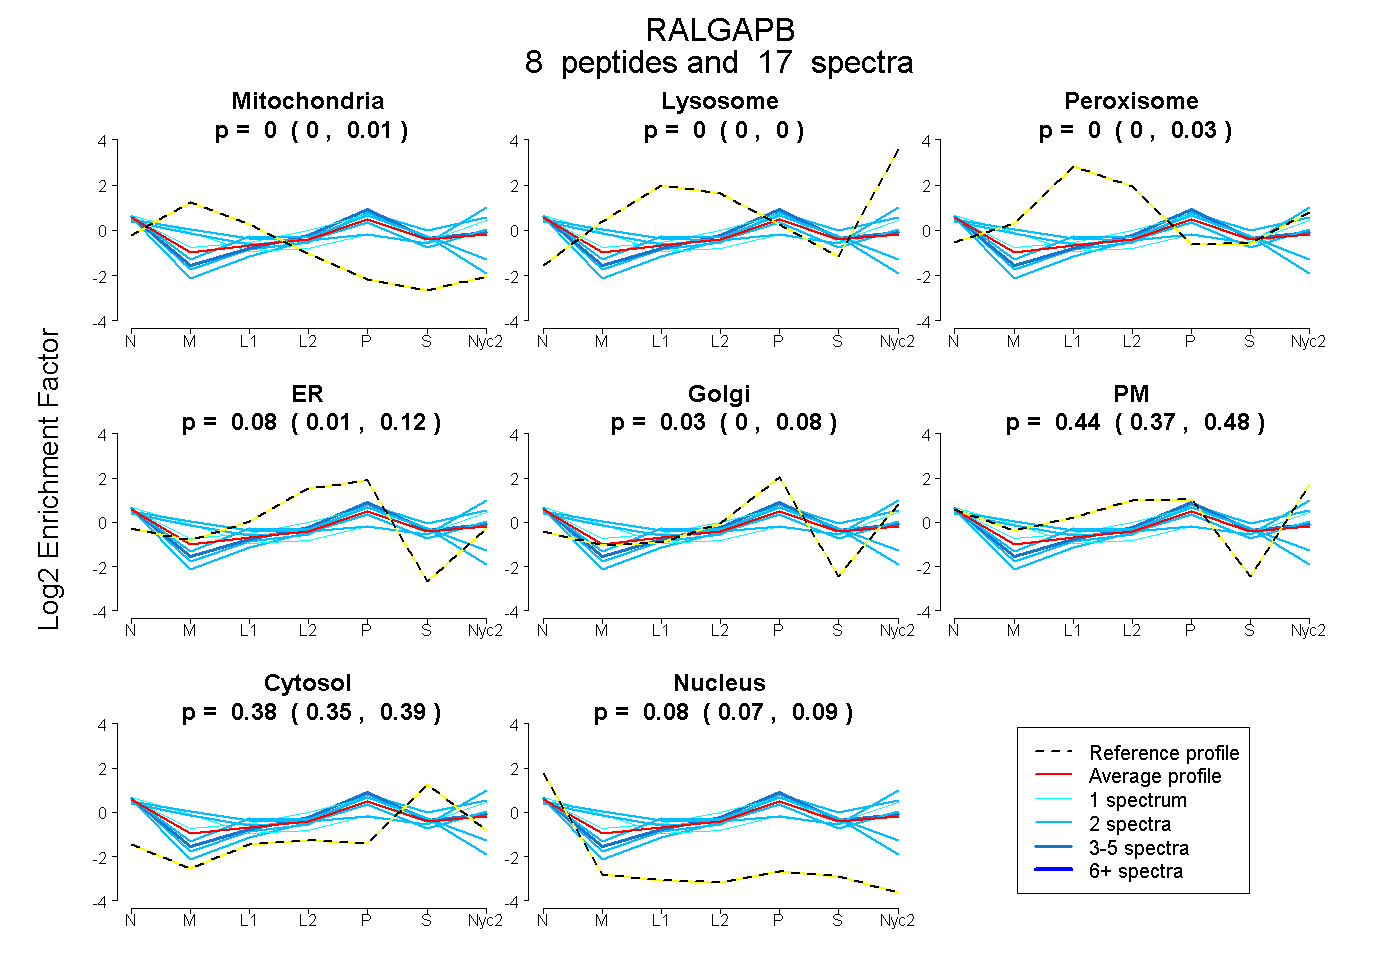
0.000 | 0.008
0.000 | 0.000
0.000 | 0.031
0.014 | 0.119
0.000 | 0.078
0.368 | 0.477
0.351 | 0.386
0.066 | 0.091
2peptides
spectra
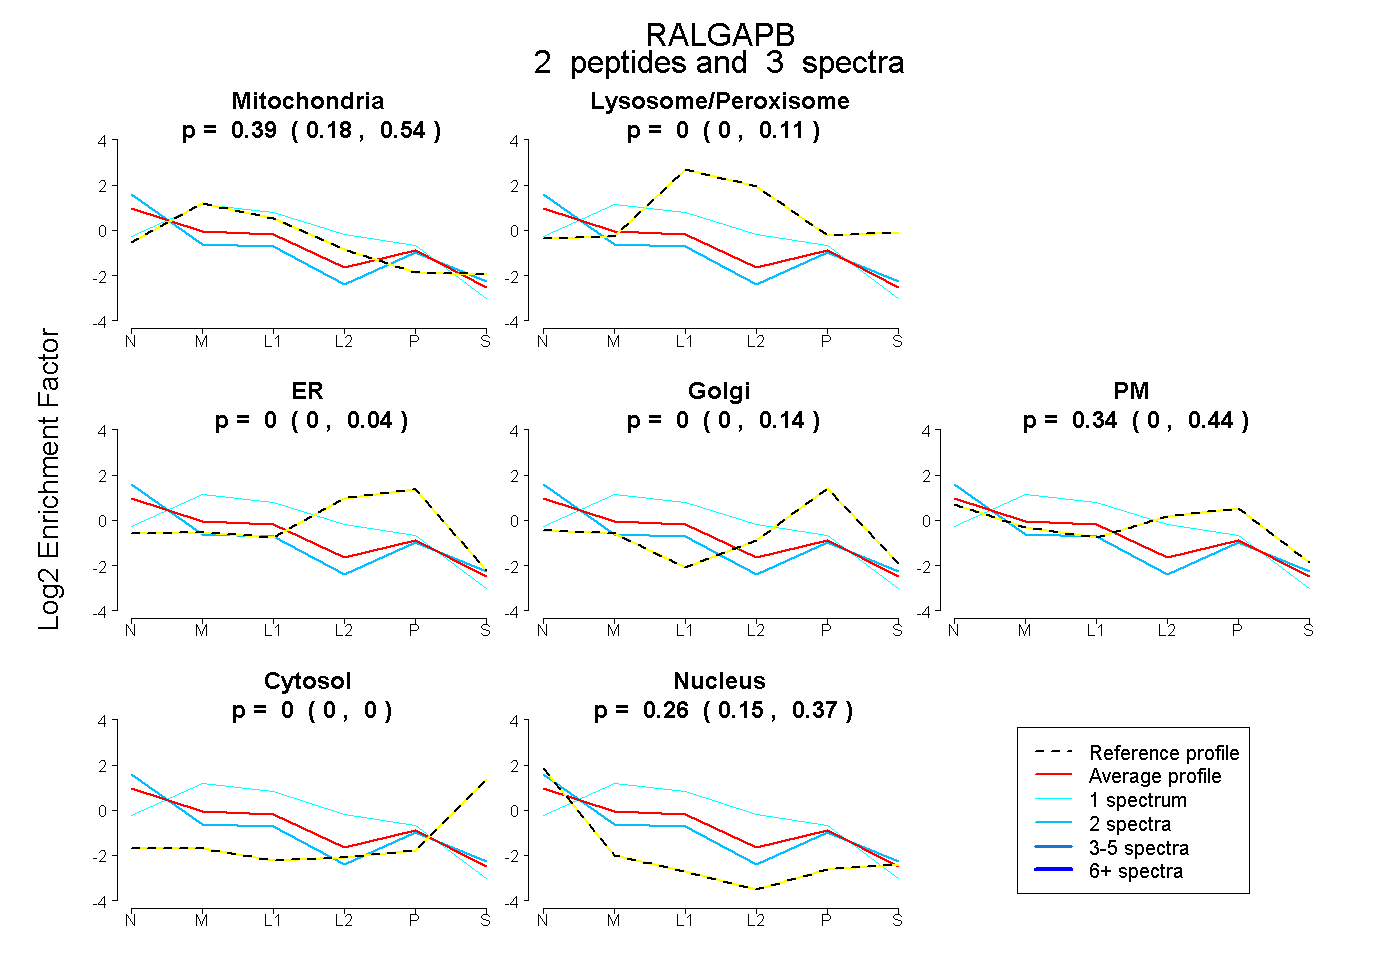
0.184 | 0.540
0.000 | 0.106
0.000 | 0.035
0.000 | 0.140
0.000 | 0.438
0.000 | 0.000
0.145 | 0.375
2peptides
spectra
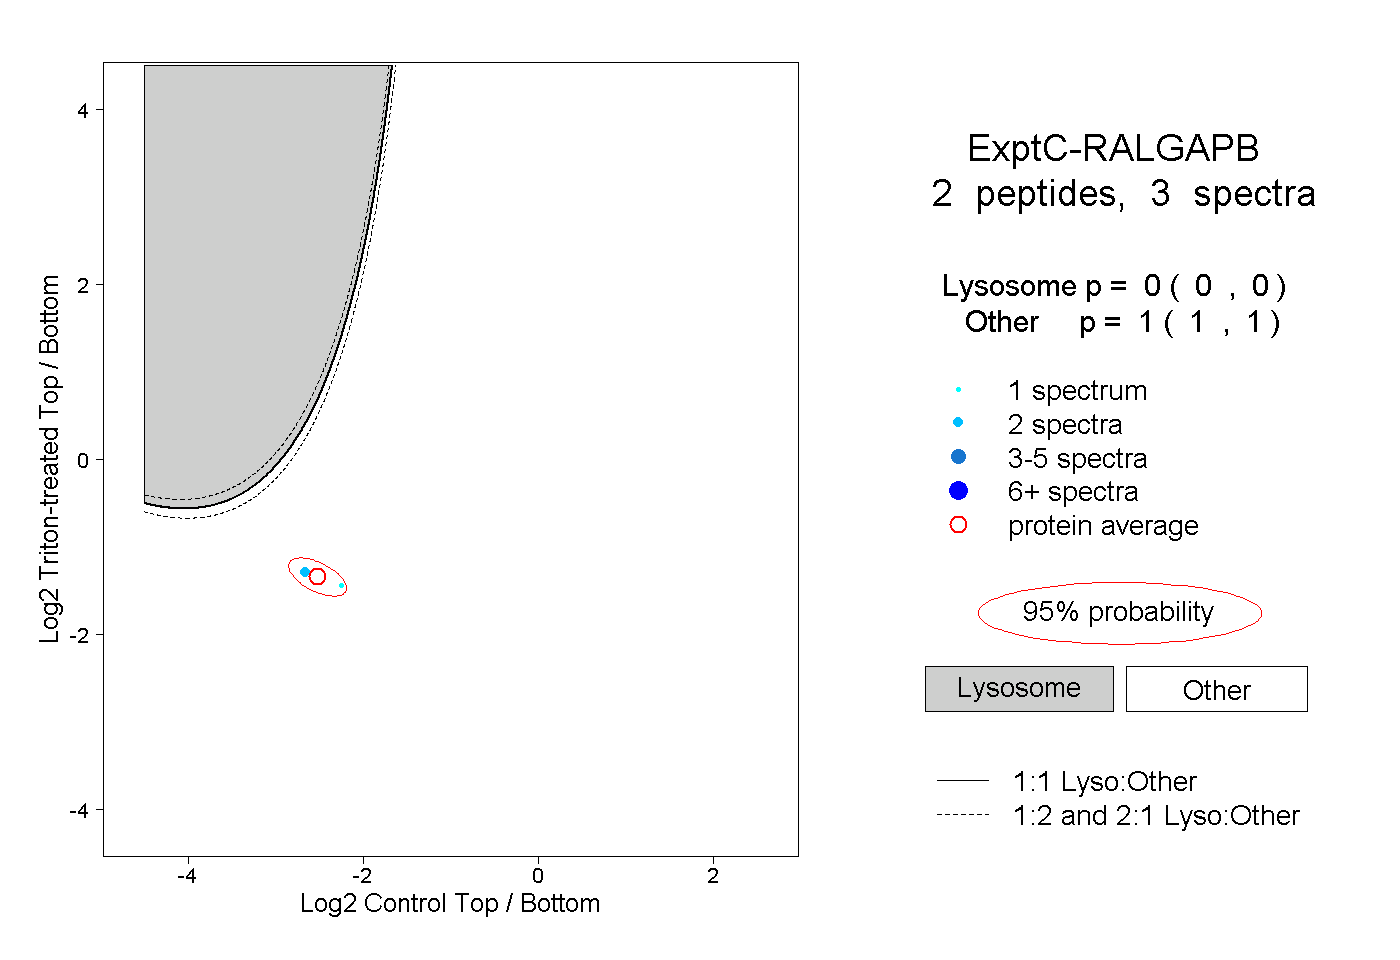
0.000 | 0.000
1.000 | 1.000
2peptides
spectra
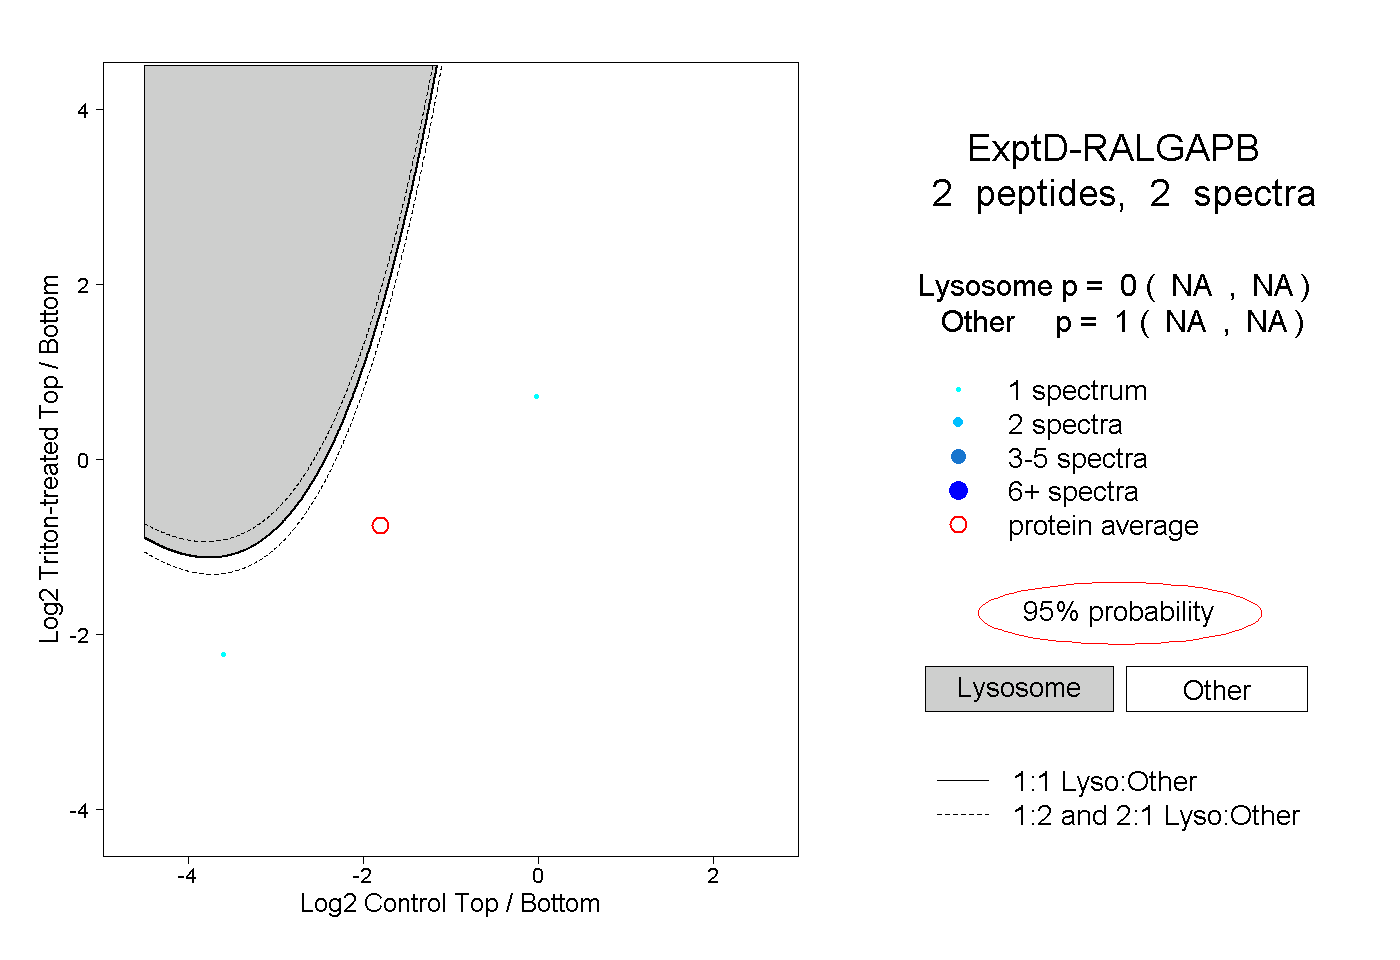
NA | NA
NA | NA