 8
8peptides
spectra
0.000 | 0.008
0.000 | 0.000
0.000 | 0.031
0.014 | 0.119
0.000 | 0.078
0.368 | 0.477
0.351 | 0.386
0.066 | 0.091
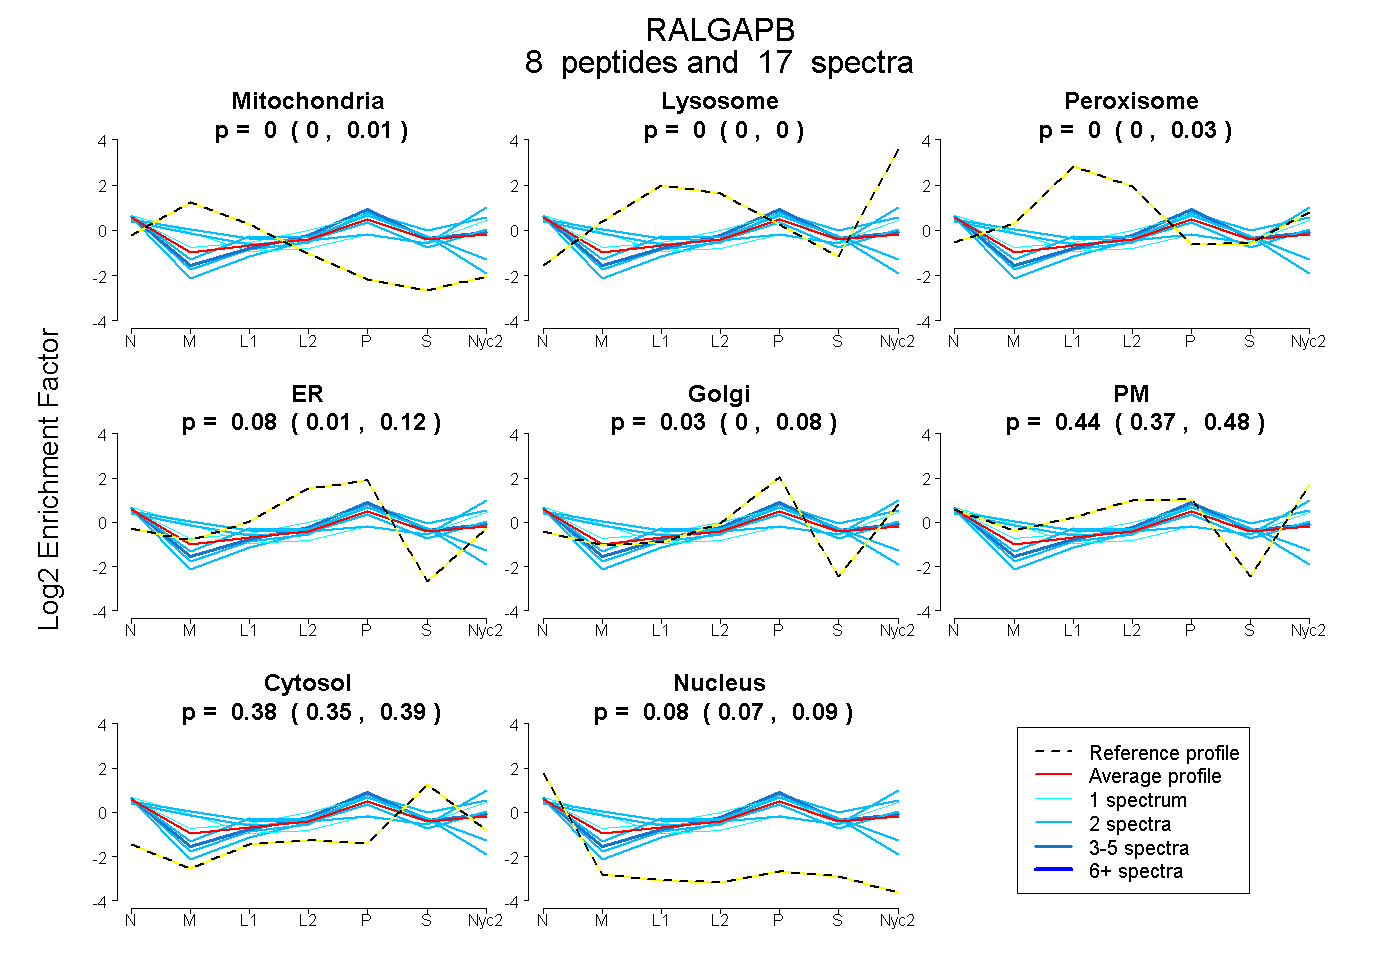
| Plot | Mito | Lyso | Perox | ER | Golgi | PM | Cytosol | Nucleus | |||||
| Expt A |
8 peptides |
17 spectra |
|
0.000 0.000 | 0.008 |
0.000 0.000 | 0.000 |
0.000 0.000 | 0.031 |
0.075 0.014 | 0.119 |
0.029 0.000 | 0.078 |
0.441 0.368 | 0.477 |
0.377 0.351 | 0.386 |
0.078 0.066 | 0.091 |
| 1 spectrum, EPNLYIQSILK | 0.167 | 0.000 | 0.000 | 0.000 | 0.000 | 0.445 | 0.323 | 0.065 | ||
| 2 spectra, QTVINICR | 0.180 | 0.000 | 0.000 | 0.000 | 0.128 | 0.405 | 0.288 | 0.000 | ||
| 5 spectra, HLPQIFFR | 0.000 | 0.000 | 0.000 | 0.104 | 0.186 | 0.291 | 0.369 | 0.050 | ||
| 1 spectrum, HLQNLFVPR | 0.000 | 0.000 | 0.000 | 0.000 | 0.027 | 0.609 | 0.355 | 0.008 | ||
| 2 spectra, AEACGTLCR | 0.000 | 0.000 | 0.000 | 0.443 | 0.000 | 0.000 | 0.370 | 0.187 | ||
| 2 spectra, LCLQVLR | 0.000 | 0.000 | 0.122 | 0.408 | 0.000 | 0.000 | 0.325 | 0.145 | ||
| 2 spectra, TNQEILK | 0.139 | 0.070 | 0.000 | 0.000 | 0.000 | 0.498 | 0.293 | 0.000 | ||
| 2 spectra, ALGFLVR | 0.000 | 0.000 | 0.000 | 0.000 | 0.268 | 0.267 | 0.460 | 0.005 |
| Plot | Mito | Lyso or Perox | ER | Golgi | PM | Cytosol | Nucleus | ||||||
| Expt B |
2 peptides |
3 spectra |
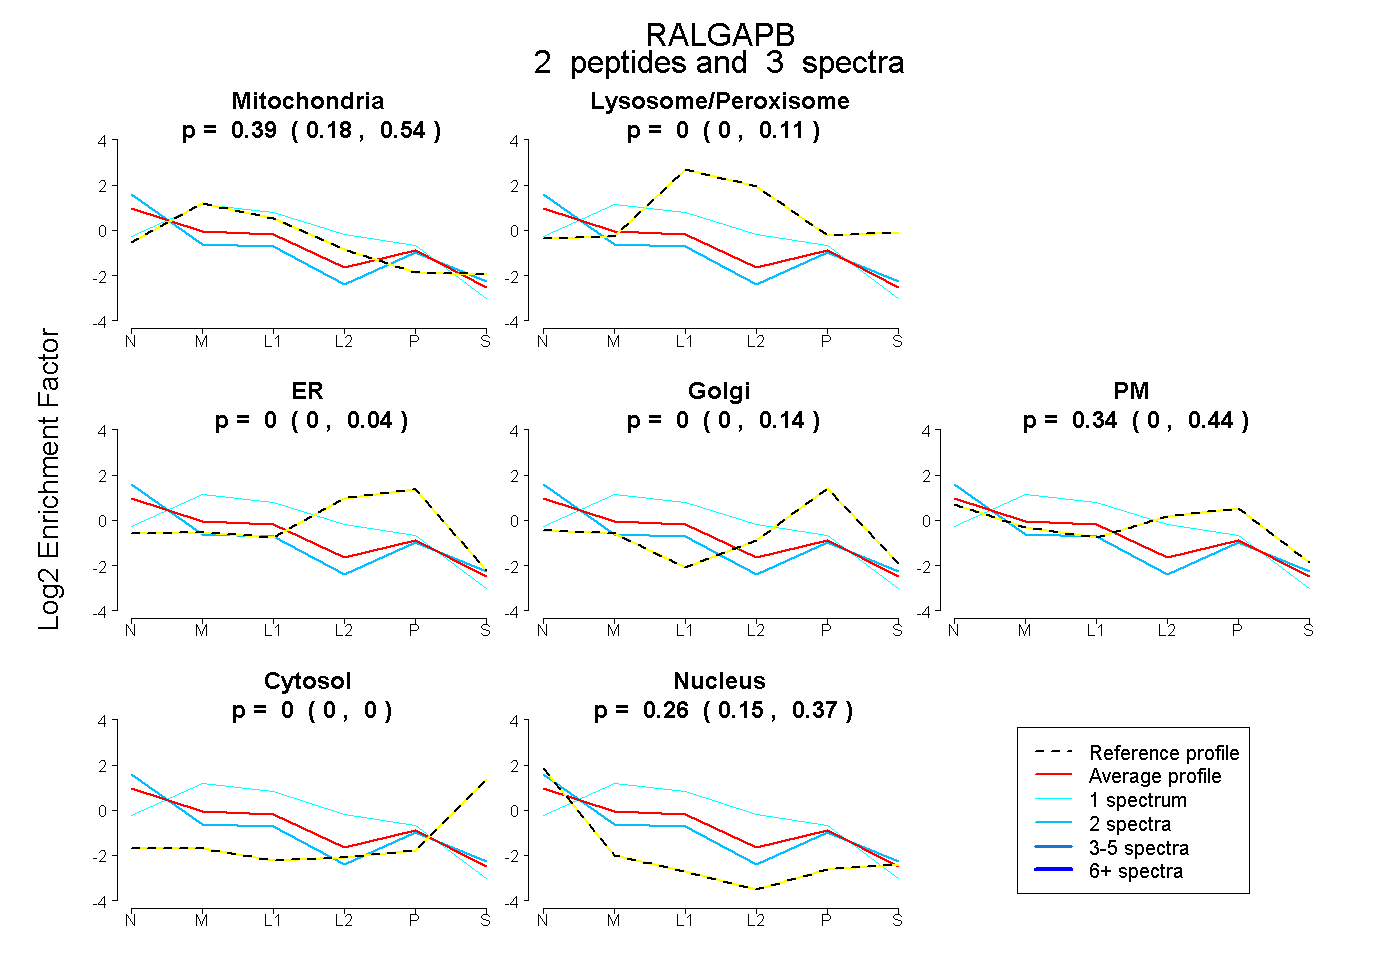 |
0.391 0.184 | 0.540 |
0.000 0.000 | 0.106 |
0.000 0.000 | 0.035 |
0.000 0.000 | 0.140 |
0.345 0.000 | 0.438 |
0.000 0.000 | 0.000 |
0.264 0.145 | 0.375 |
|||
| Plot | Lyso | Other | |||||||||||
| Expt C |
2 peptides |
3 spectra |
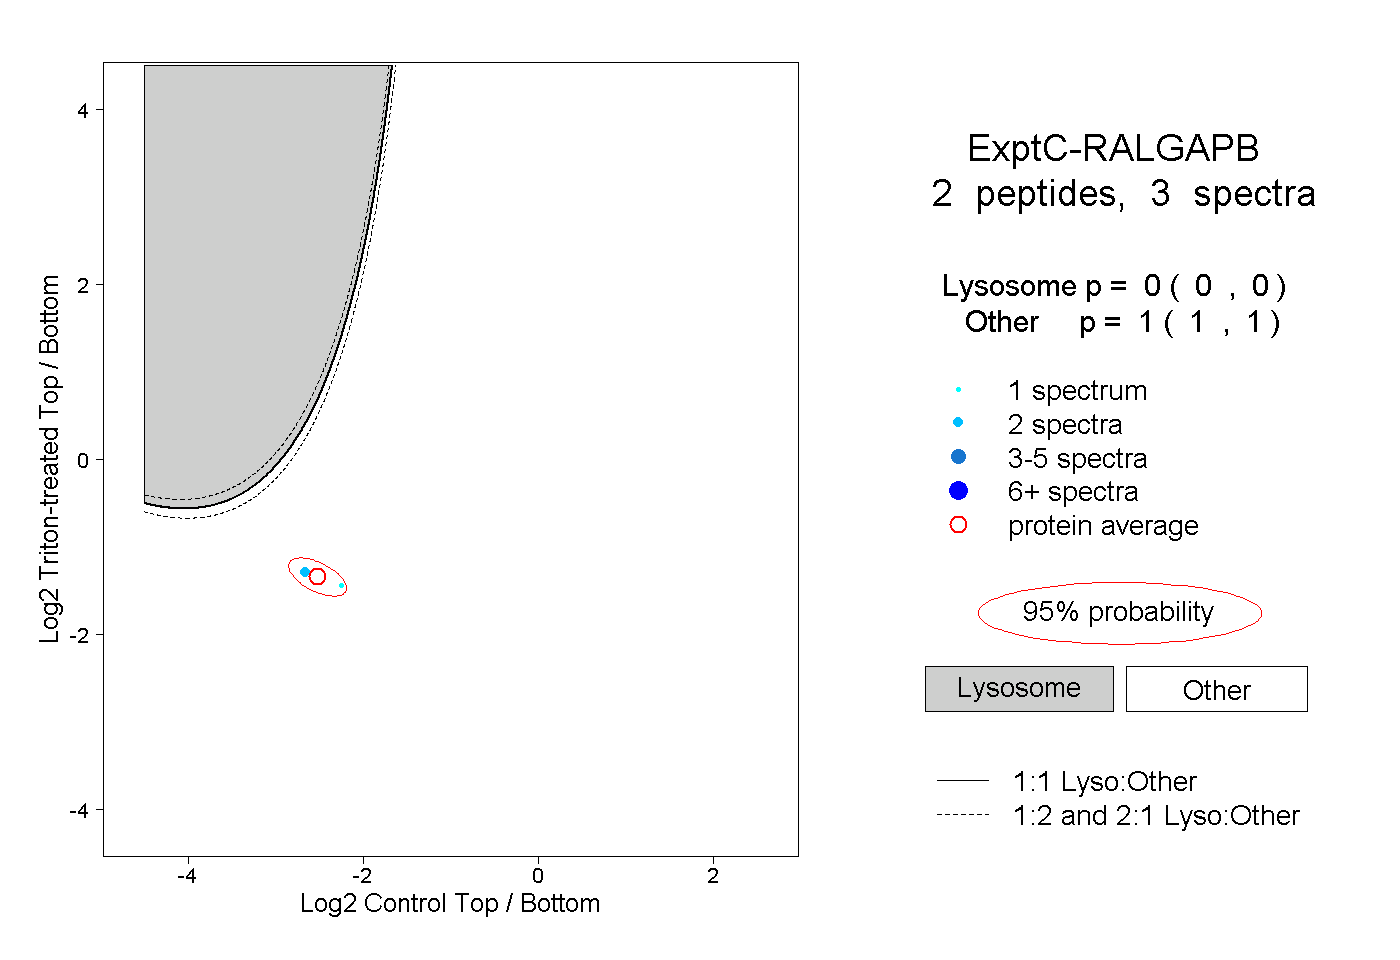 |
0.000 0.000 | 0.000 |
1.000 1.000 | 1.000 |
||||||||
| Plot | Lyso | Other | |||||||||||
| Expt D |
2 peptides |
2 spectra |
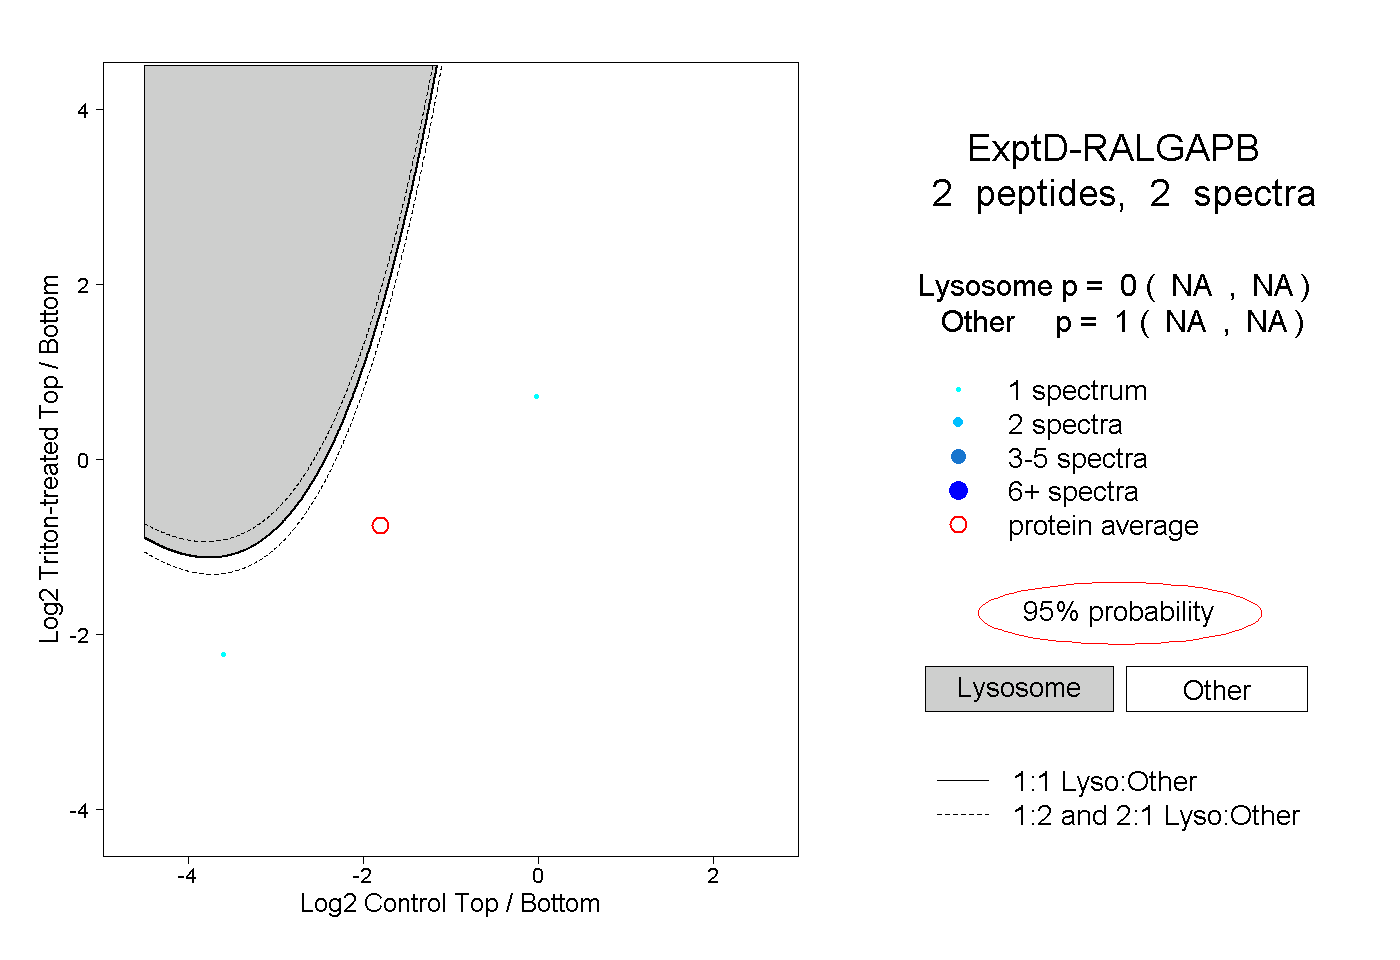 |
0.000 NA | NA |
1.000 NA | NA |