 6
6peptides
spectra
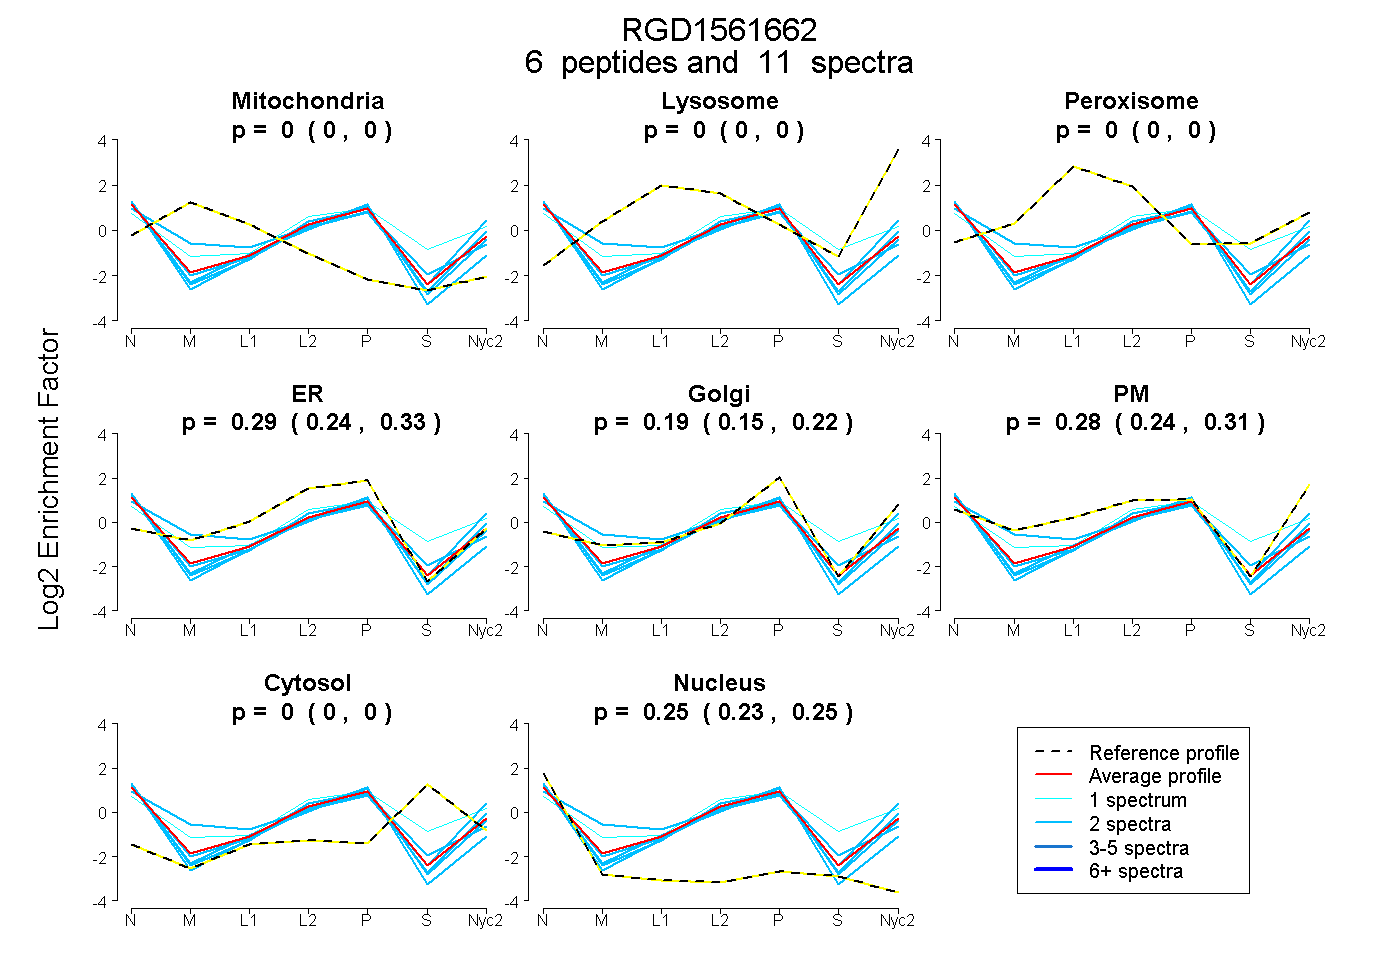
0.000 | 0.000
0.000 | 0.000
0.000 | 0.000
0.239 | 0.333
0.147 | 0.216
0.236 | 0.315
0.000 | 0.005
0.235 | 0.254
1peptide
spectra
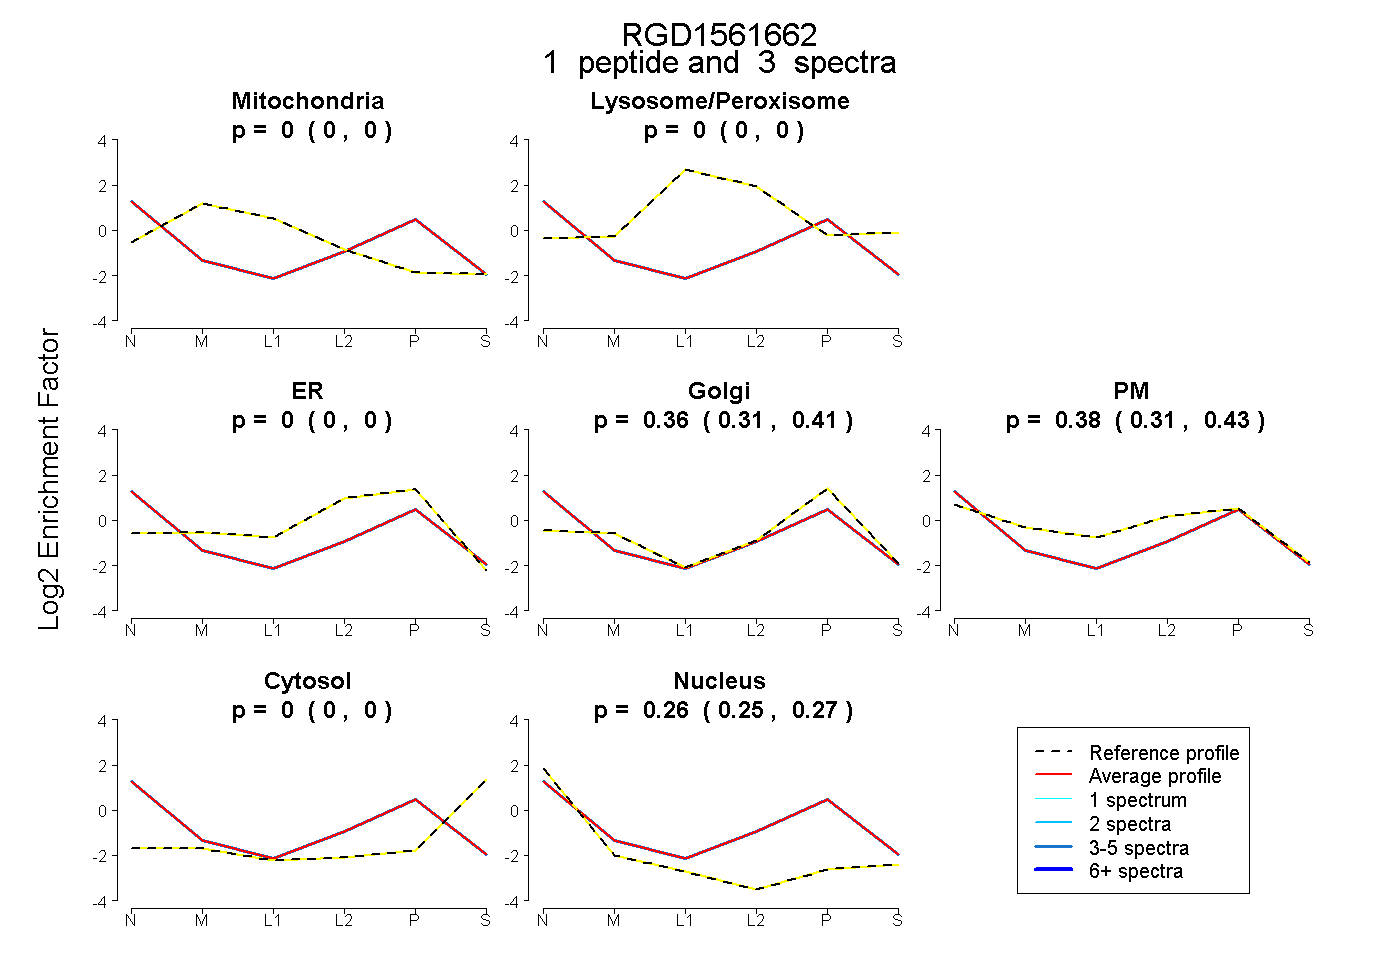
0.000 | 0.000
0.000 | 0.000
0.000 | 0.000
0.309 | 0.410
0.308 | 0.430
0.000 | 0.000
0.246 | 0.275
1peptide
spectrum
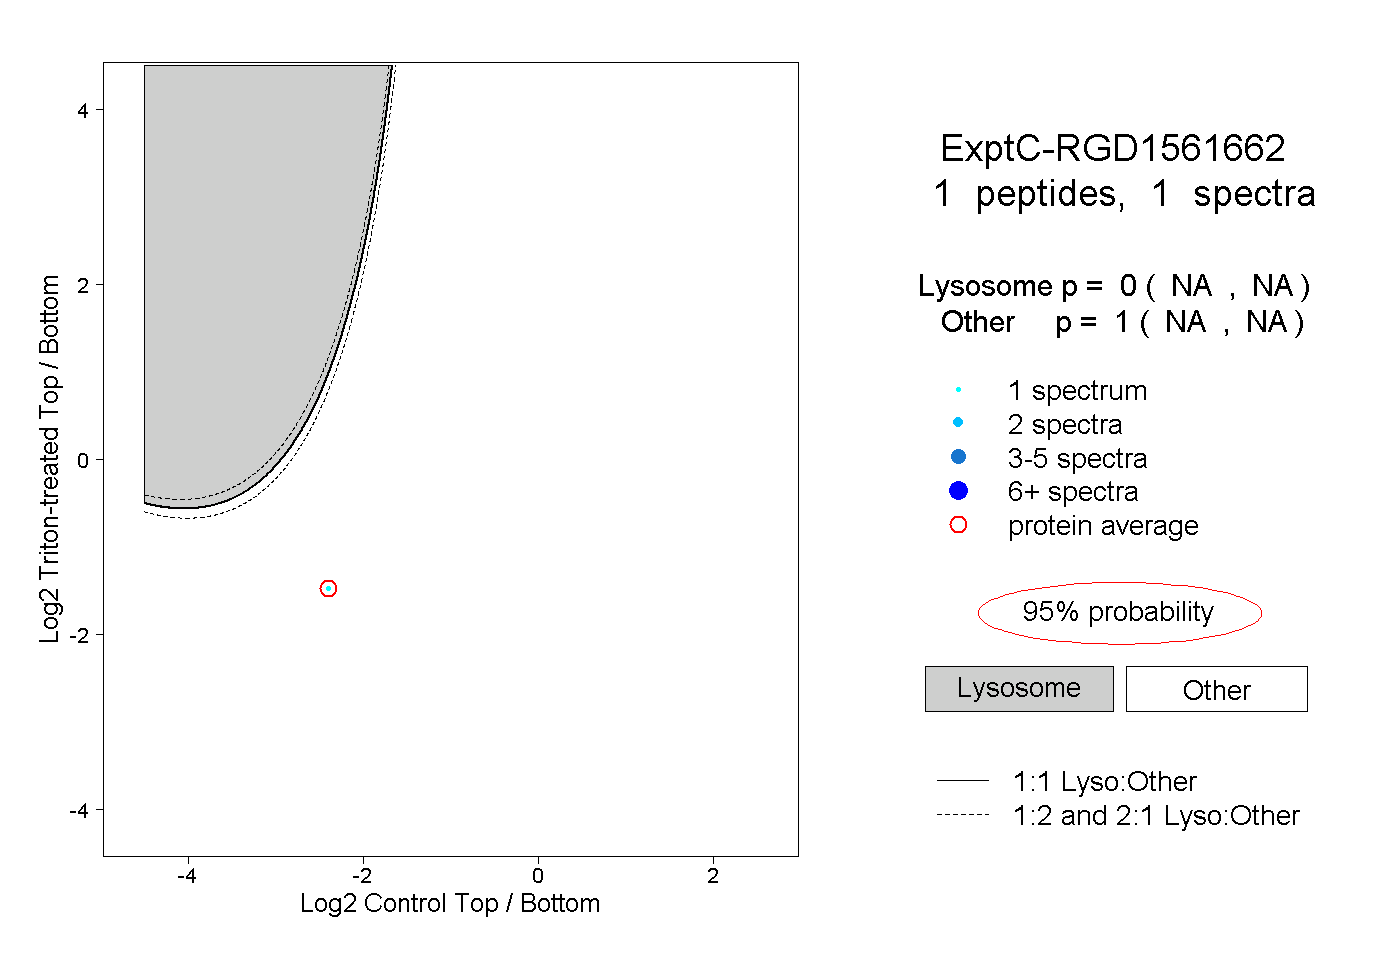
NA | NA
NA | NA