 6
6peptides
spectra
0.000 | 0.000
0.000 | 0.000
0.000 | 0.000
0.239 | 0.333
0.147 | 0.216
0.236 | 0.315
0.000 | 0.005
0.235 | 0.254
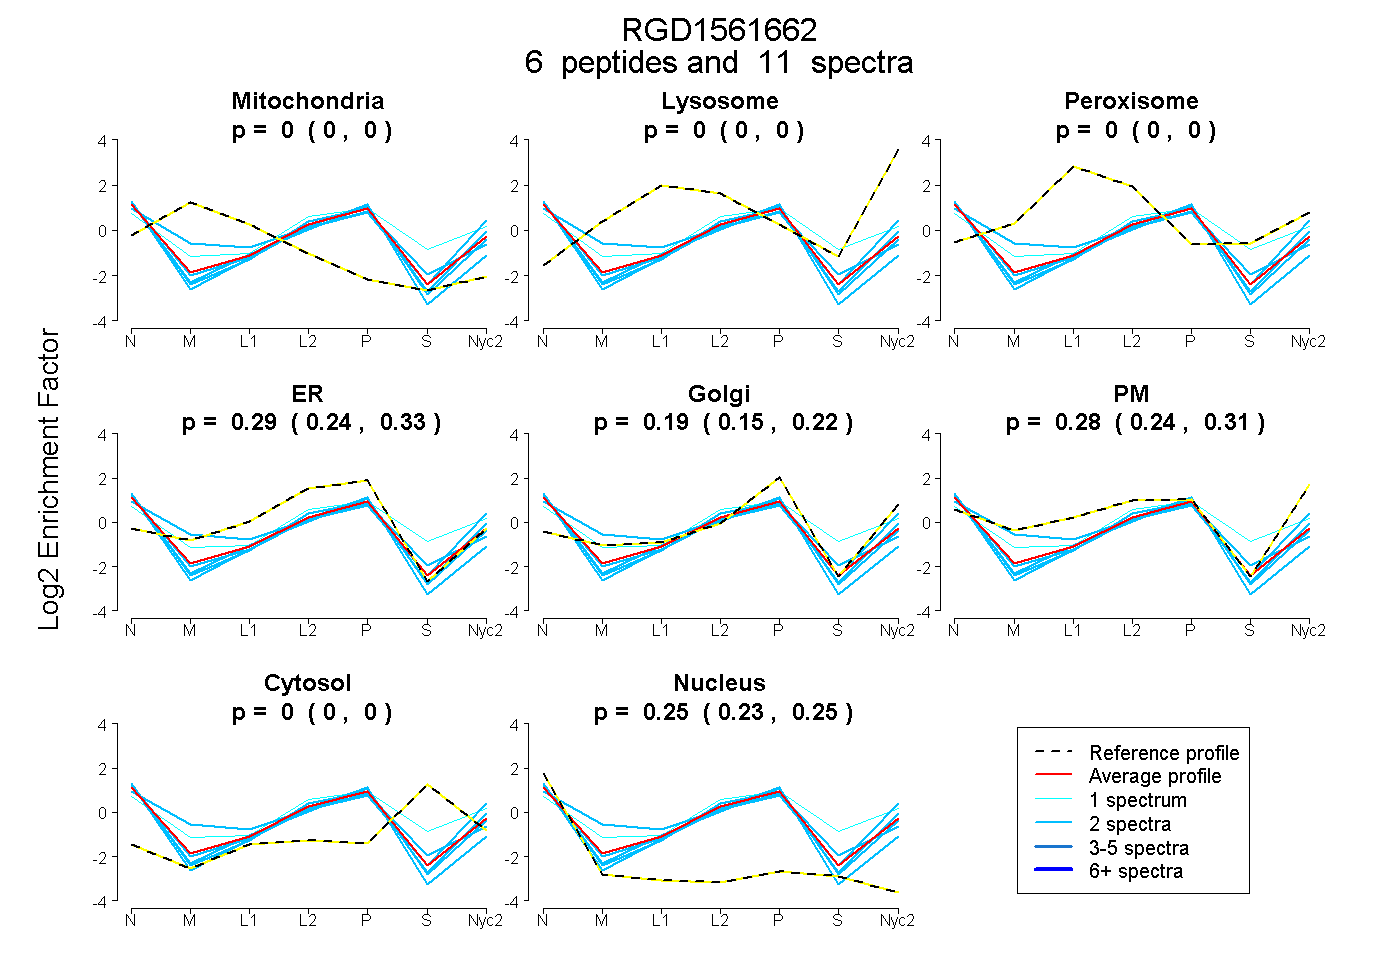
| Plot | Mito | Lyso | Perox | ER | Golgi | PM | Cytosol | Nucleus | |||||
| Expt A |
6 peptides |
11 spectra |
|
0.000 0.000 | 0.000 |
0.000 0.000 | 0.000 |
0.000 0.000 | 0.000 |
0.291 0.239 | 0.333 |
0.185 0.147 | 0.216 |
0.278 0.236 | 0.315 |
0.000 0.000 | 0.005 |
0.246 0.235 | 0.254 |
| 2 spectra, GSPMALLLAAR | 0.000 | 0.000 | 0.000 | 0.587 | 0.092 | 0.000 | 0.000 | 0.321 | ||
| 2 spectra, TRPGGTAIGR | 0.000 | 0.000 | 0.000 | 0.254 | 0.205 | 0.288 | 0.000 | 0.254 | ||
| 1 spectrum, FHKPATK | 0.000 | 0.000 | 0.000 | 0.231 | 0.044 | 0.413 | 0.264 | 0.048 | ||
| 2 spectra, GSRPNSFIVVPK | 0.000 | 0.000 | 0.000 | 0.042 | 0.130 | 0.647 | 0.000 | 0.181 | ||
| 2 spectra, VPPPTPVR | 0.000 | 0.000 | 0.000 | 0.352 | 0.124 | 0.207 | 0.050 | 0.267 | ||
| 2 spectra, GIAVVTPTR | 0.000 | 0.000 | 0.000 | 0.310 | 0.233 | 0.190 | 0.000 | 0.267 |
| Plot | Mito | Lyso or Perox | ER | Golgi | PM | Cytosol | Nucleus | ||||||
| Expt B |
1 peptide |
3 spectra |
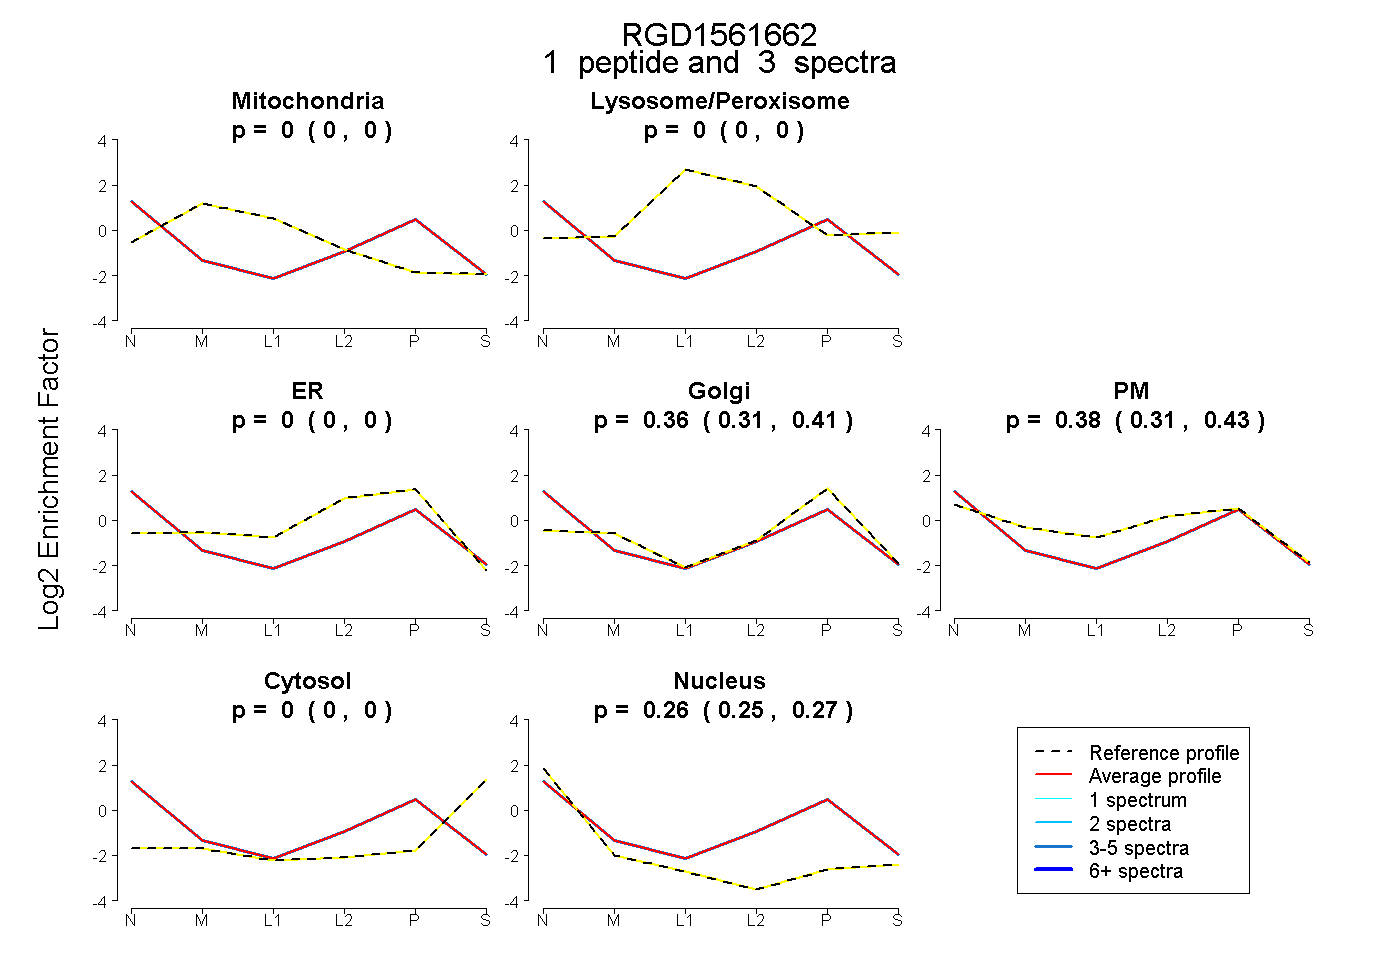 |
0.000 0.000 | 0.000 |
0.000 0.000 | 0.000 |
0.000 0.000 | 0.000 |
0.363 0.309 | 0.410 |
0.376 0.308 | 0.430 |
0.000 0.000 | 0.000 |
0.262 0.246 | 0.275 |
|||
| Plot | Lyso | Other | |||||||||||
| Expt C |
1 peptide |
1 spectrum |
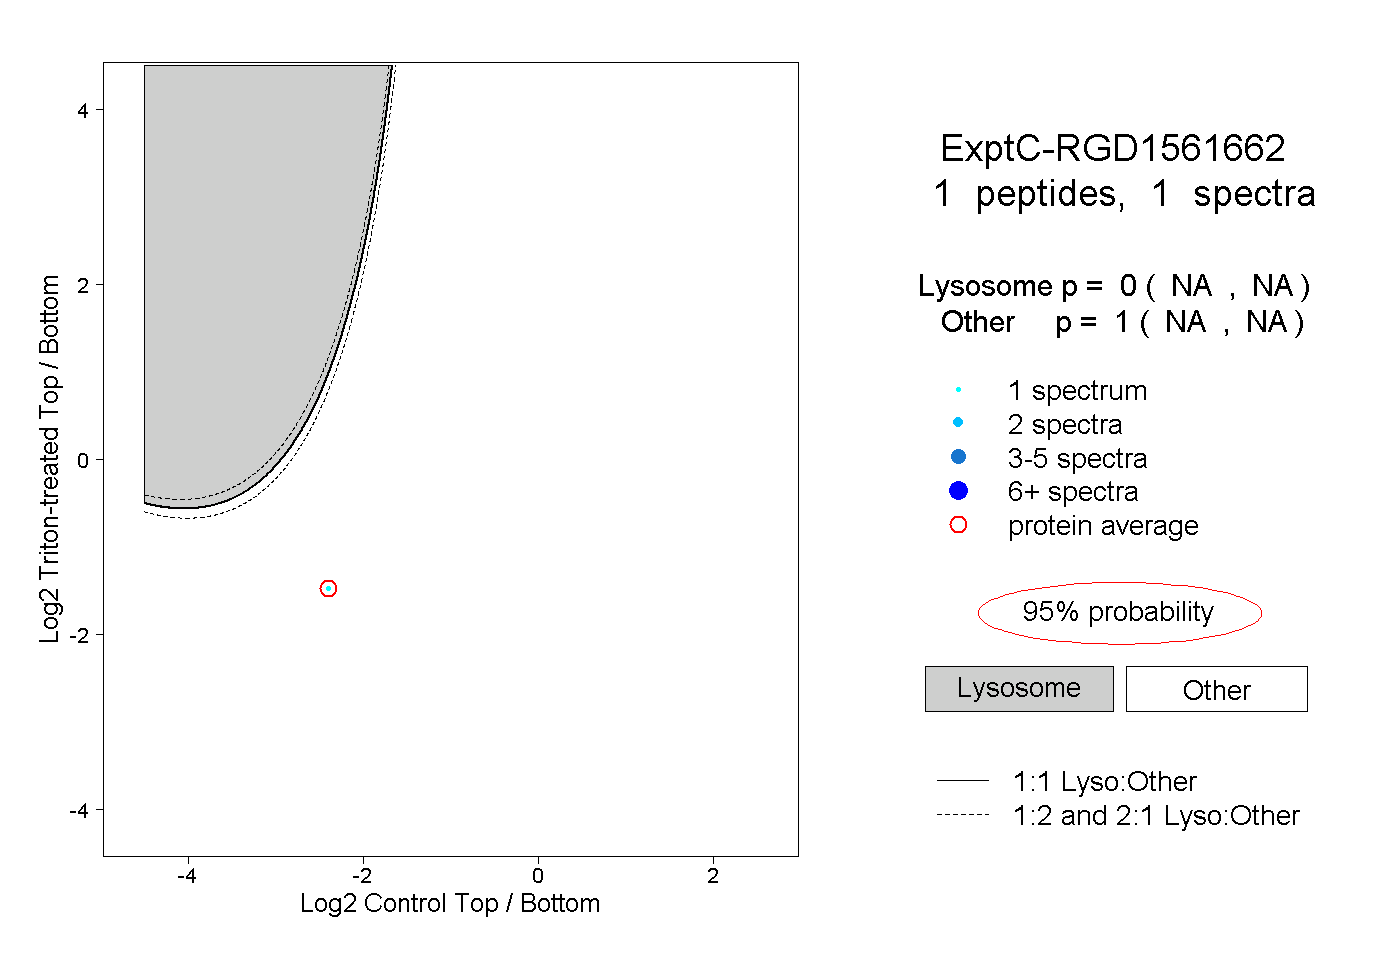 |
0.000 NA | NA |
1.000 NA | NA |