 4
4peptides
spectra
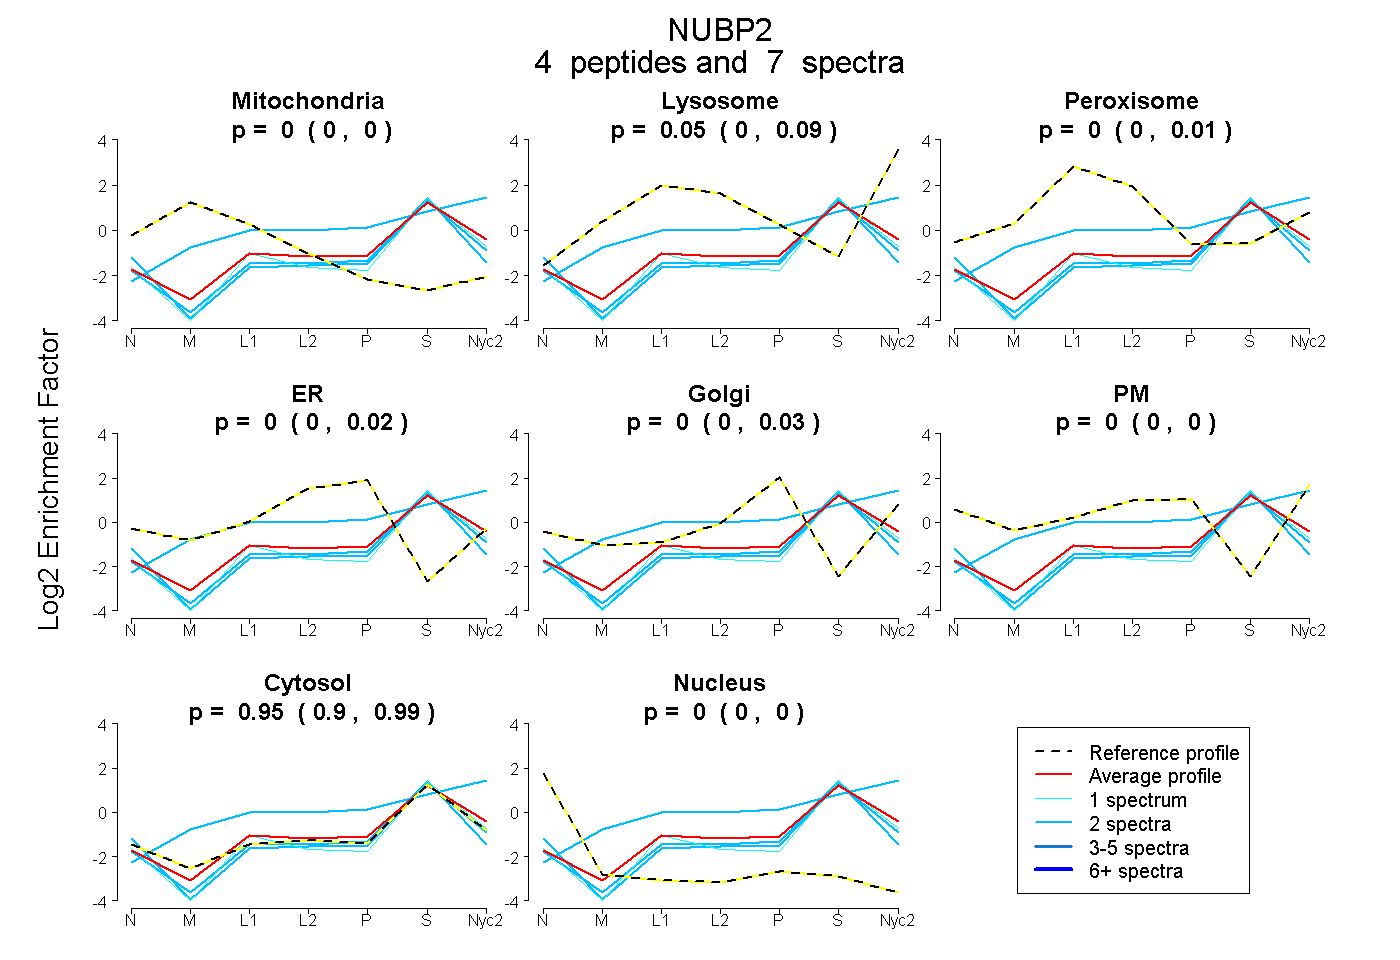
0.000 | 0.000
0.000 | 0.091
0.000 | 0.013
0.000 | 0.017
0.000 | 0.025
0.000 | 0.000
0.899 | 0.992
0.000 | 0.000
1peptide
spectrum
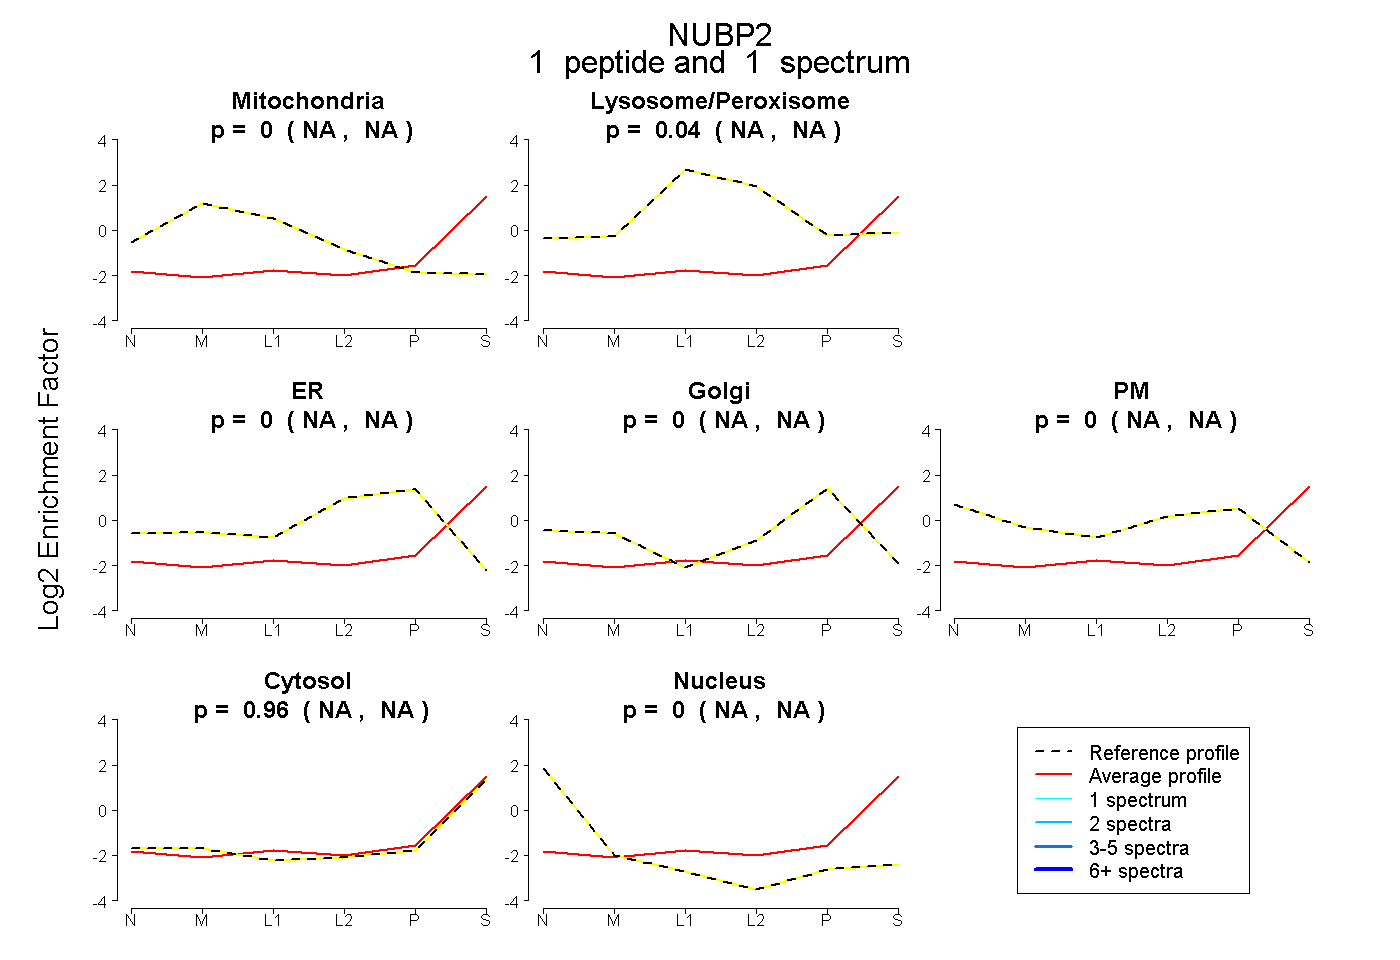
NA | NA
NA | NA
NA | NA
NA | NA
NA | NA
NA | NA
NA | NA
1peptide
spectrum
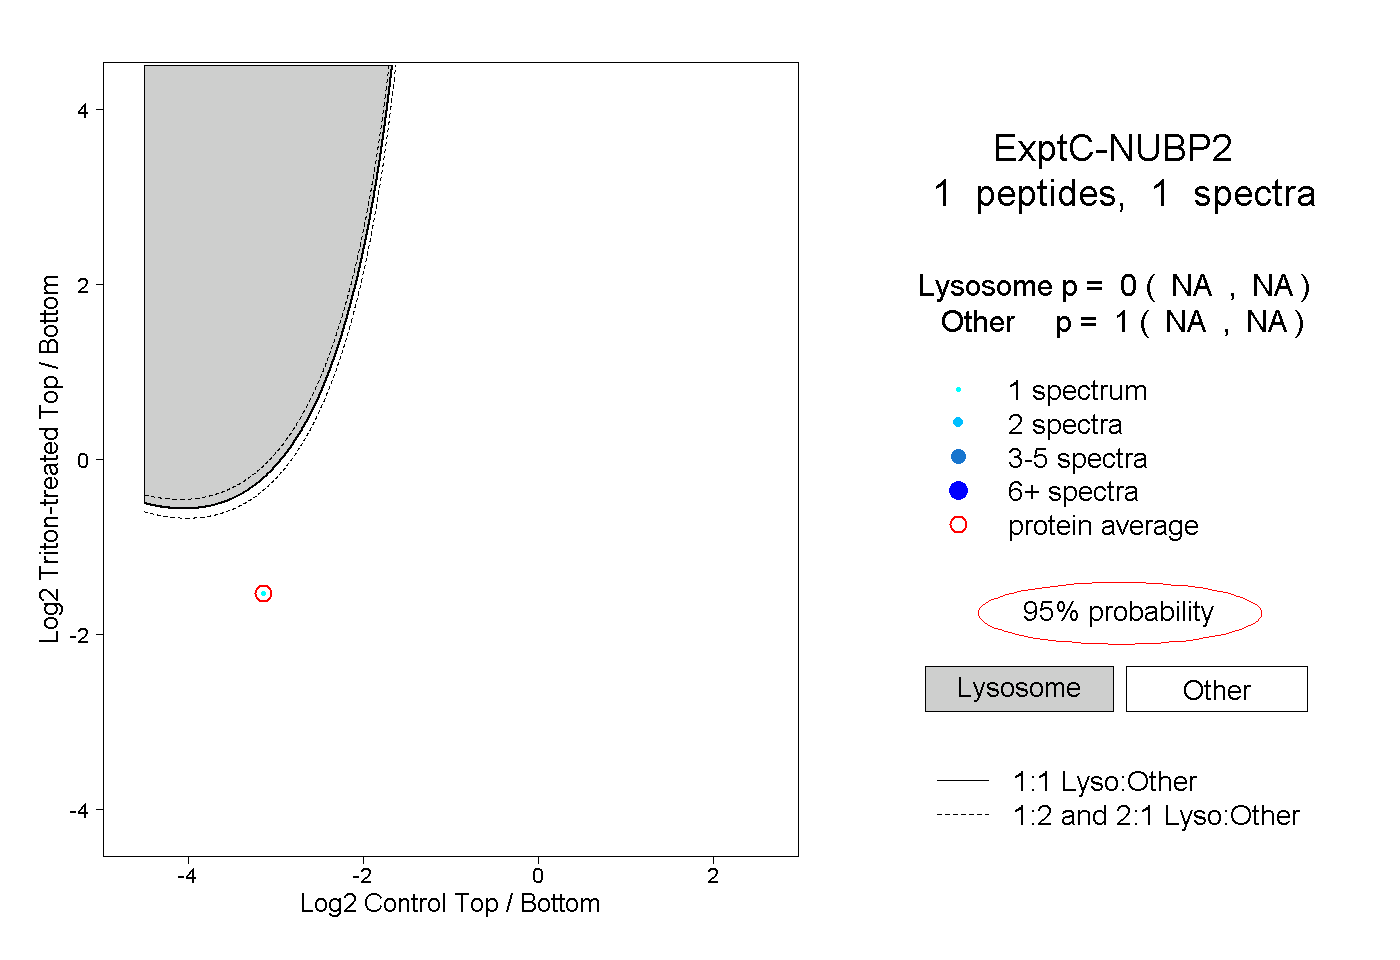
NA | NA
NA | NA