 4
4peptides
spectra
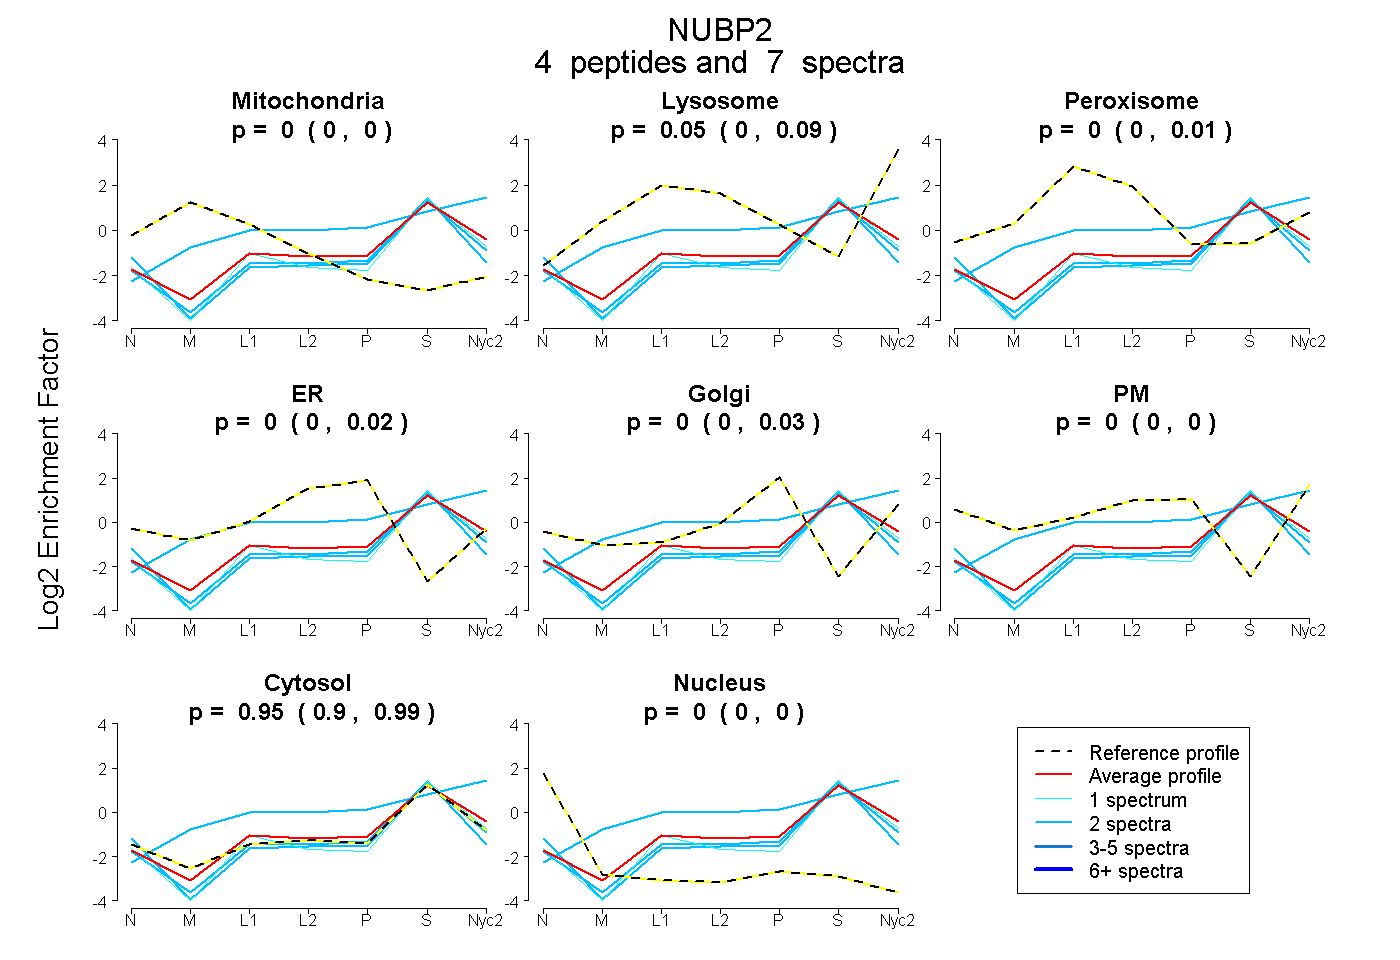
0.000 | 0.000
0.000 | 0.091
0.000 | 0.013
0.000 | 0.017
0.000 | 0.025
0.000 | 0.000
0.899 | 0.992
0.000 | 0.000
| Plot | Mito | Lyso | Perox | ER | Golgi | PM | Cytosol | Nucleus | |||||
| Expt A |
4 peptides |
7 spectra |
|
0.000 0.000 | 0.000 |
0.047 0.000 | 0.091 |
0.000 0.000 | 0.013 |
0.000 0.000 | 0.017 |
0.000 0.000 | 0.025 |
0.000 0.000 | 0.000 |
0.953 0.899 | 0.992 |
0.000 0.000 | 0.000 |
| 2 spectra, ELTFCK | 0.000 | 0.000 | 0.000 | 0.000 | 0.000 | 0.000 | 0.987 | 0.013 | ||
| 1 spectrum, STISTELALALR | 0.000 | 0.000 | 0.000 | 0.000 | 0.000 | 0.000 | 1.000 | 0.000 | ||
| 2 spectra, DFIQEFPK | 0.000 | 0.486 | 0.000 | 0.000 | 0.000 | 0.000 | 0.514 | 0.000 | ||
| 2 spectra, HIILVLSGK | 0.000 | 0.000 | 0.000 | 0.000 | 0.000 | 0.000 | 0.954 | 0.046 |
| Plot | Mito | Lyso or Perox | ER | Golgi | PM | Cytosol | Nucleus | ||||||
| Expt B |
1 peptide |
1 spectrum |
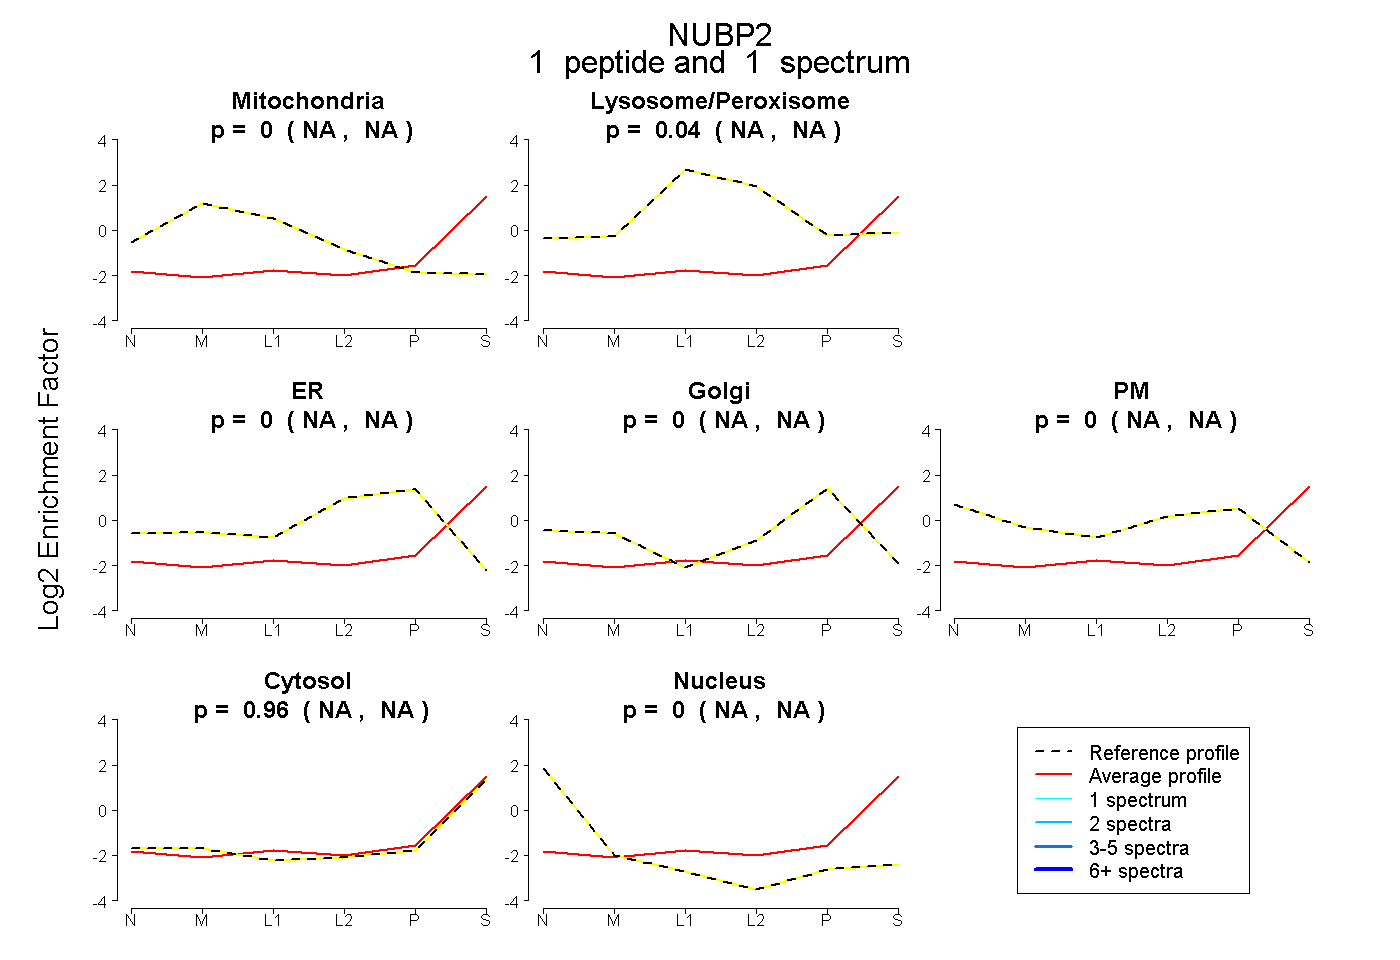 |
0.000 NA | NA |
0.040 NA | NA |
0.000 NA | NA |
0.000 NA | NA |
0.000 NA | NA |
0.960 NA | NA |
0.000 NA | NA |
|||
| Plot | Lyso | Other | |||||||||||
| Expt C |
1 peptide |
1 spectrum |
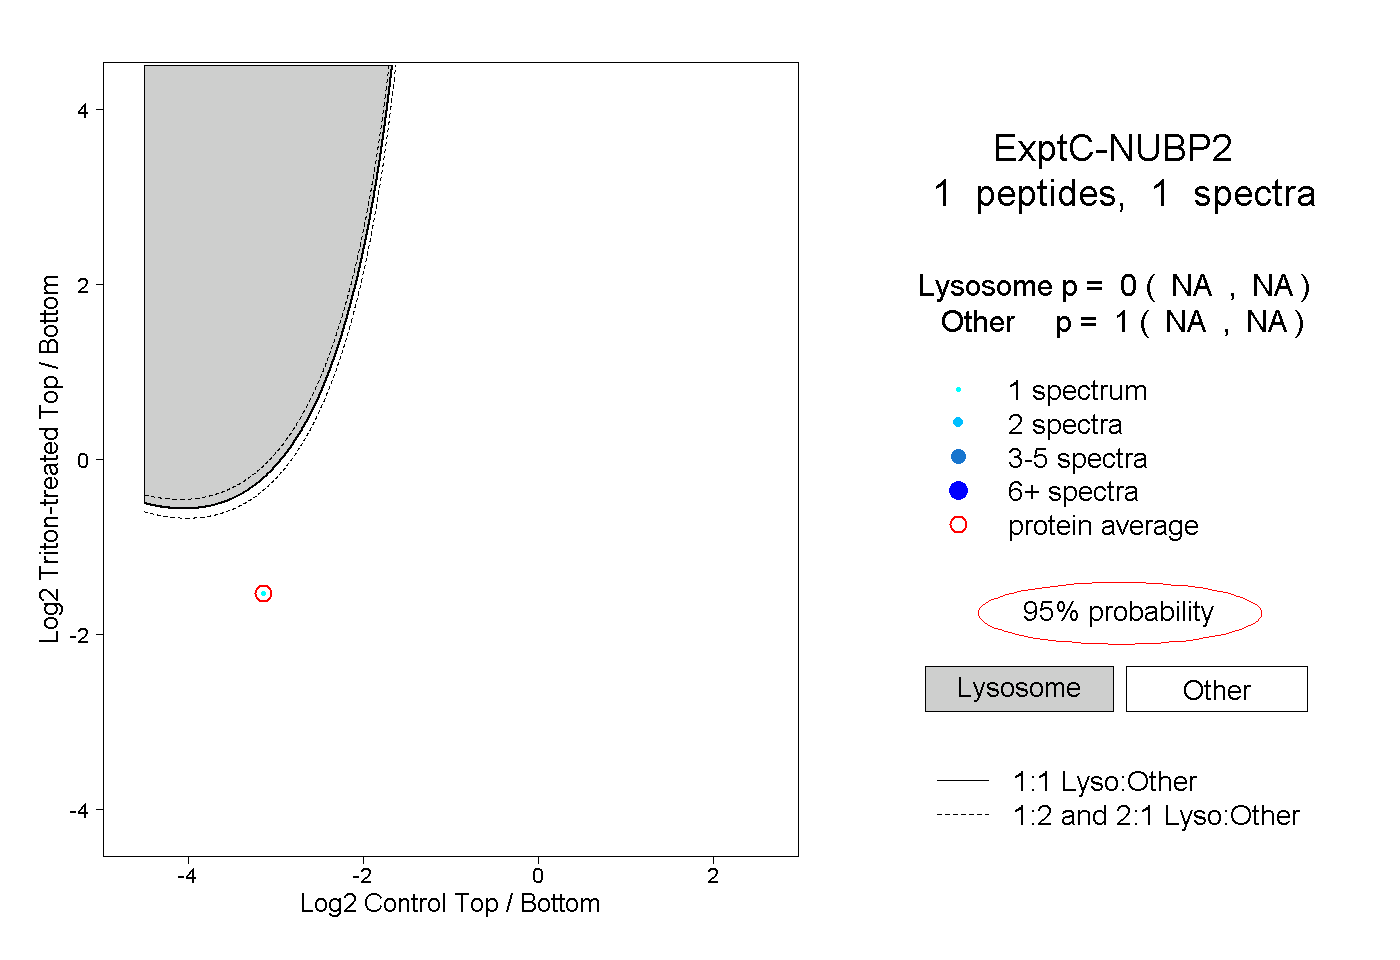 |
0.000 NA | NA |
1.000 NA | NA |