 6
6peptides
spectra
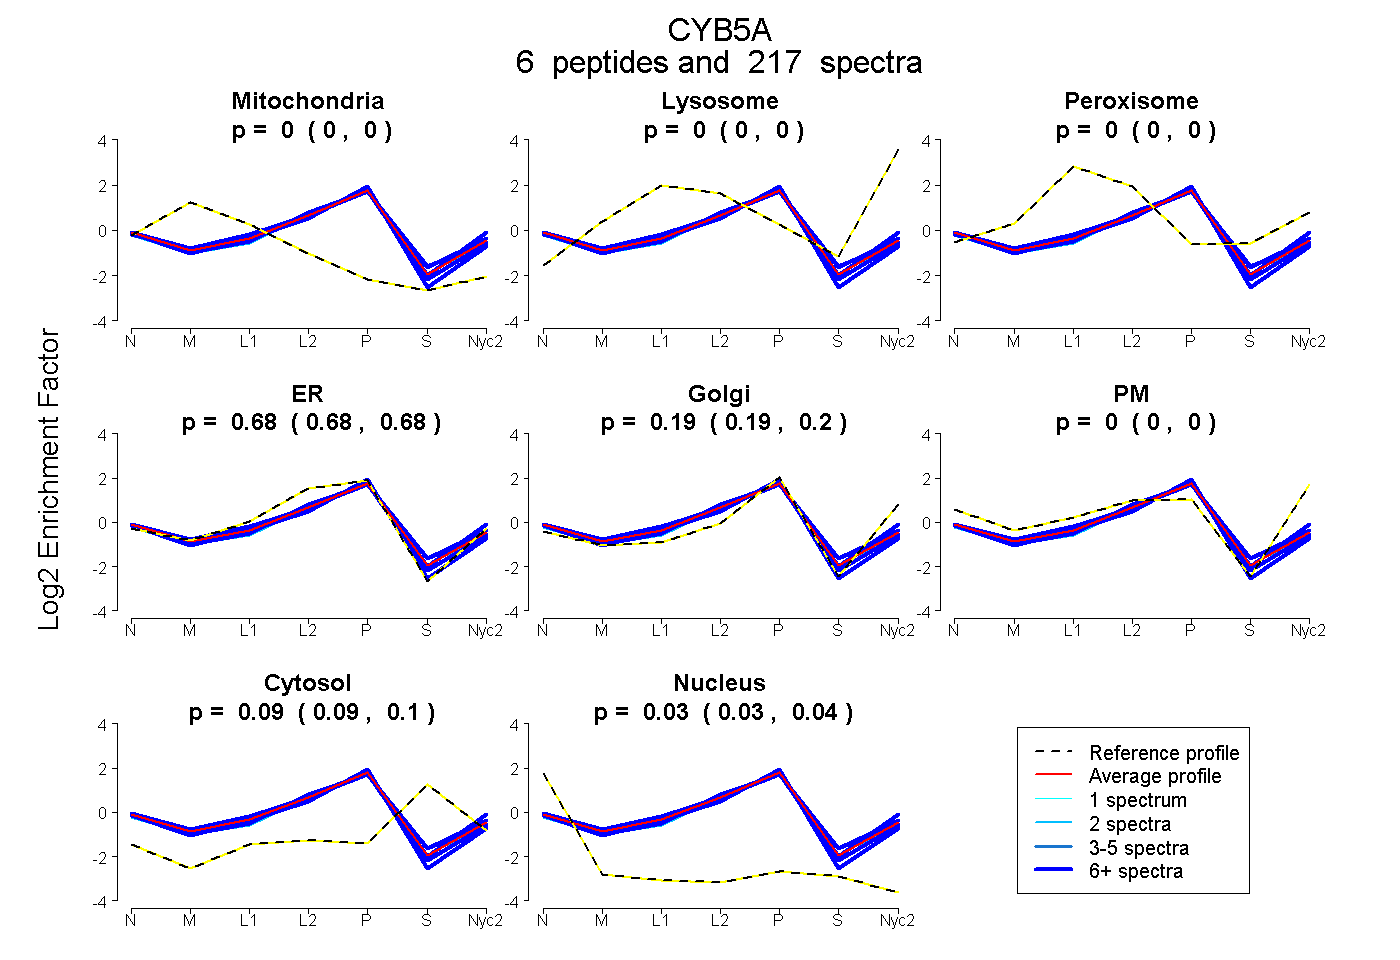
0.000 | 0.000
0.000 | 0.000
0.000 | 0.000
0.677 | 0.684
0.186 | 0.195
0.000 | 0.000
0.090 | 0.098
0.031 | 0.035
6peptides
spectra
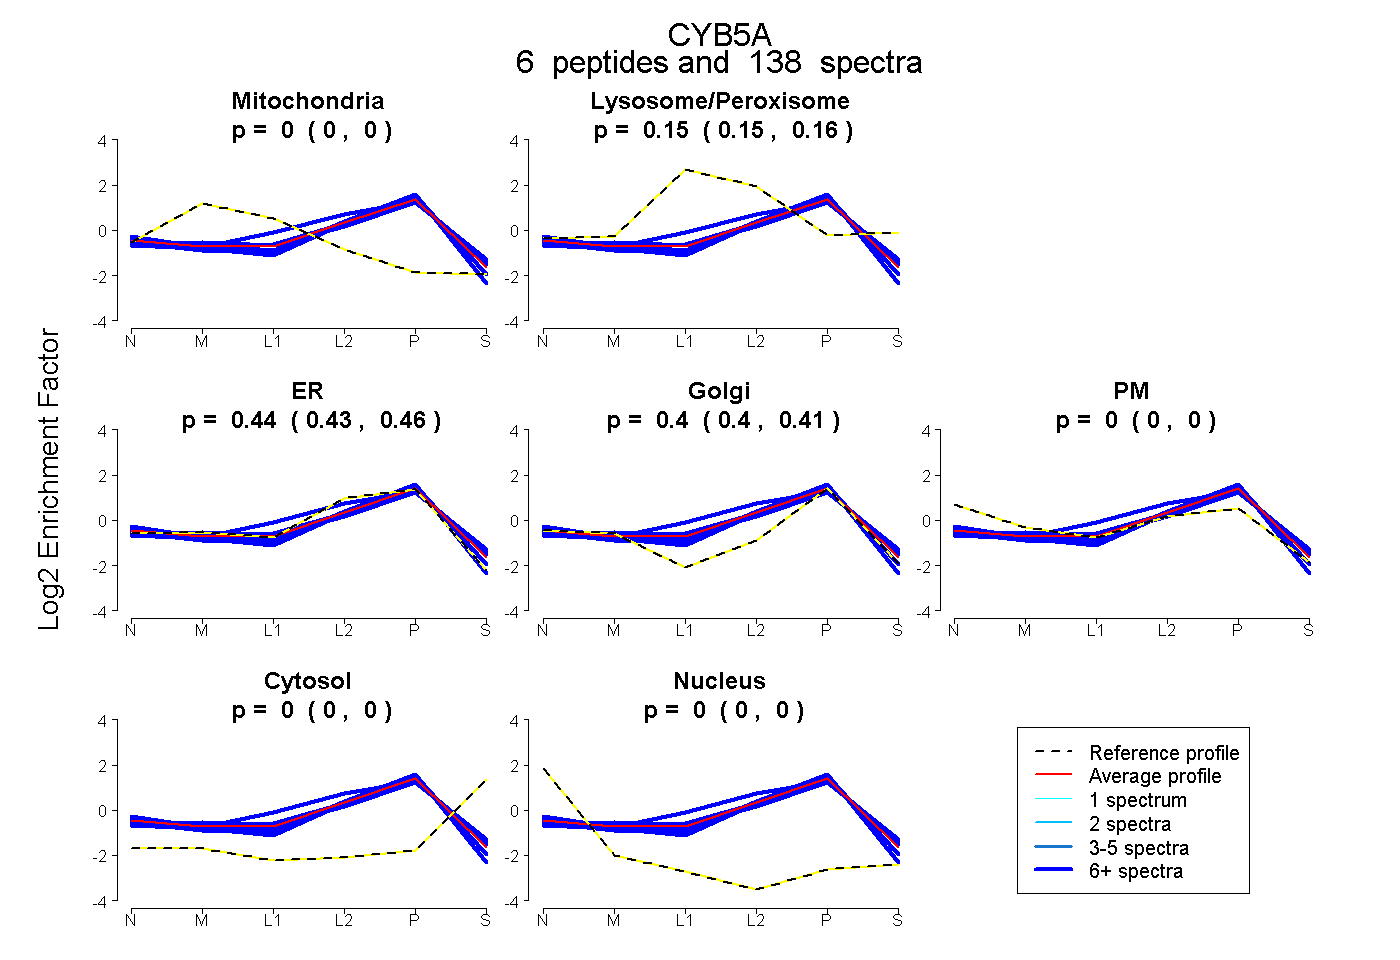
0.000 | 0.000
0.146 | 0.157
0.430 | 0.455
0.395 | 0.412
0.000 | 0.000
0.000 | 0.000
0.000 | 0.000
6peptides
spectra
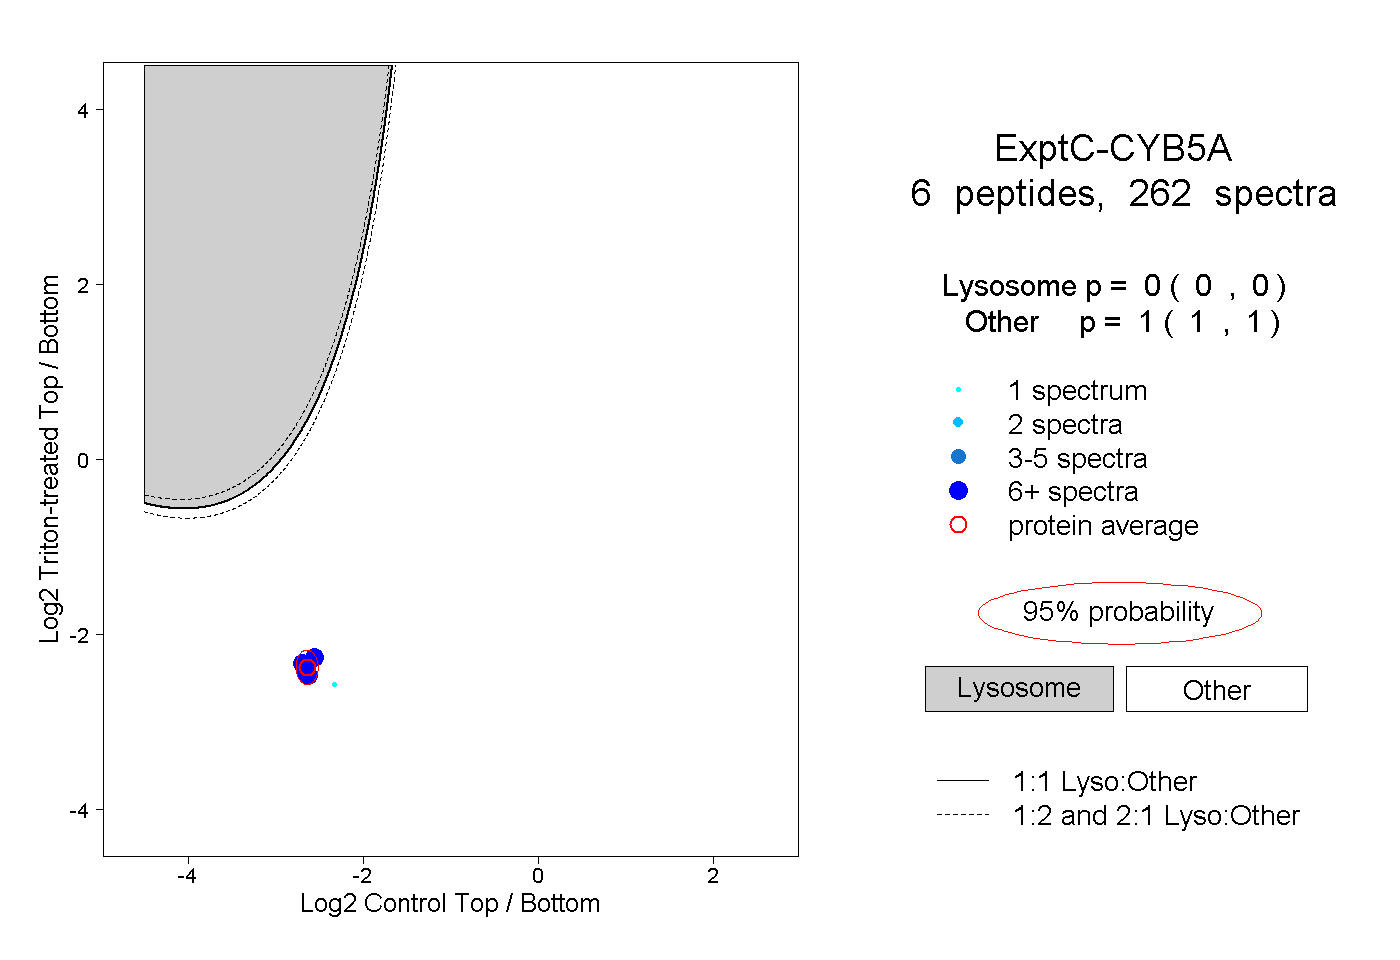
0.000 | 0.000
1.000 | 1.000
5peptides
spectra
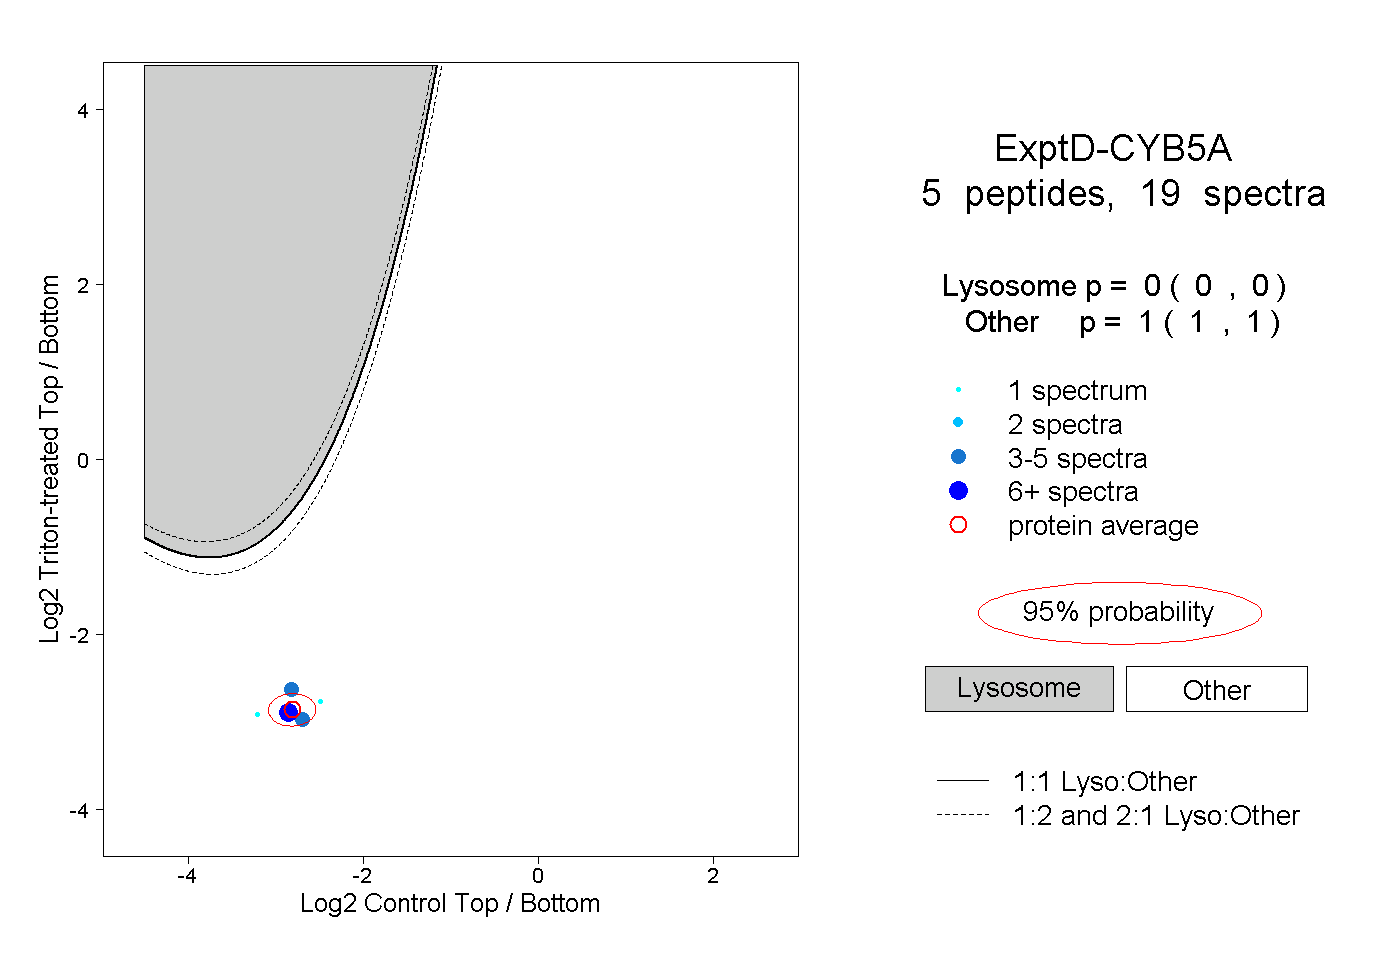
0.000 | 0.000
1.000 | 1.000