 6
6peptides
spectra
0.000 | 0.000
0.000 | 0.000
0.000 | 0.000
0.677 | 0.684
0.186 | 0.195
0.000 | 0.000
0.090 | 0.098
0.031 | 0.035
| Plot | Mito | Lyso | Perox | ER | Golgi | PM | Cytosol | Nucleus | |||||
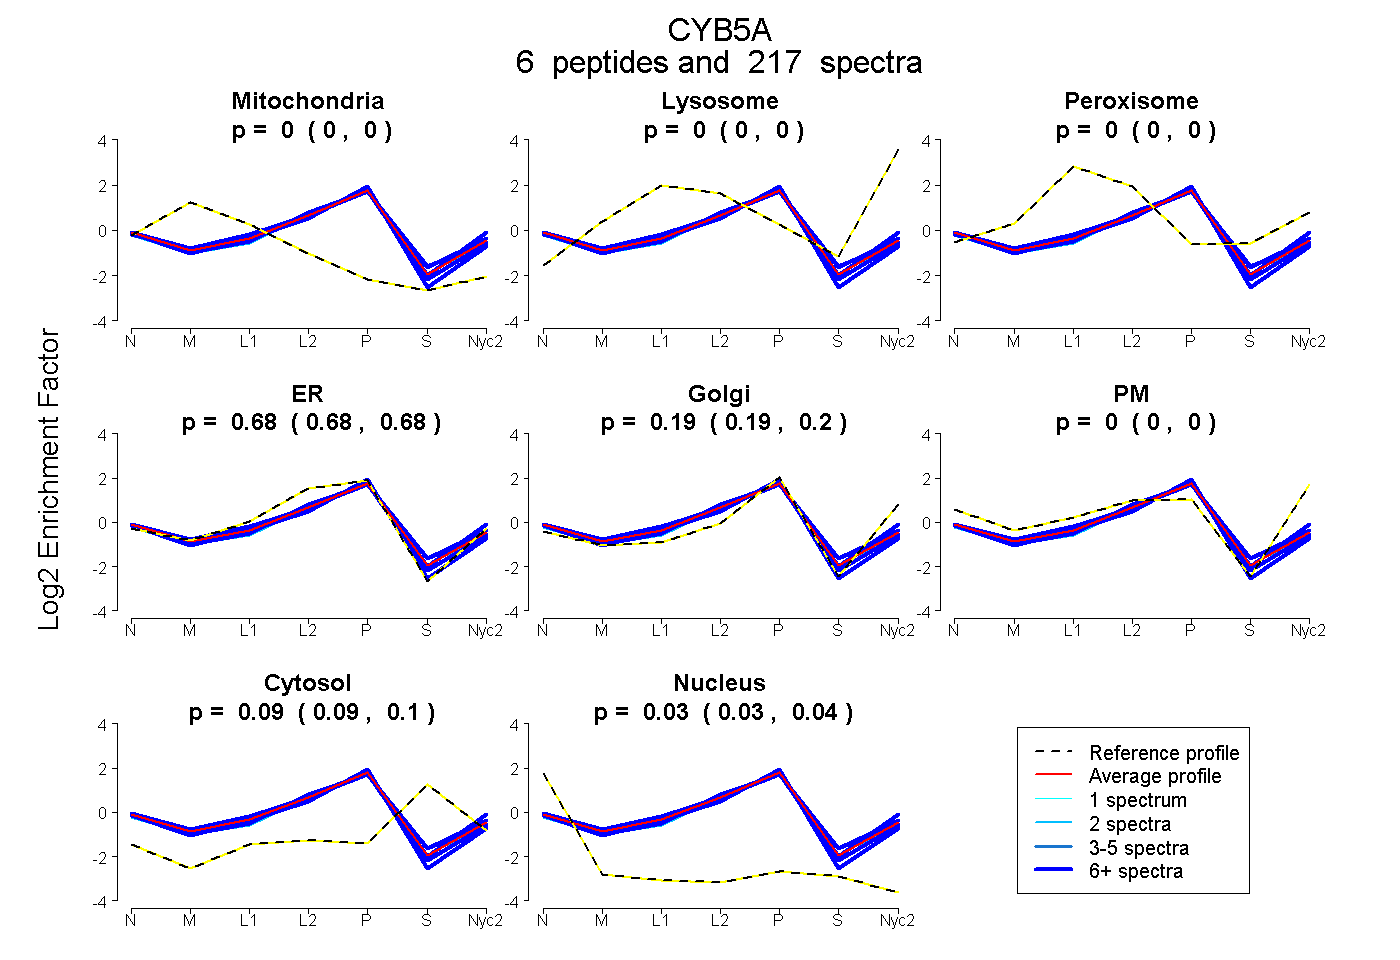
| Expt A |
6 peptides |
217 spectra |
|
0.000 0.000 | 0.000 |
0.000 0.000 | 0.000 |
0.000 0.000 | 0.000 |
0.681 0.677 | 0.684 |
0.191 0.186 | 0.195 |
0.000 0.000 | 0.000 |
0.094 0.090 | 0.098 |
0.033 0.031 | 0.035 |
| 22 spectra, VYDLTK | 0.000 | 0.000 | 0.000 | 0.690 | 0.215 | 0.000 | 0.000 | 0.094 | ||
| 56 spectra, TYIIGELHPDDR | 0.015 | 0.000 | 0.000 | 0.642 | 0.196 | 0.000 | 0.148 | 0.000 | ||
| 37 spectra, YYTLEEIQK | 0.019 | 0.000 | 0.000 | 0.723 | 0.153 | 0.000 | 0.058 | 0.047 | ||
| 70 spectra, FLEEHPGGEEVLR | 0.000 | 0.000 | 0.000 | 0.713 | 0.108 | 0.000 | 0.161 | 0.018 | ||
| 2 spectra, EQAGGDATENFEDVGHSTDAR | 0.000 | 0.000 | 0.000 | 0.599 | 0.310 | 0.000 | 0.052 | 0.039 | ||
| 30 spectra, STWVILHHK | 0.014 | 0.000 | 0.036 | 0.539 | 0.342 | 0.000 | 0.067 | 0.002 |
| Plot | Mito | Lyso or Perox | ER | Golgi | PM | Cytosol | Nucleus | ||||||
| Expt B |
6 peptides |
138 spectra |
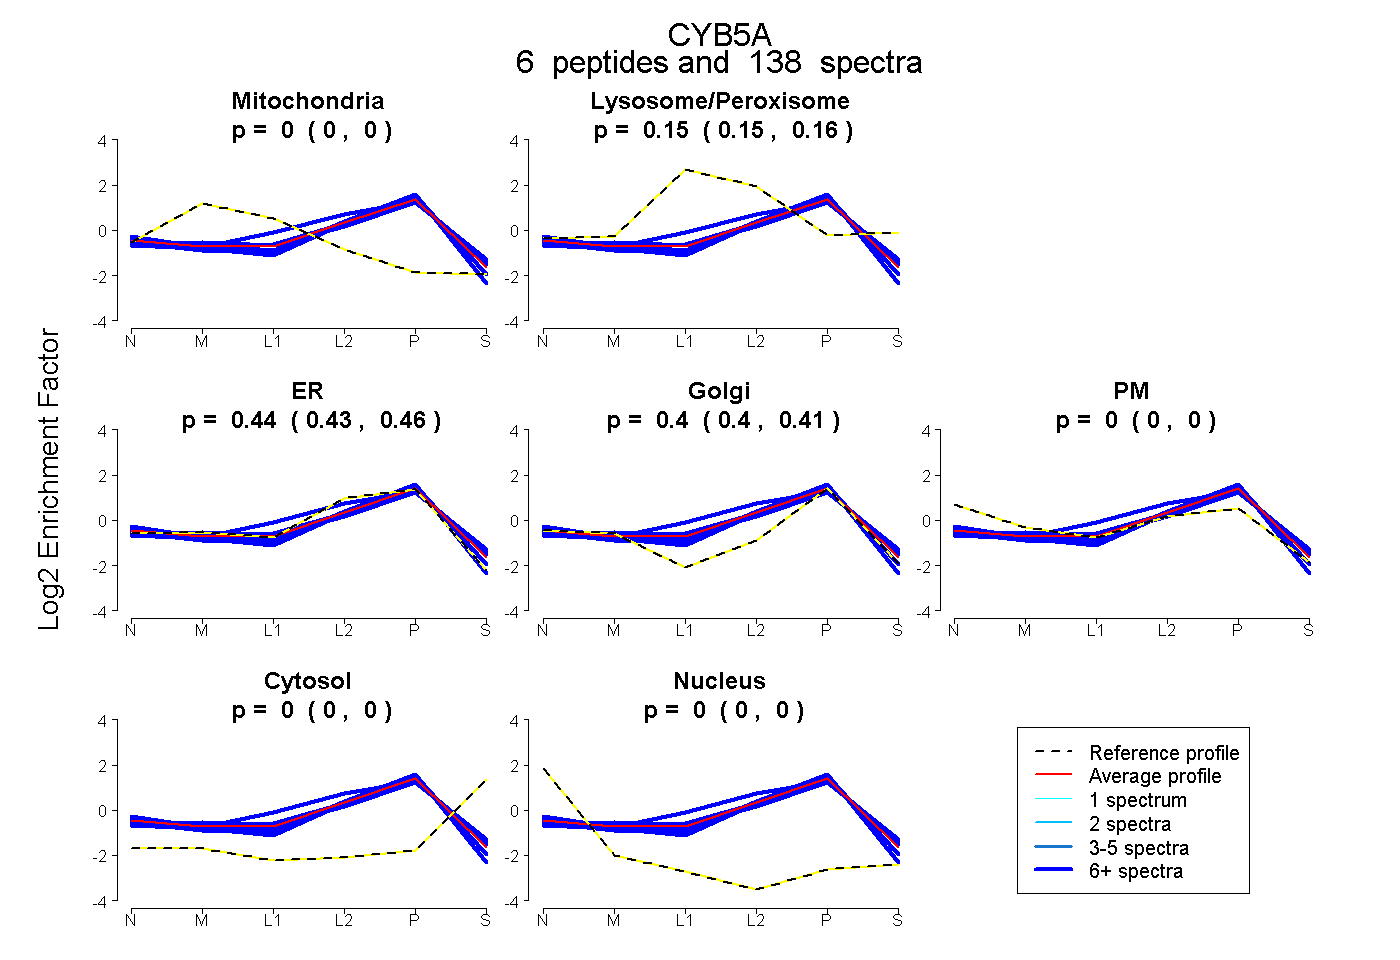 |
0.000 0.000 | 0.000 |
0.152 0.146 | 0.157 |
0.444 0.430 | 0.455 |
0.404 0.395 | 0.412 |
0.000 0.000 | 0.000 |
0.000 0.000 | 0.000 |
0.000 0.000 | 0.000 |
|||
| Plot | Lyso | Other | |||||||||||
| Expt C |
6 peptides |
262 spectra |
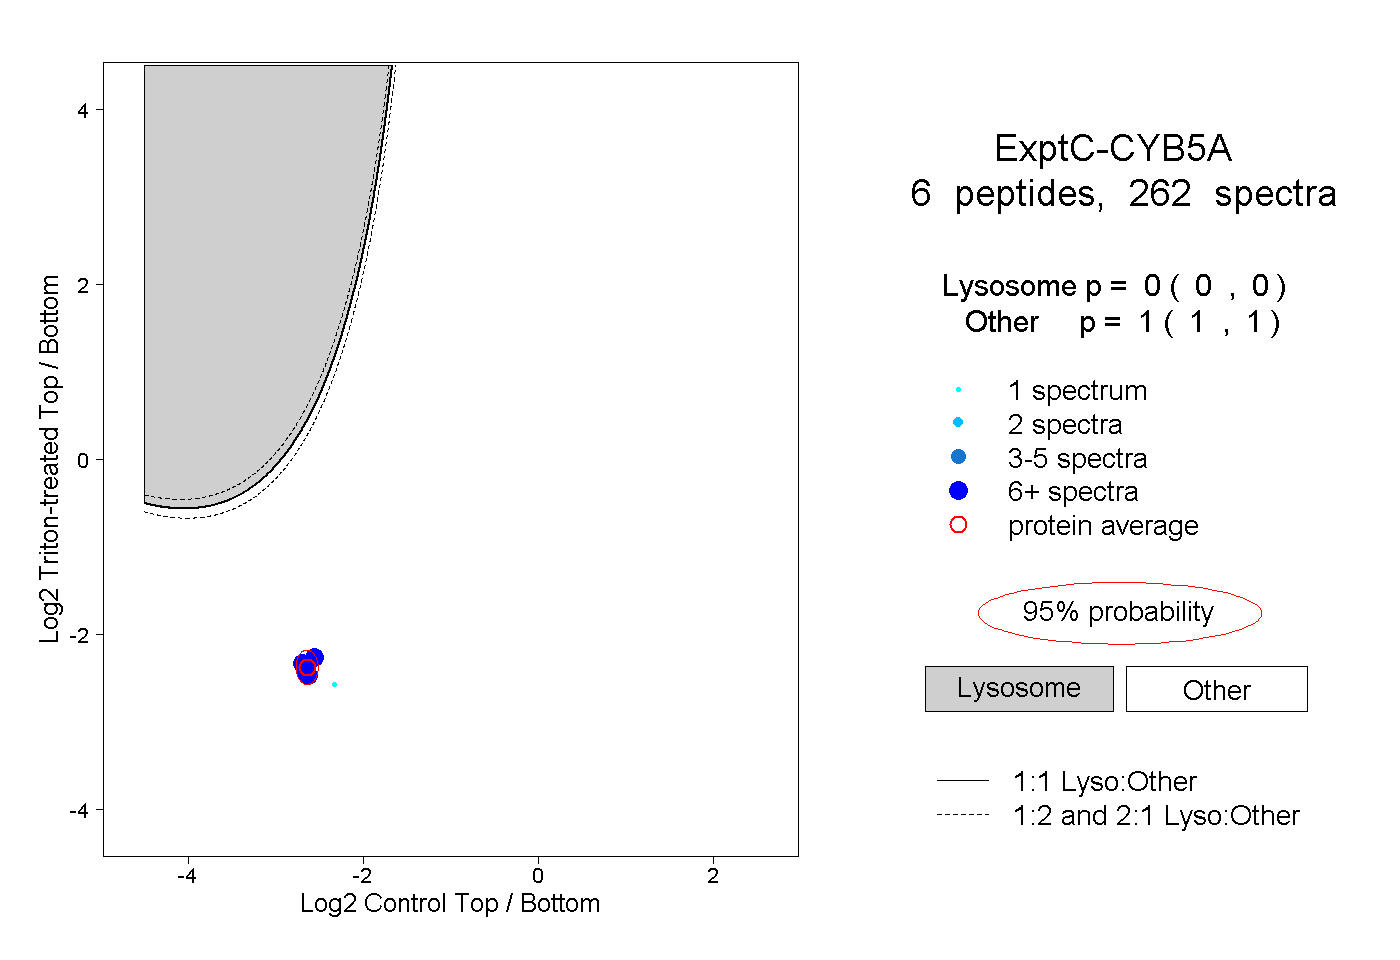 |
0.000 0.000 | 0.000 |
1.000 1.000 | 1.000 |
||||||||
| Plot | Lyso | Other | |||||||||||
| Expt D |
5 peptides |
19 spectra |
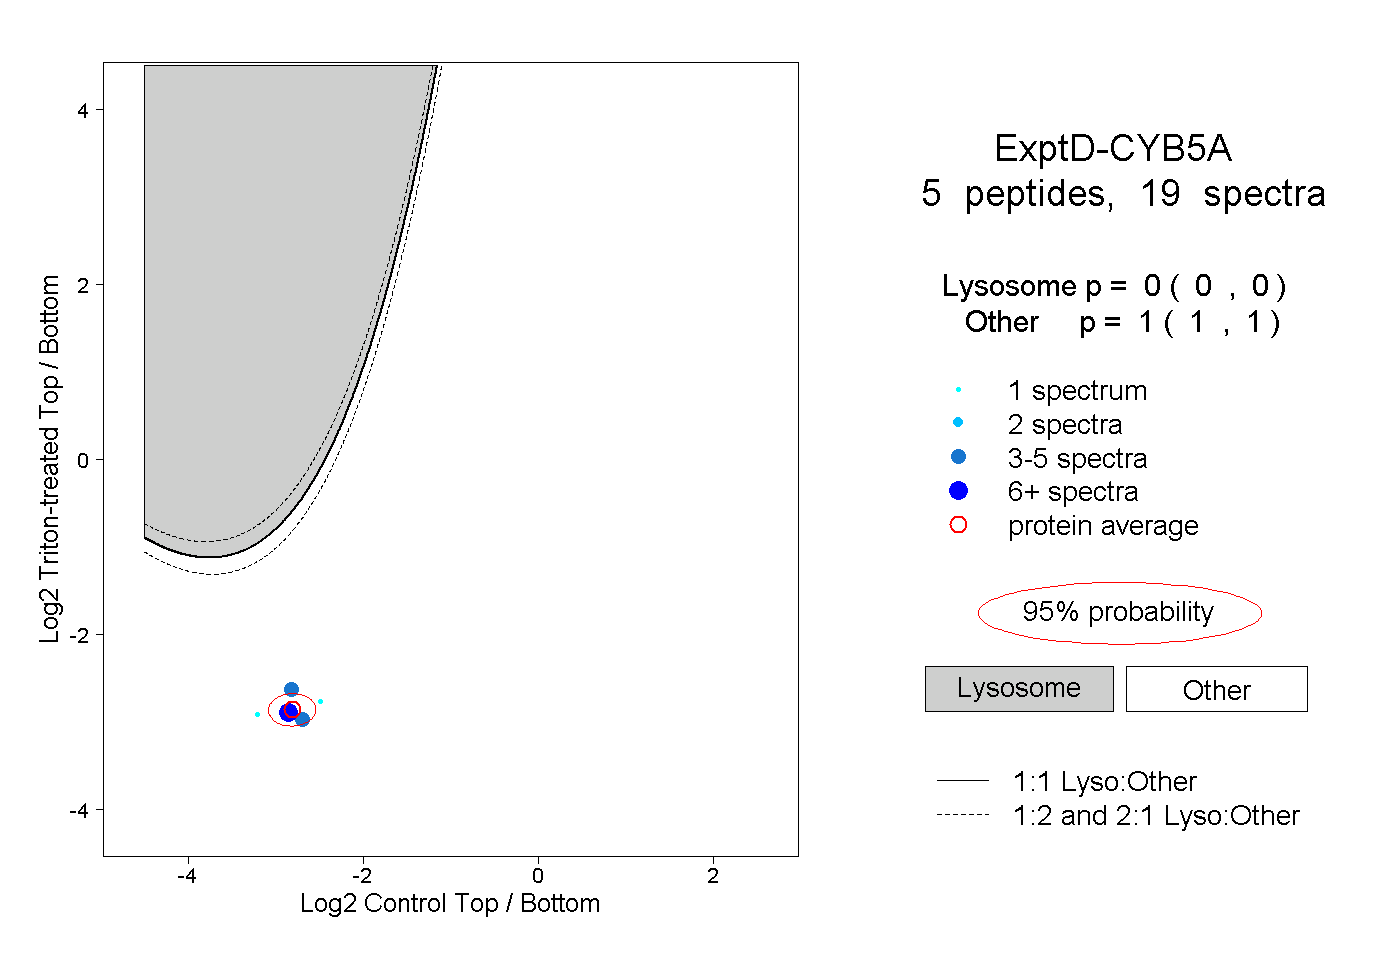 |
0.000 0.000 | 0.000 |
1.000 1.000 | 1.000 |