 4
4peptides
spectra
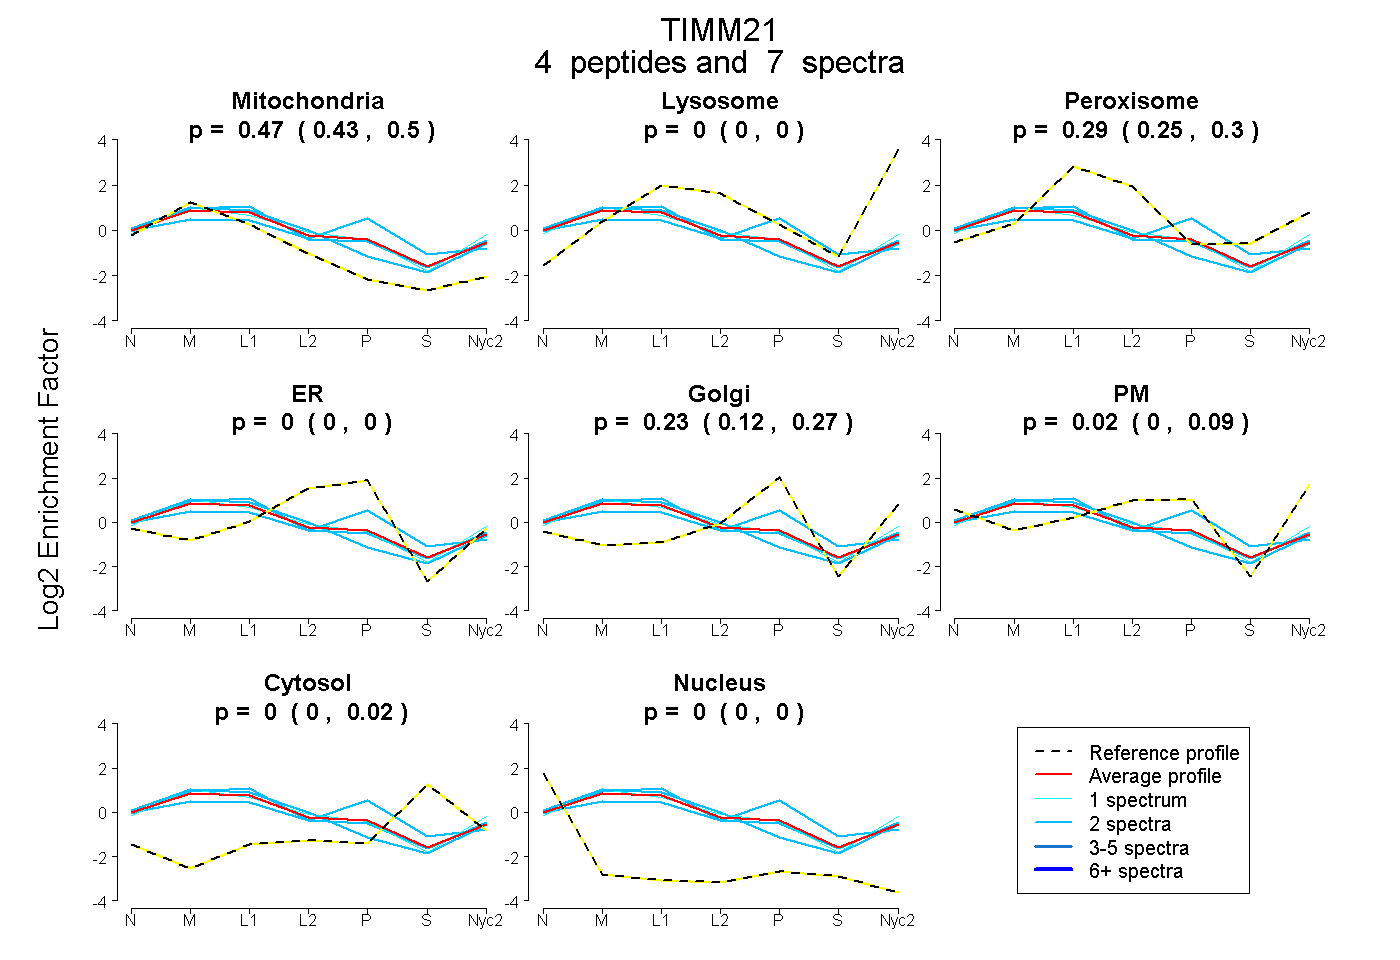
0.435 | 0.496
0.000 | 0.000
0.248 | 0.305
0.000 | 0.000
0.125 | 0.269
0.000 | 0.086
0.000 | 0.019
0.000 | 0.000
2peptides
spectra
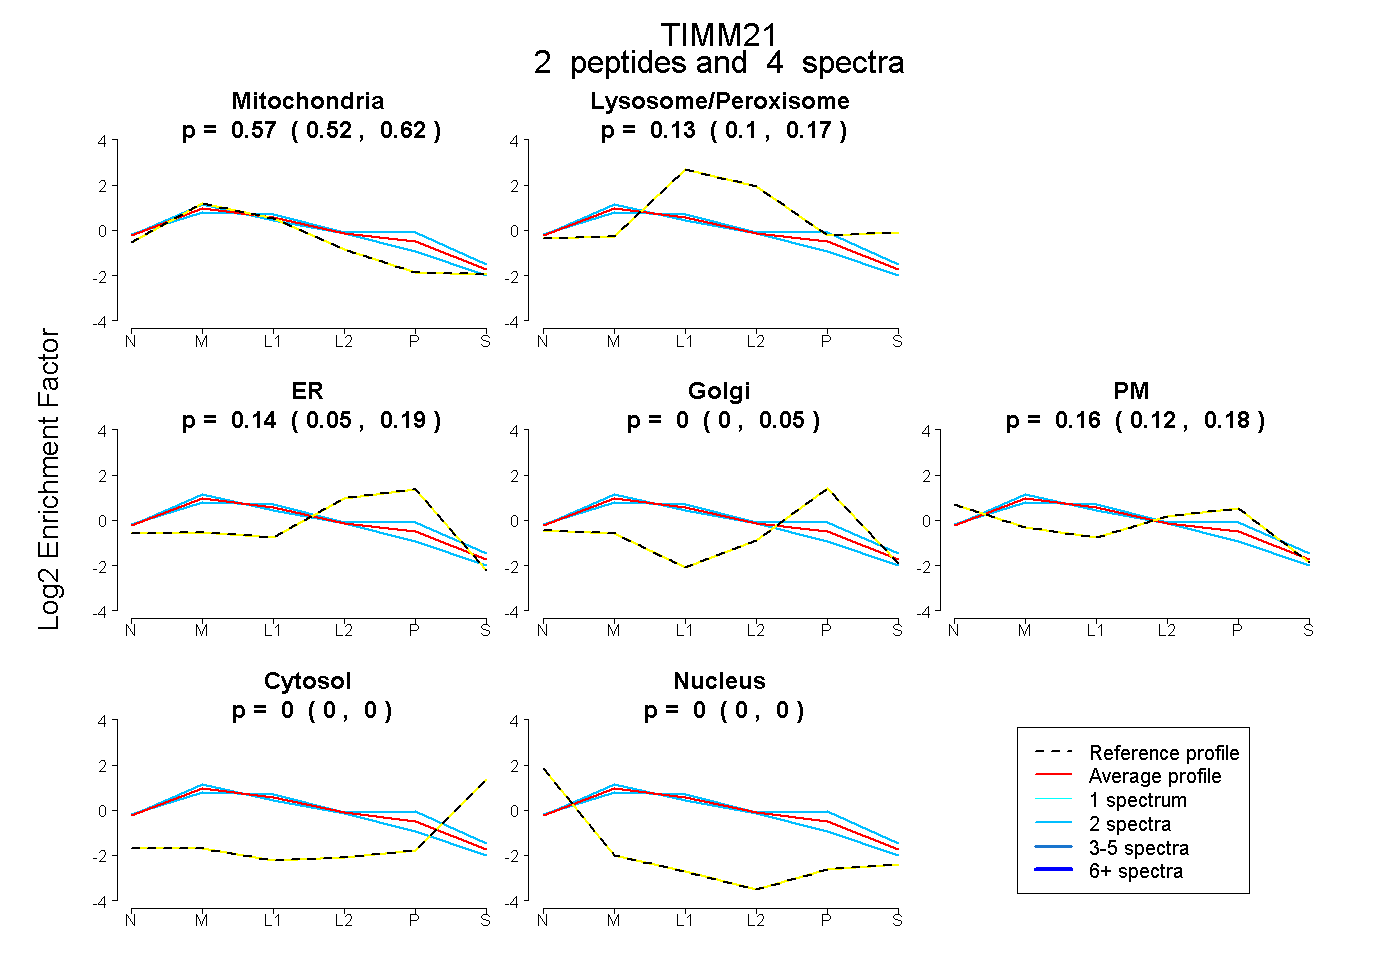
0.521 | 0.615
0.100 | 0.167
0.049 | 0.191
0.000 | 0.049
0.119 | 0.184
0.000 | 0.000
0.000 | 0.000
6peptides
spectra
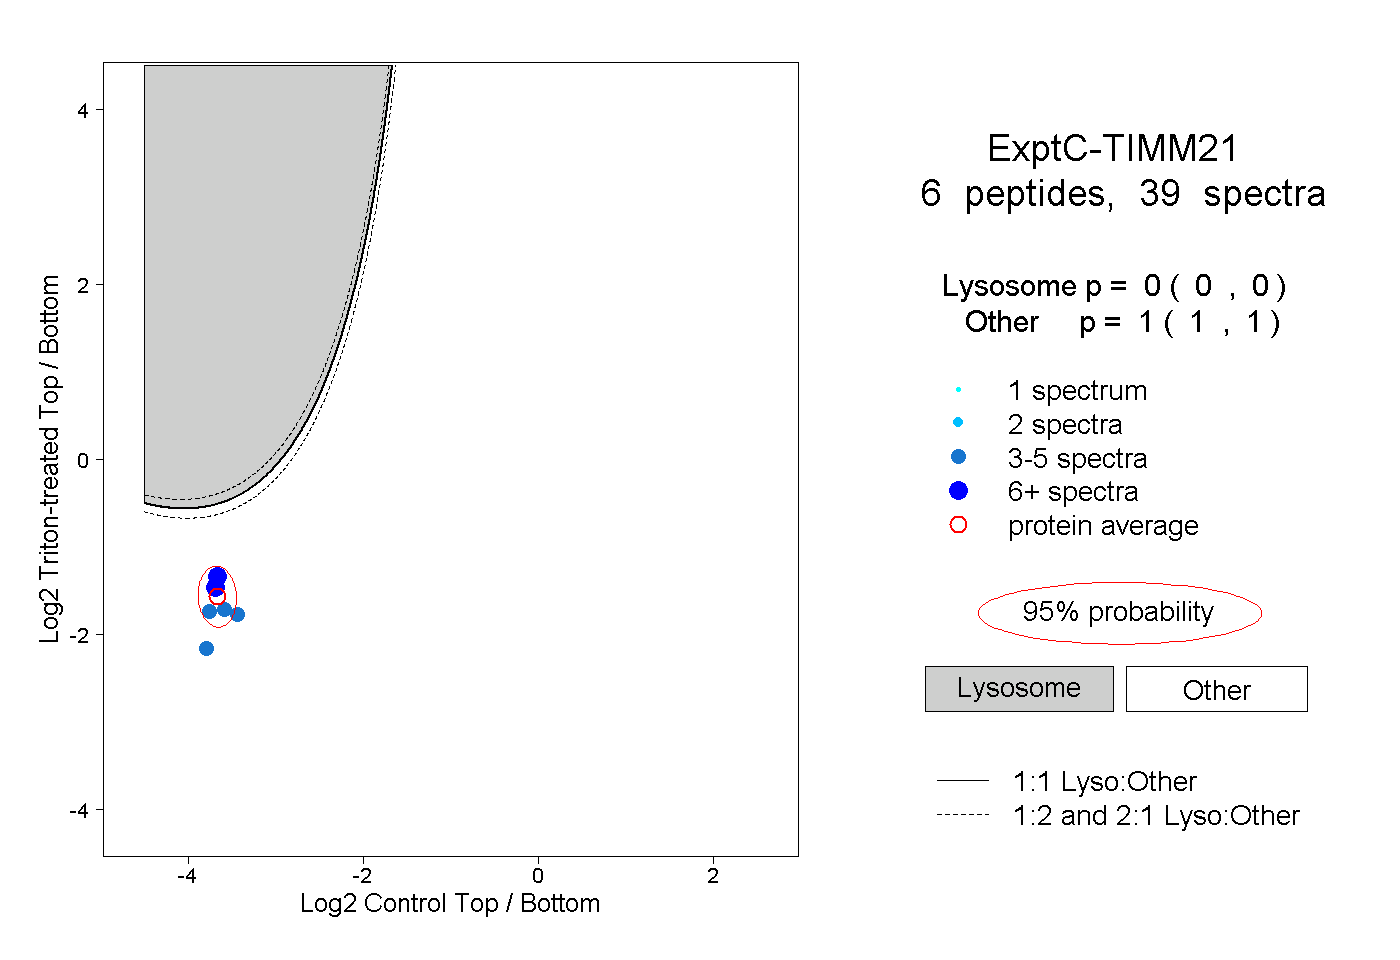
0.000 | 0.000
1.000 | 1.000
2peptides
spectra
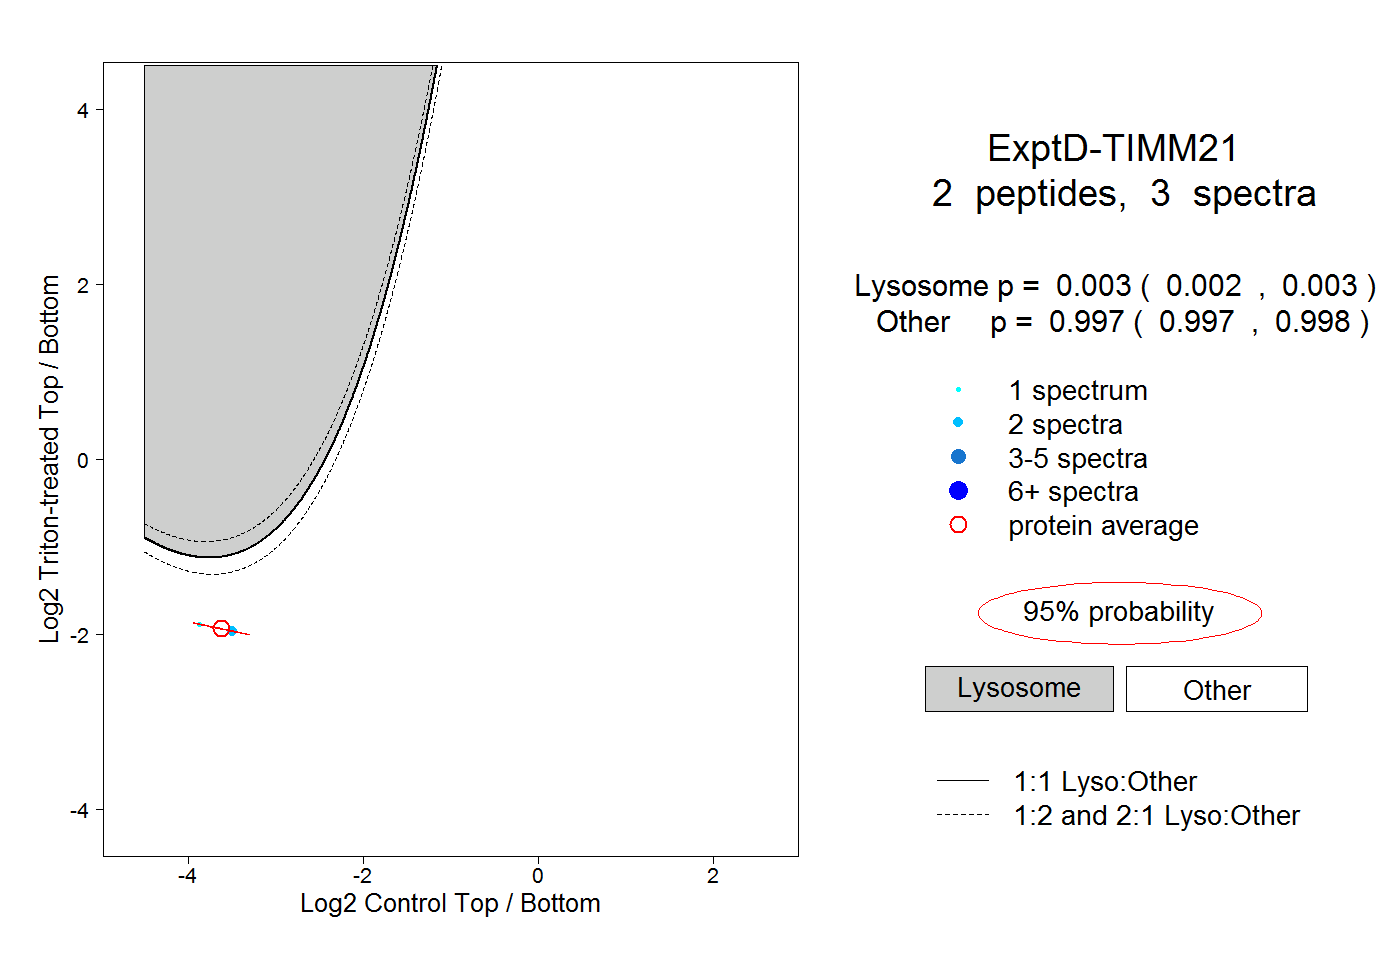
0.002 | 0.003
0.997 | 0.998