 4
4peptides
spectra
0.435 | 0.496
0.000 | 0.000
0.248 | 0.305
0.000 | 0.000
0.125 | 0.269
0.000 | 0.086
0.000 | 0.019
0.000 | 0.000
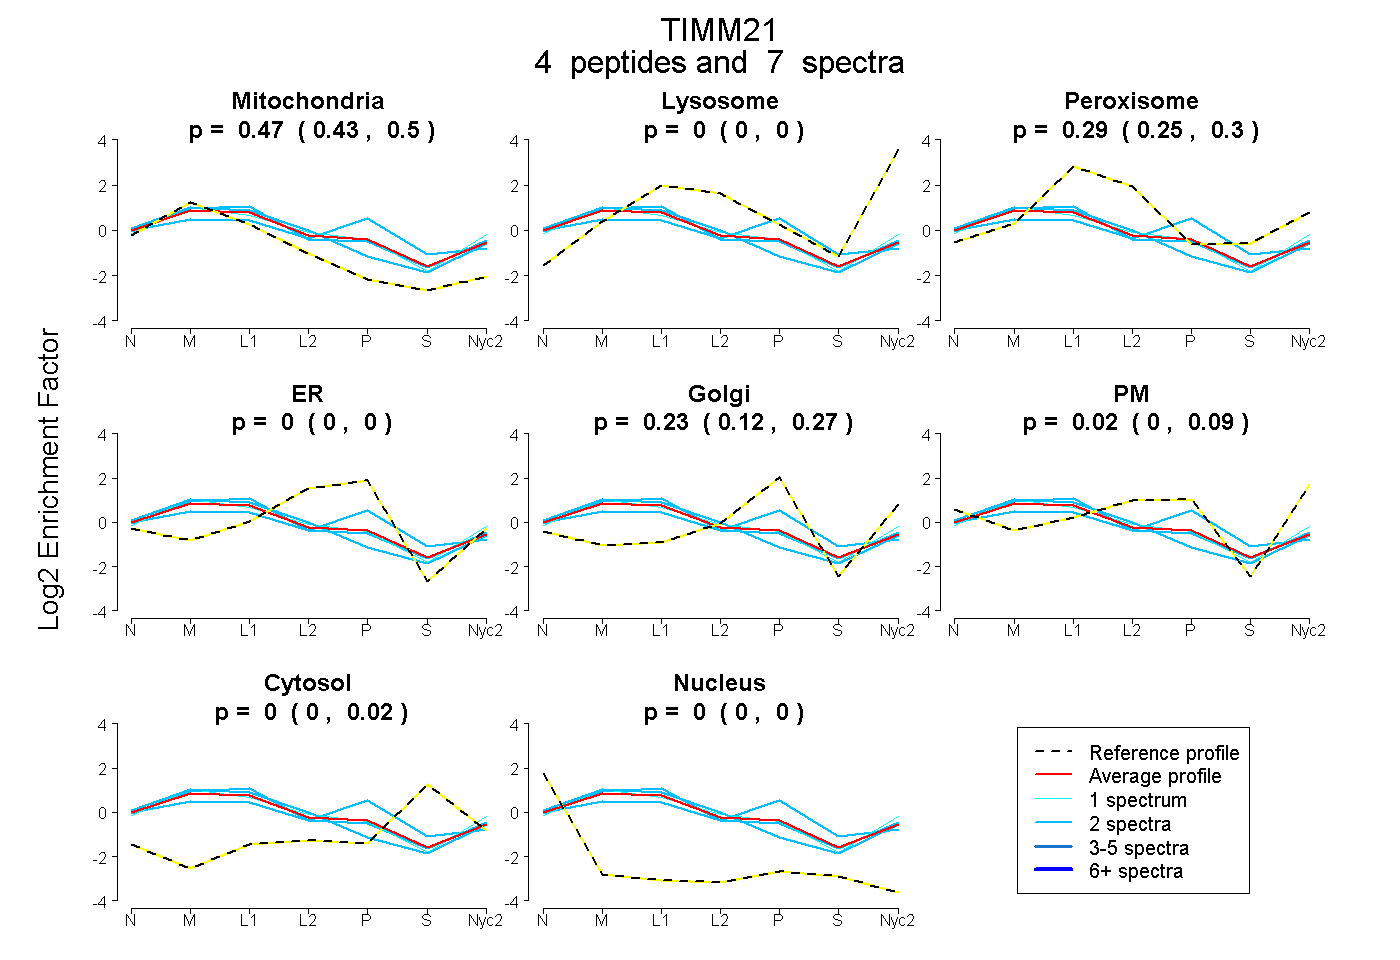
| Plot | Mito | Lyso | Perox | ER | Golgi | PM | Cytosol | Nucleus | |||||
| Expt A |
4 peptides |
7 spectra |
|
0.468 0.435 | 0.496 |
0.000 0.000 | 0.000 |
0.286 0.248 | 0.305 |
0.000 0.000 | 0.000 |
0.226 0.125 | 0.269 |
0.020 0.000 | 0.086 |
0.000 0.000 | 0.019 |
0.000 0.000 | 0.000 |
| 2 spectra, GYGEMSR | 0.492 | 0.020 | 0.286 | 0.000 | 0.156 | 0.046 | 0.000 | 0.000 | ||
| 2 spectra, SIVVEDNR | 0.565 | 0.000 | 0.260 | 0.000 | 0.000 | 0.175 | 0.000 | 0.000 | ||
| 1 spectrum, SGQFDFR | 0.481 | 0.097 | 0.156 | 0.000 | 0.124 | 0.141 | 0.000 | 0.000 | ||
| 2 spectra, QGTVHAEVEENPR | 0.333 | 0.000 | 0.216 | 0.039 | 0.333 | 0.000 | 0.079 | 0.000 |
| Plot | Mito | Lyso or Perox | ER | Golgi | PM | Cytosol | Nucleus | ||||||
| Expt B |
2 peptides |
4 spectra |
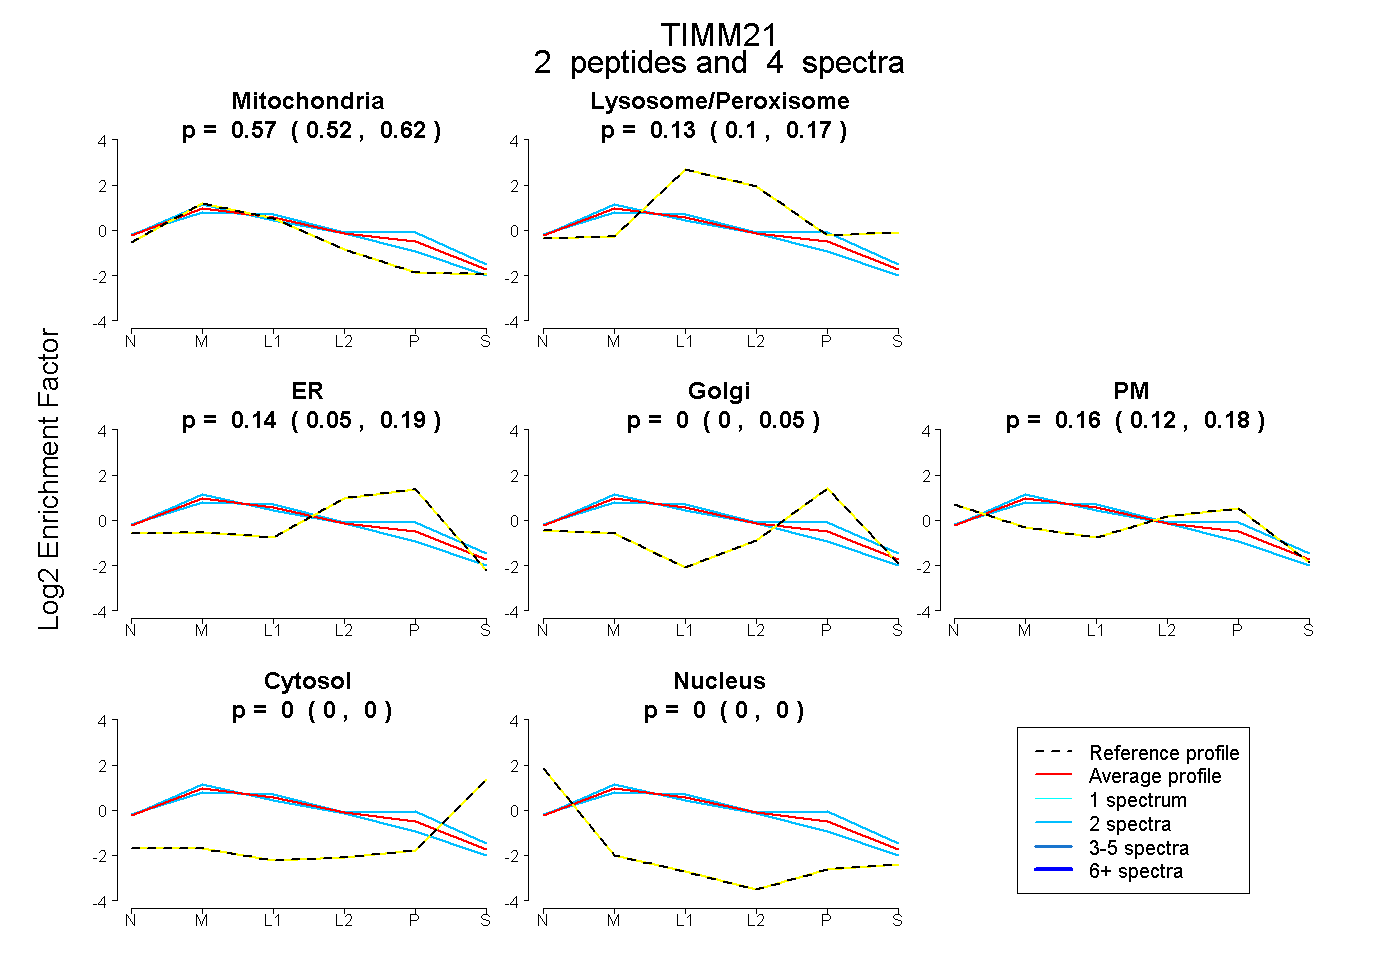 |
0.574 0.521 | 0.615 |
0.131 0.100 | 0.167 |
0.138 0.049 | 0.191 |
0.000 0.000 | 0.049 |
0.158 0.119 | 0.184 |
0.000 0.000 | 0.000 |
0.000 0.000 | 0.000 |
|||
| Plot | Lyso | Other | |||||||||||
| Expt C |
6 peptides |
39 spectra |
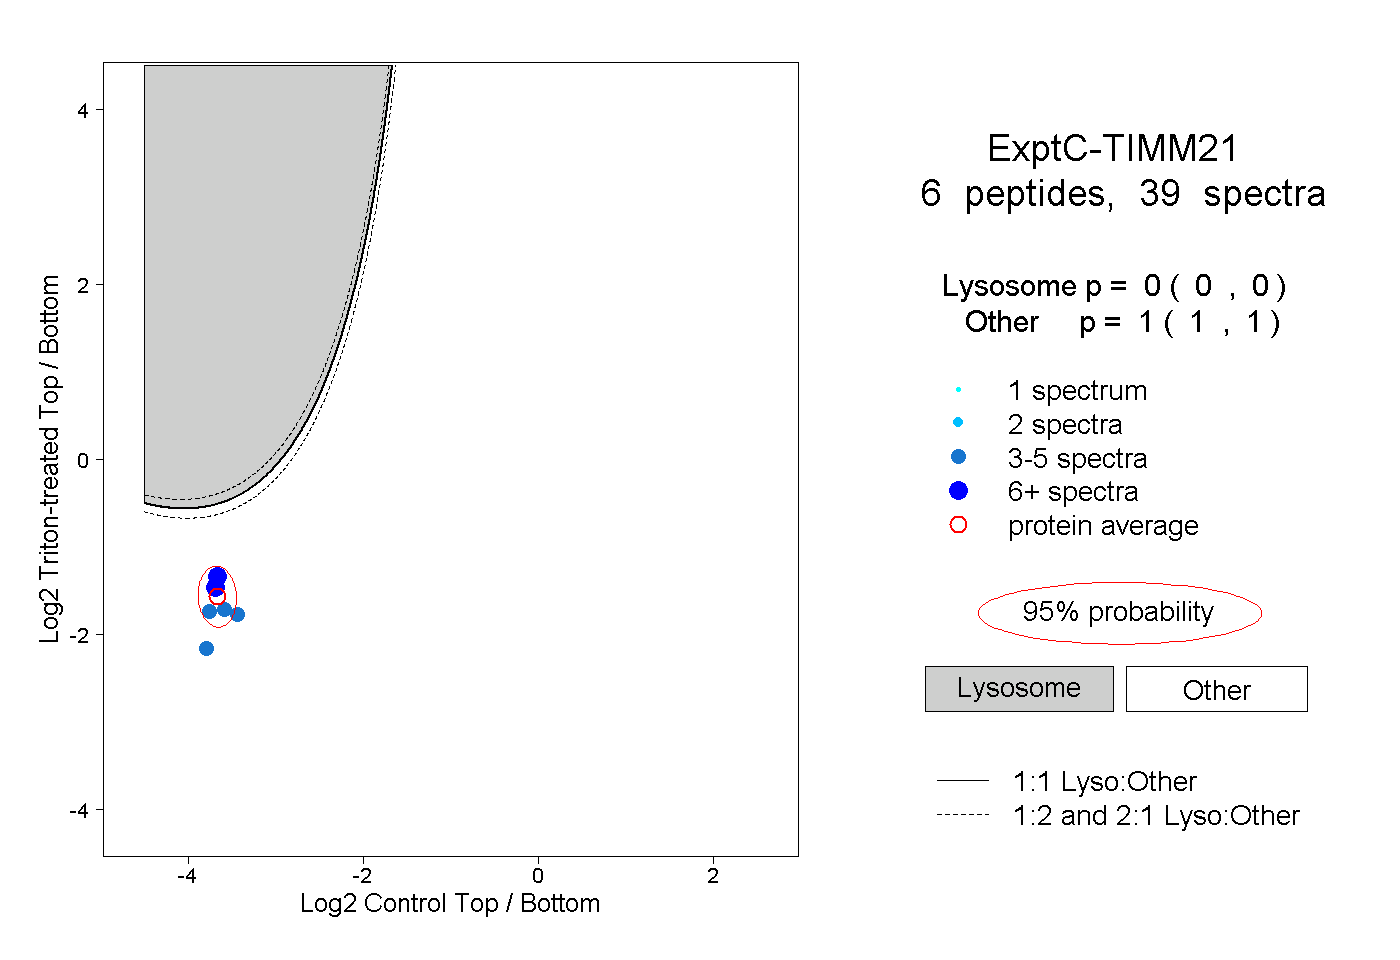 |
0.000 0.000 | 0.000 |
1.000 1.000 | 1.000 |
||||||||
| Plot | Lyso | Other | |||||||||||
| Expt D |
2 peptides |
3 spectra |
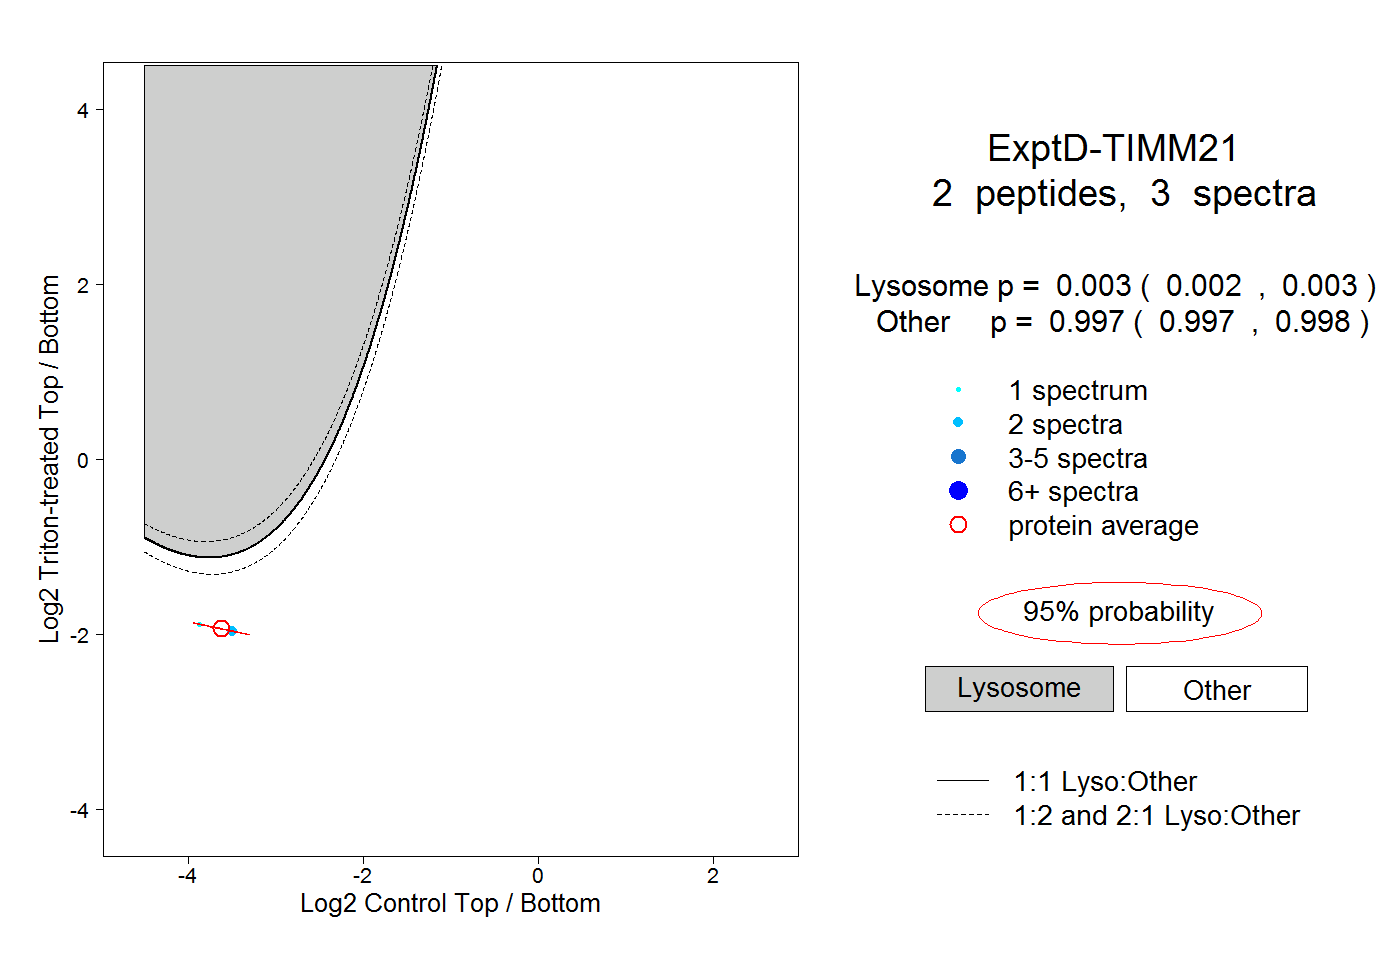 |
0.003 0.002 | 0.003 |
0.997 0.997 | 0.998 |