 8
8peptides
spectra
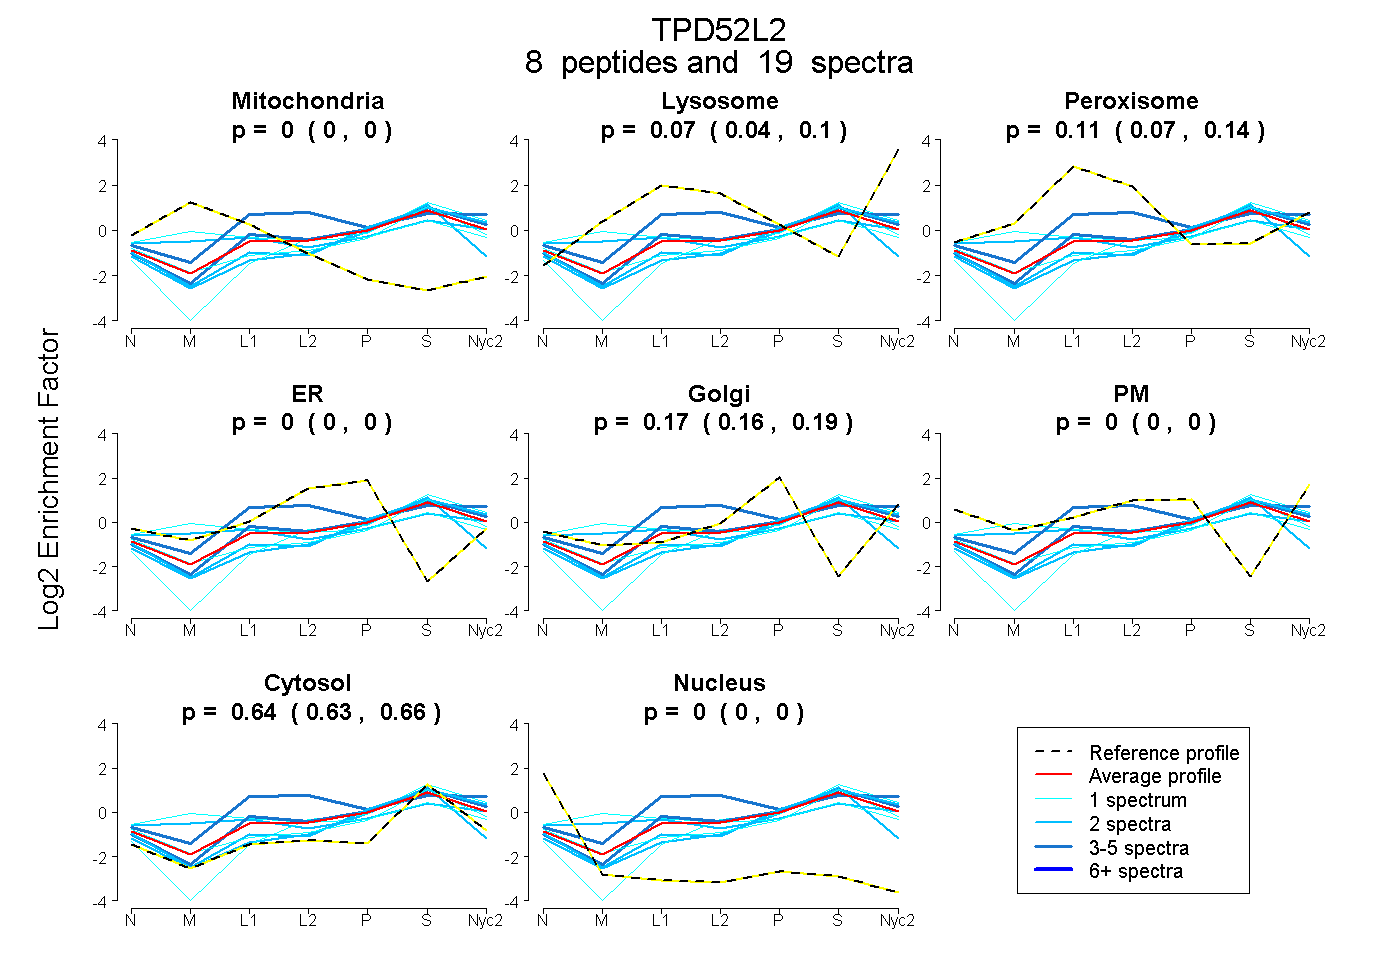
0.000 | 0.000
0.037 | 0.096
0.074 | 0.144
0.000 | 0.000
0.158 | 0.186
0.000 | 0.000
0.627 | 0.659
0.000 | 0.000
3peptides
spectra
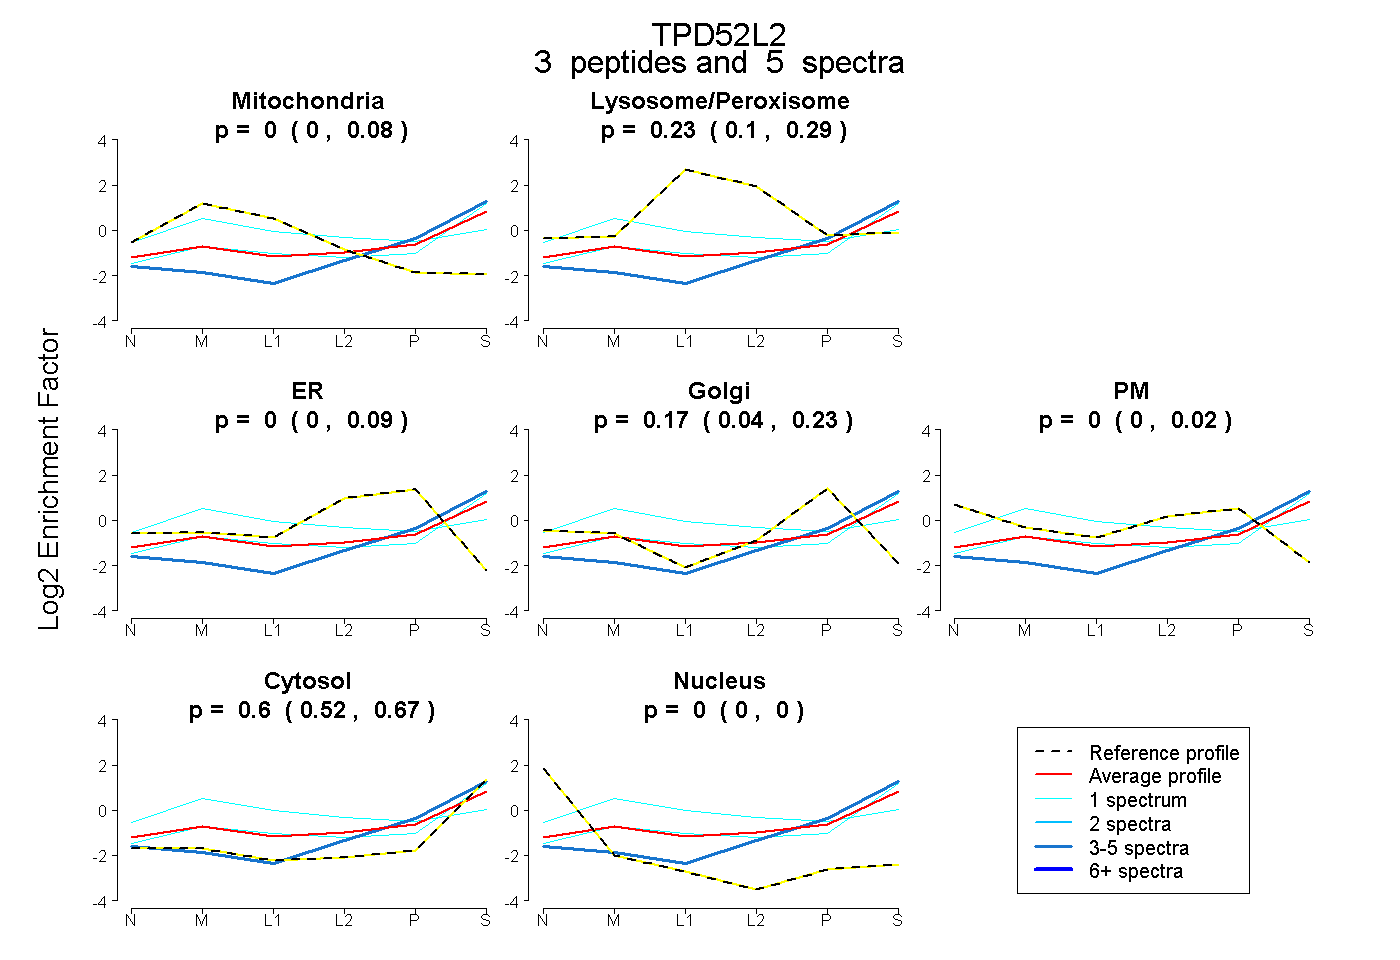
0.000 | 0.082
0.103 | 0.290
0.000 | 0.095
0.040 | 0.232
0.000 | 0.016
0.524 | 0.668
0.000 | 0.000
4peptides
spectra
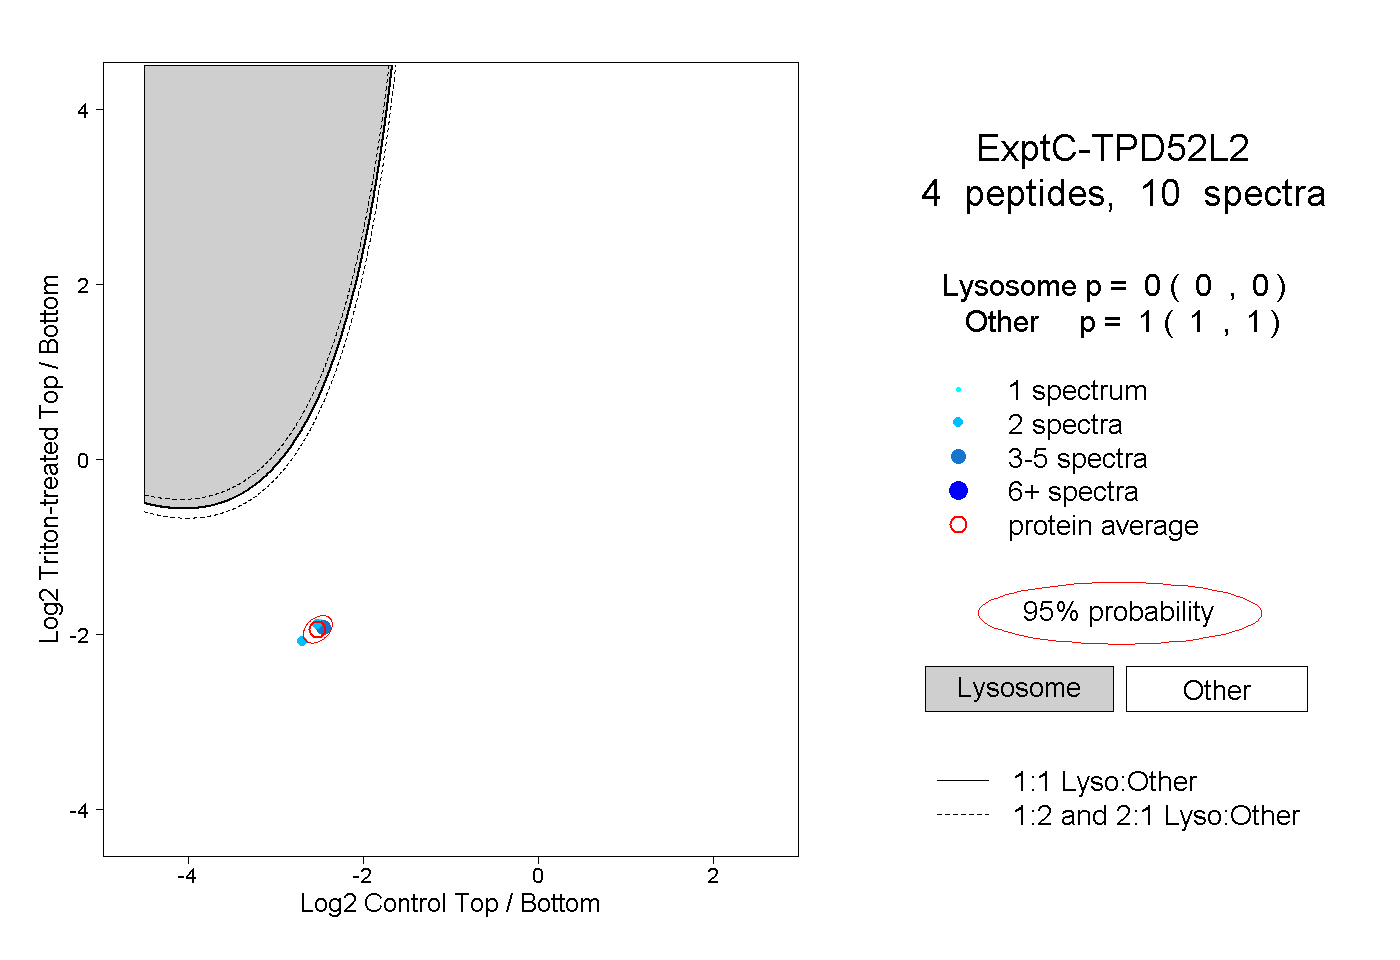
0.000 | 0.000
1.000 | 1.000
1peptide
spectra
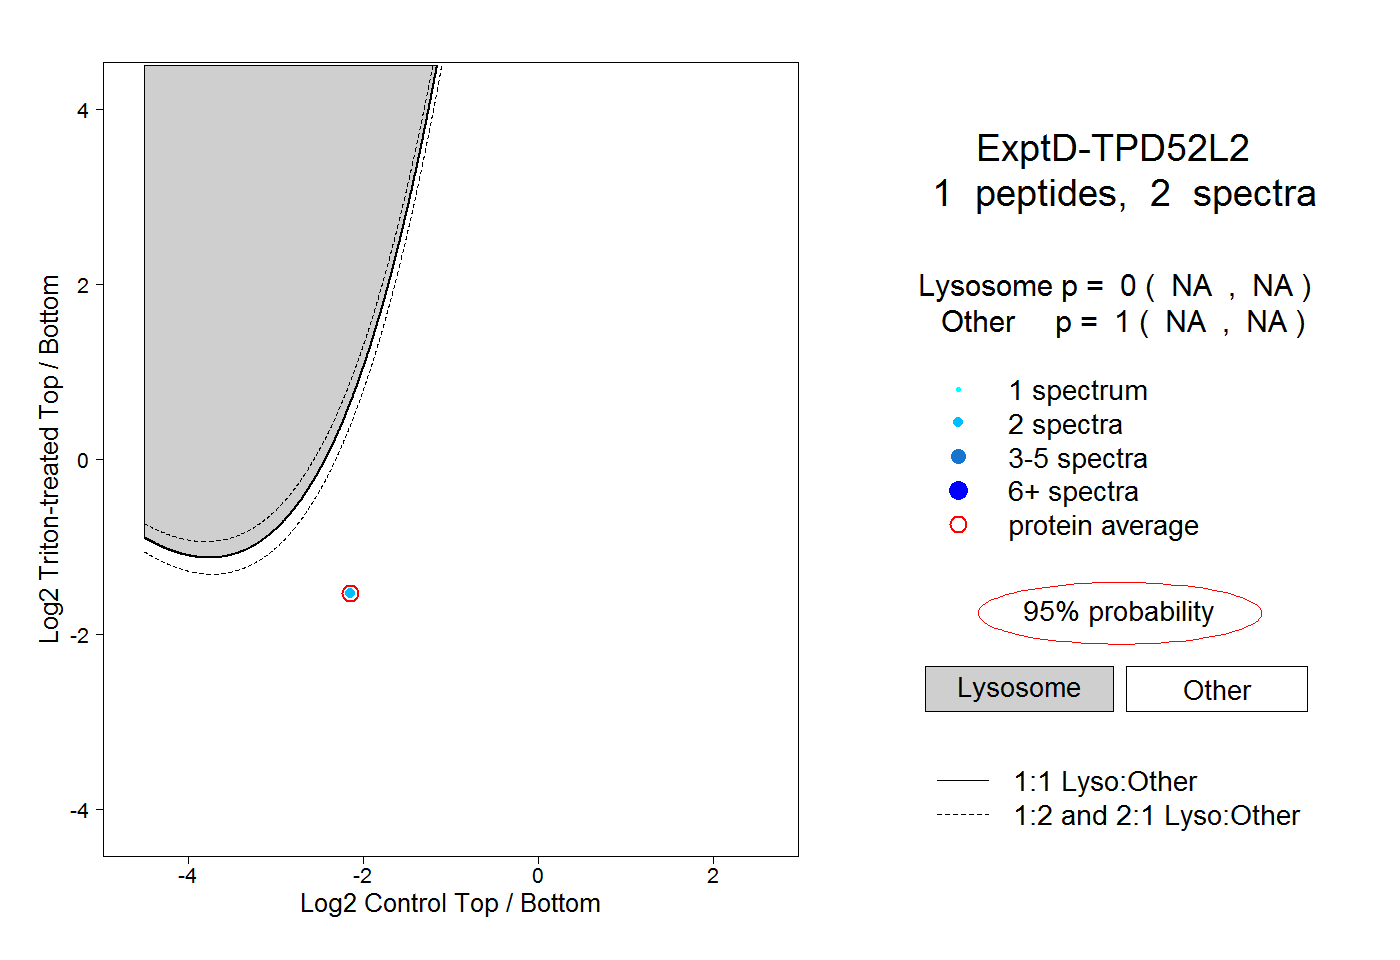
NA | NA
NA | NA