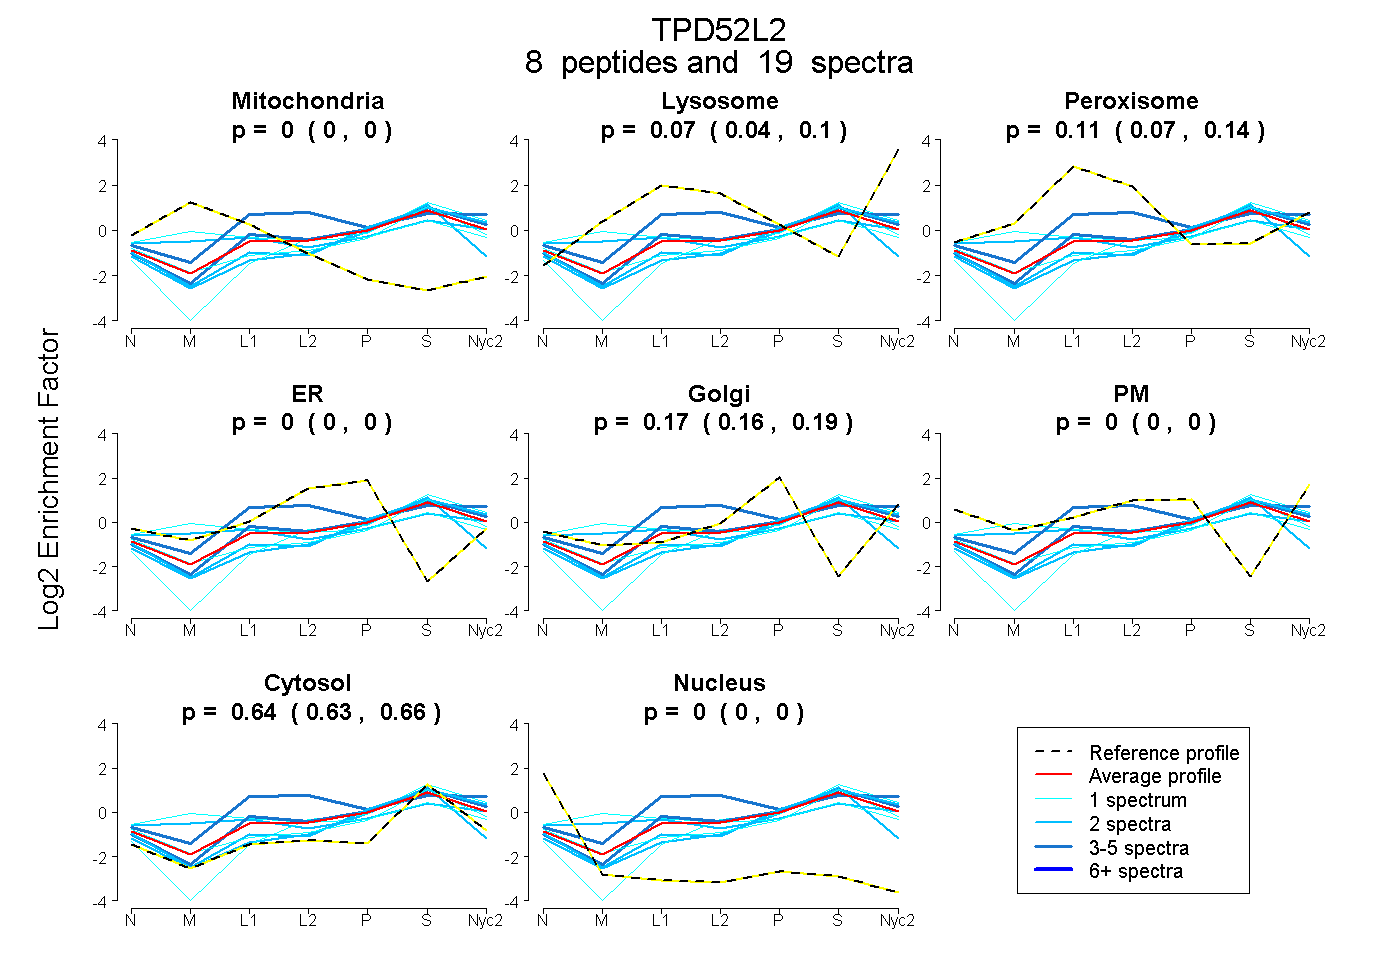
 8
8peptides
spectra
0.000 | 0.000
0.037 | 0.096
0.074 | 0.144
0.000 | 0.000
0.158 | 0.186
0.000 | 0.000
0.627 | 0.659
0.000 | 0.000
| Plot | Mito | Lyso | Perox | ER | Golgi | PM | Cytosol | Nucleus | |||||
| Expt A |
8 peptides |
19 spectra |
|
0.000 0.000 | 0.000 |
0.070 0.037 | 0.096 |
0.112 0.074 | 0.144 |
0.000 0.000 | 0.000 |
0.174 0.158 | 0.186 |
0.000 0.000 | 0.000 |
0.645 0.627 | 0.659 |
0.000 0.000 | 0.000 |
| 2 spectra, VEEEIVTLR | 0.000 | 0.072 | 0.000 | 0.000 | 0.201 | 0.000 | 0.726 | 0.000 | ||
| 5 spectra, TSAALSTMGSAISR | 0.000 | 0.146 | 0.069 | 0.000 | 0.112 | 0.000 | 0.673 | 0.000 | ||
| 2 spectra, HCGELK | 0.000 | 0.000 | 0.000 | 0.113 | 0.037 | 0.000 | 0.850 | 0.000 | ||
| 2 spectra, GVLSDFMTDVPVDPGVVHR | 0.109 | 0.101 | 0.116 | 0.000 | 0.126 | 0.043 | 0.504 | 0.000 | ||
| 5 spectra, TQETLSQAGQK | 0.000 | 0.189 | 0.295 | 0.087 | 0.000 | 0.000 | 0.429 | 0.000 | ||
| 1 spectrum, LGLSTLGELK | 0.000 | 0.031 | 0.000 | 0.000 | 0.138 | 0.000 | 0.831 | 0.000 | ||
| 1 spectrum, QVLAAK | 0.150 | 0.013 | 0.245 | 0.000 | 0.146 | 0.000 | 0.445 | 0.000 | ||
| 1 spectrum, VTQSDLYK | 0.000 | 0.029 | 0.000 | 0.000 | 0.075 | 0.123 | 0.773 | 0.000 |
| Plot | Mito | Lyso or Perox | ER | Golgi | PM | Cytosol | Nucleus | ||||||
| Expt B |
3 peptides |
5 spectra |
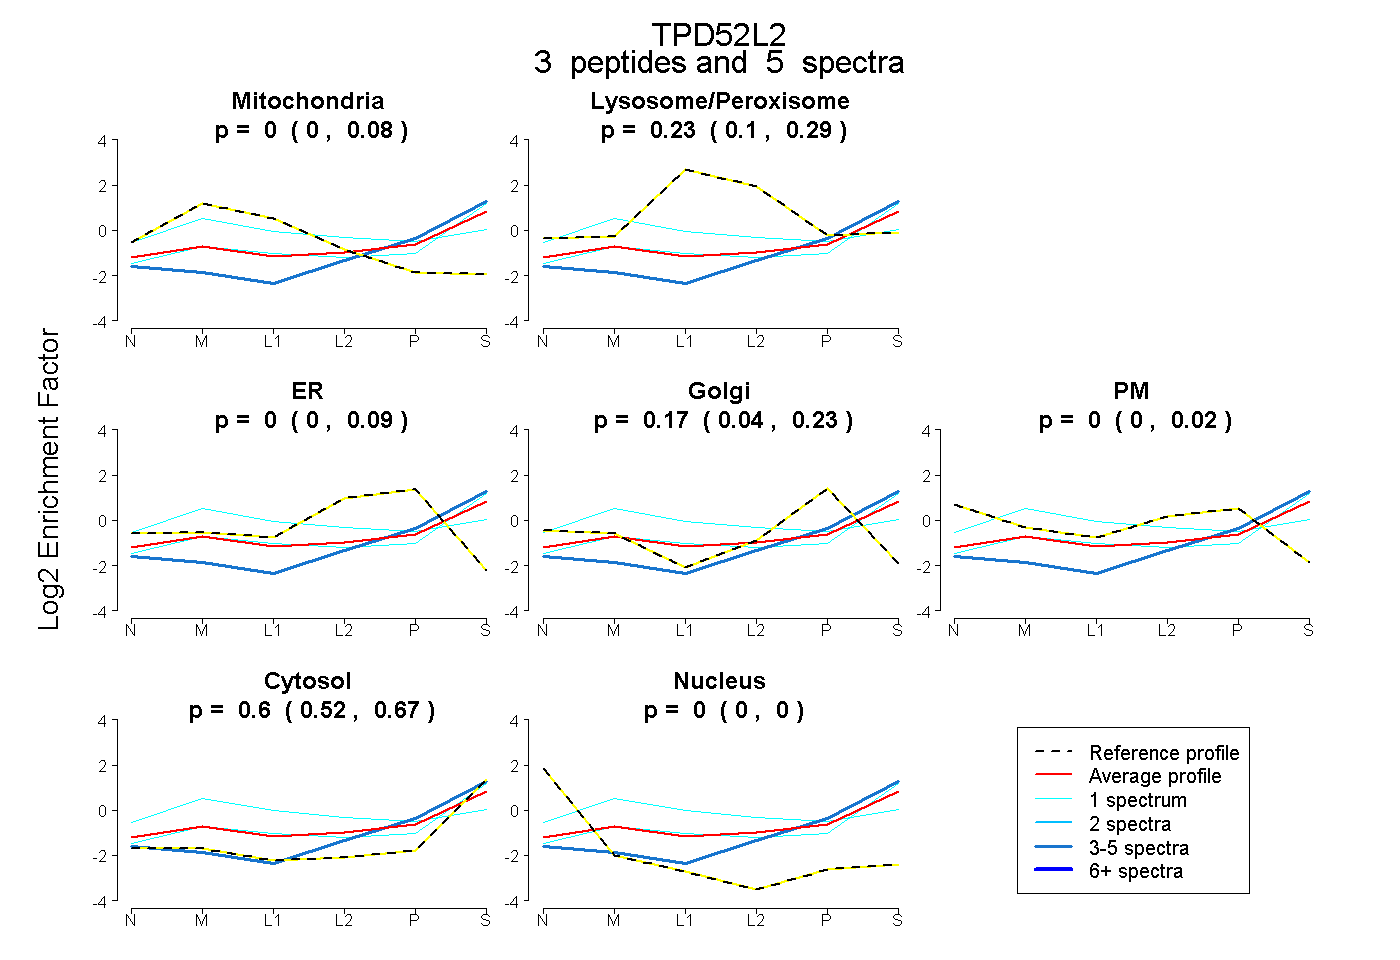 |
0.000 0.000 | 0.082 |
0.227 0.103 | 0.290 |
0.000 0.000 | 0.095 |
0.173 0.040 | 0.232 |
0.000 0.000 | 0.016 |
0.600 0.524 | 0.668 |
0.000 0.000 | 0.000 |
|||
| Plot | Lyso | Other | |||||||||||
| Expt C |
4 peptides |
10 spectra |
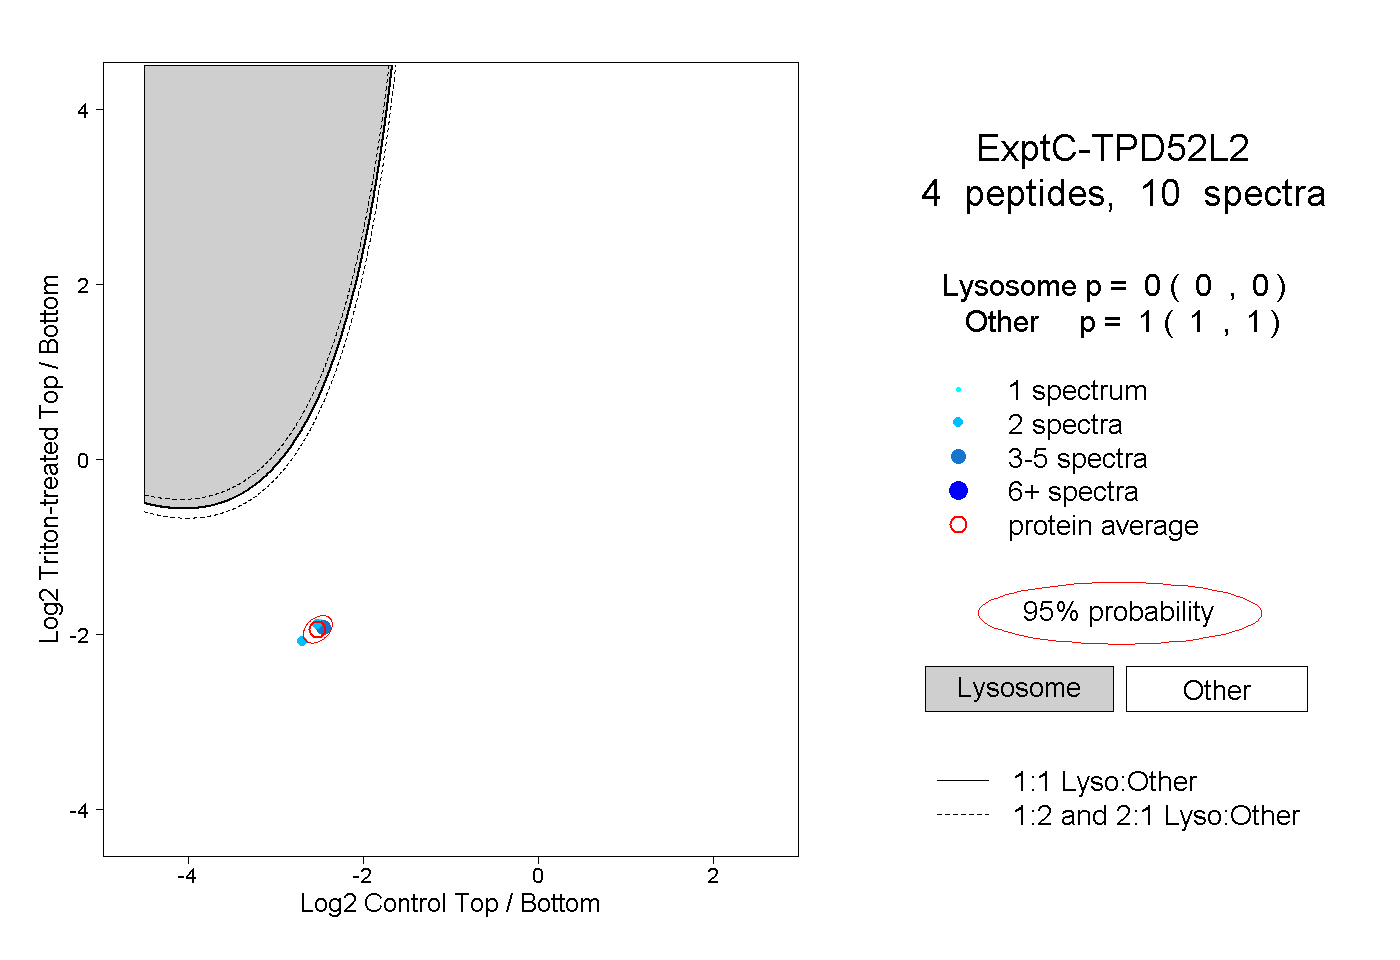 |
0.000 0.000 | 0.000 |
1.000 1.000 | 1.000 |
||||||||
| Plot | Lyso | Other | |||||||||||
| Expt D |
1 peptide |
2 spectra |
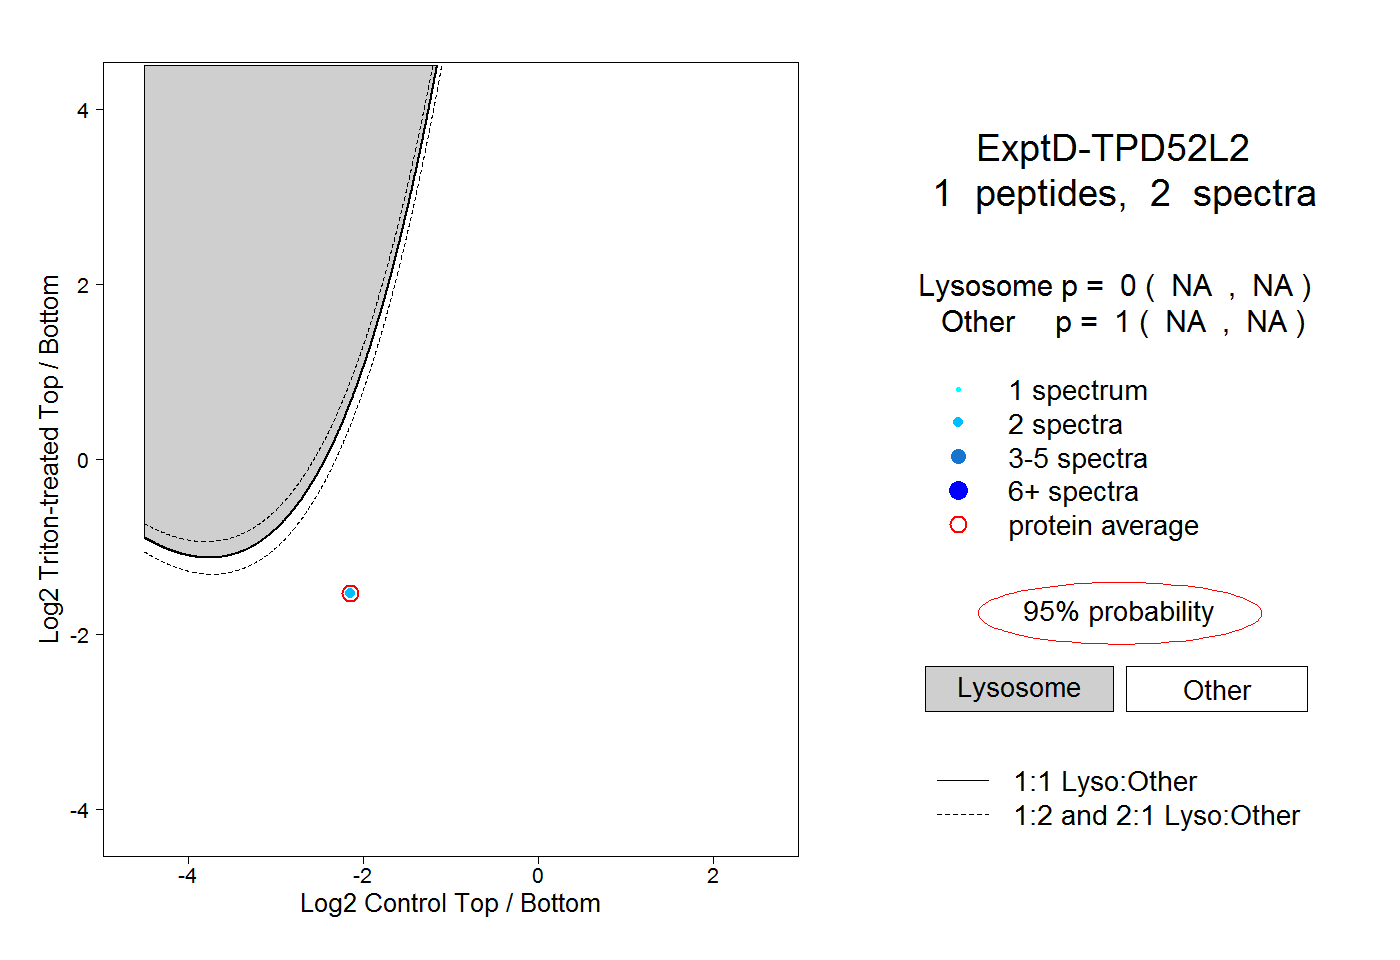 |
0.000 NA | NA |
1.000 NA | NA |