 5
5peptides
spectra
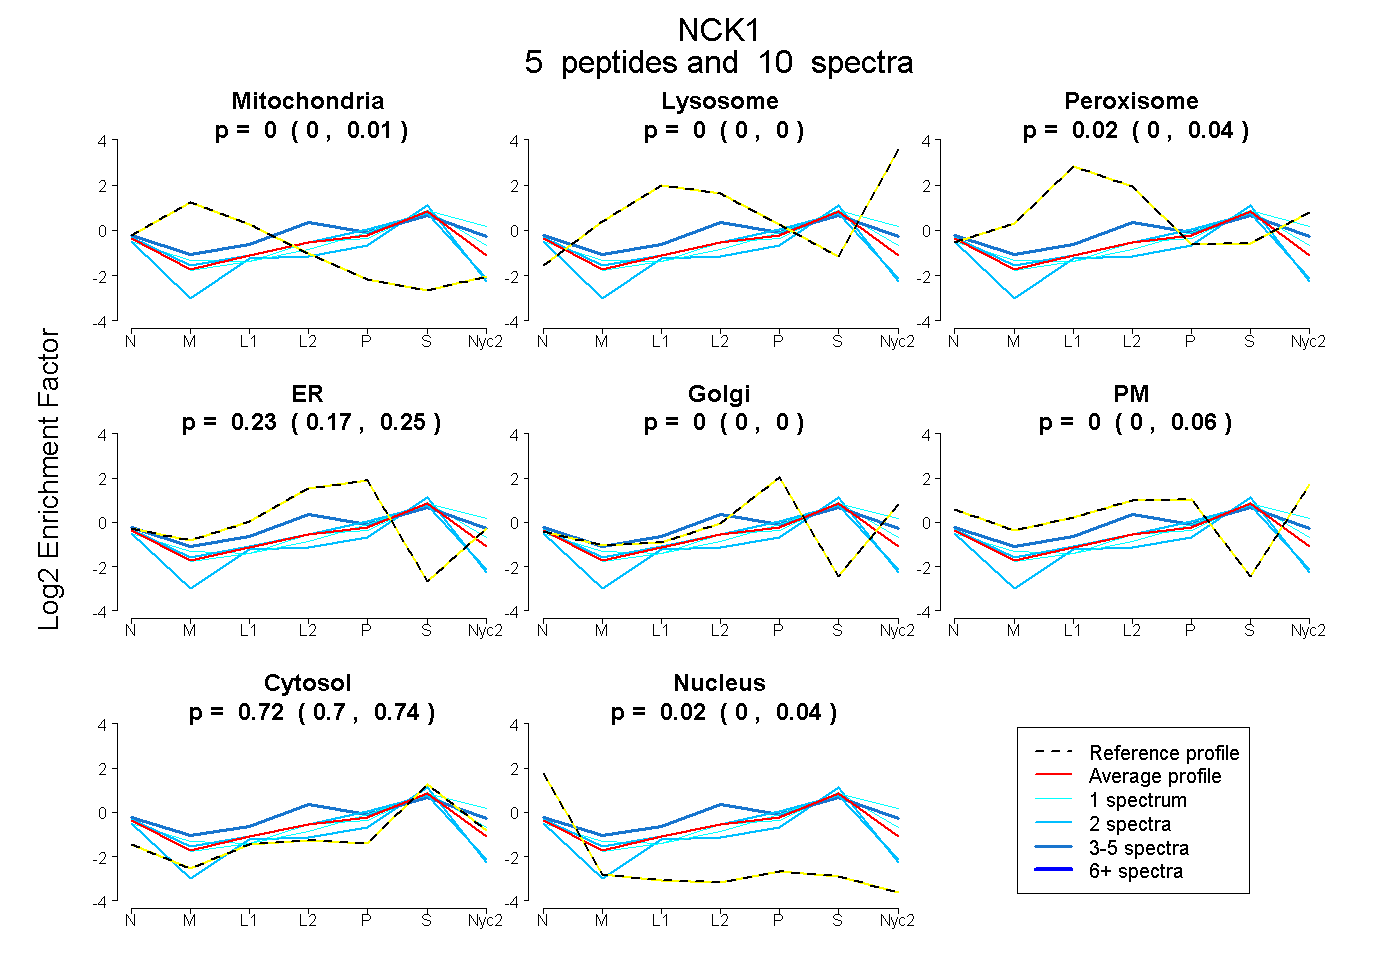
0.000 | 0.008
0.000 | 0.000
0.000 | 0.042
0.173 | 0.252
0.000 | 0.000
0.000 | 0.058
0.699 | 0.740
0.000 | 0.042
1peptide
spectrum
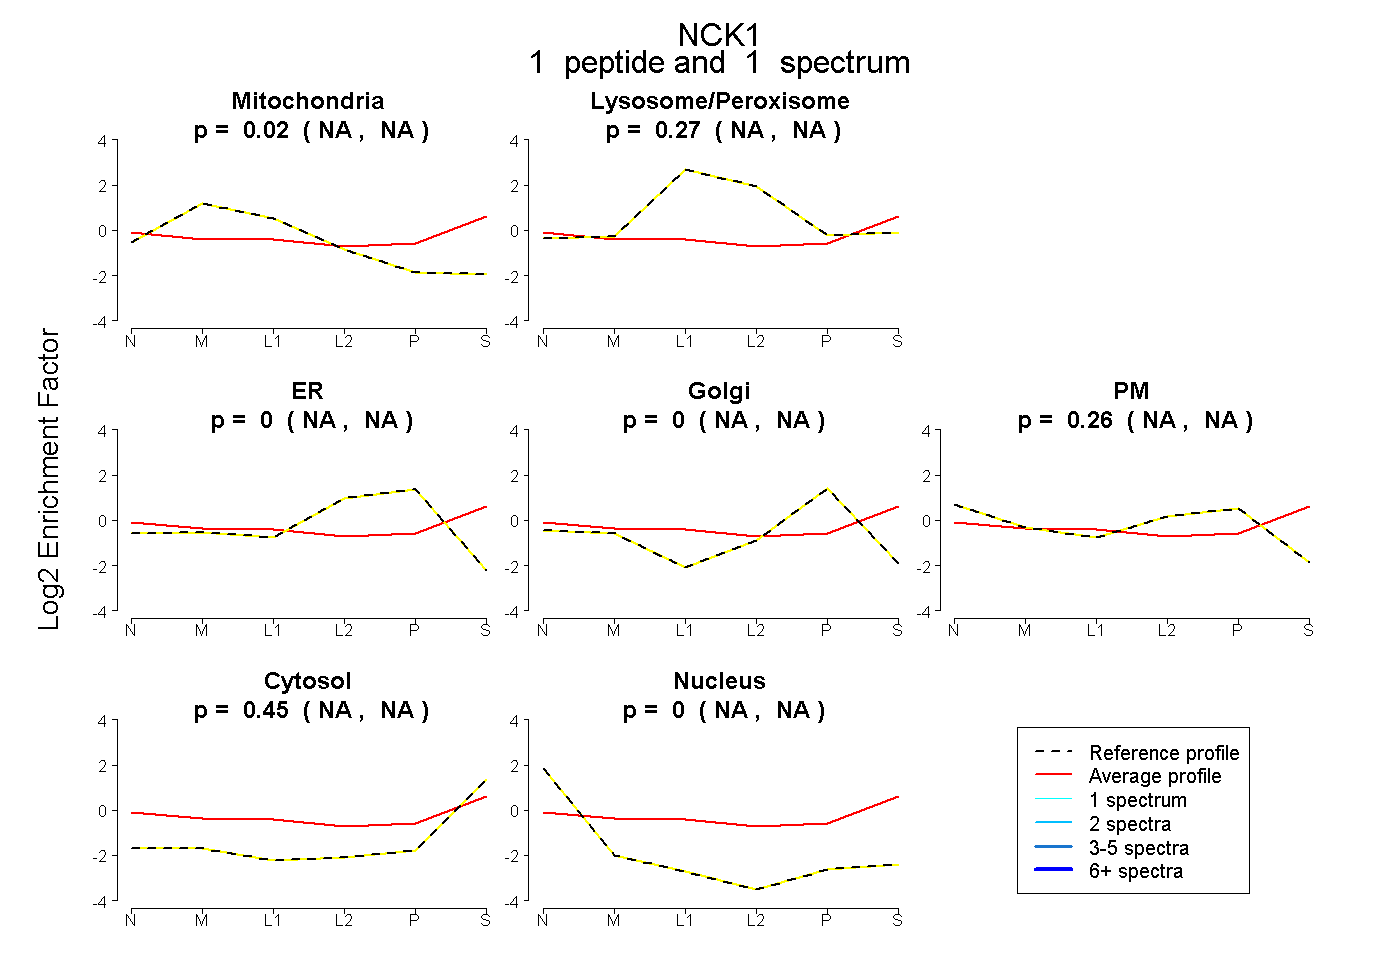
NA | NA
NA | NA
NA | NA
NA | NA
NA | NA
NA | NA
NA | NA
4peptides
spectra
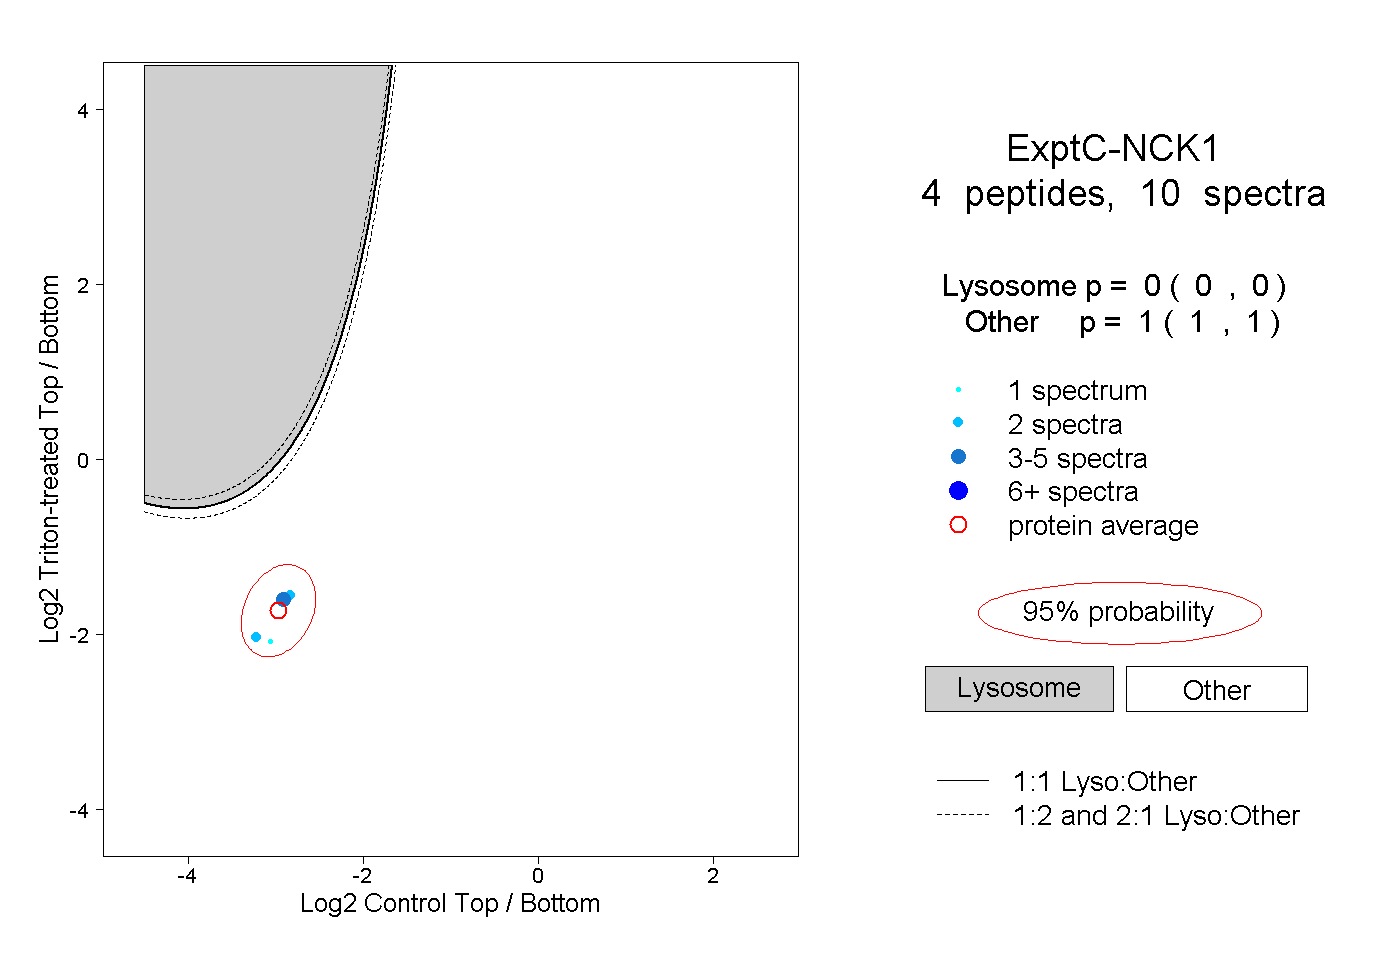
0.000 | 0.000
1.000 | 1.000