 26
26peptides
spectra
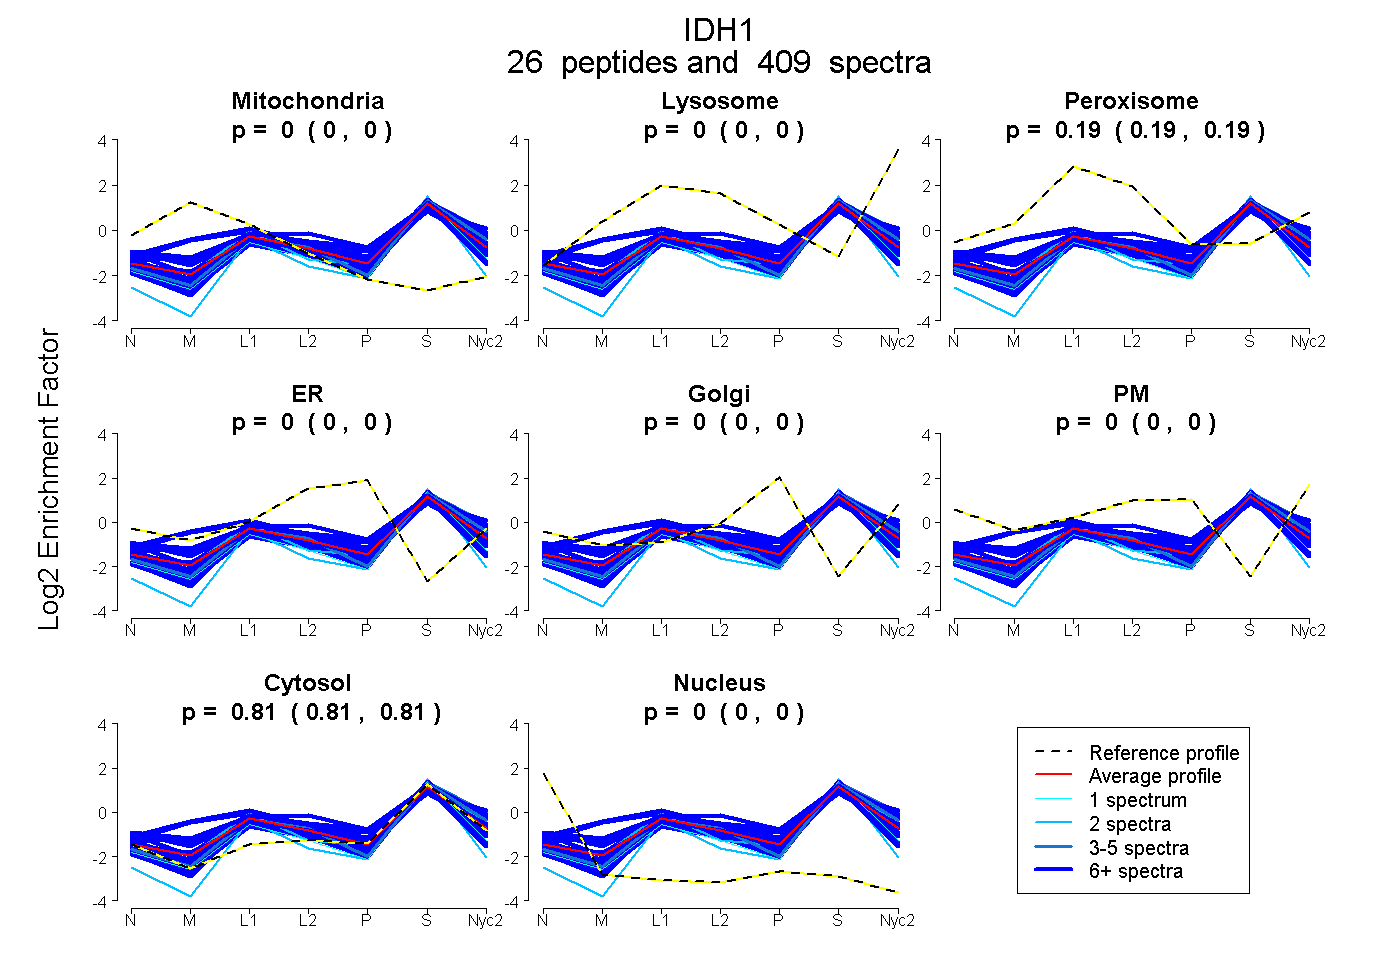
0.000 | 0.000
0.000 | 0.000
0.188 | 0.190
0.000 | 0.000
0.000 | 0.000
0.000 | 0.000
0.810 | 0.812
0.000 | 0.000
16peptides
spectra
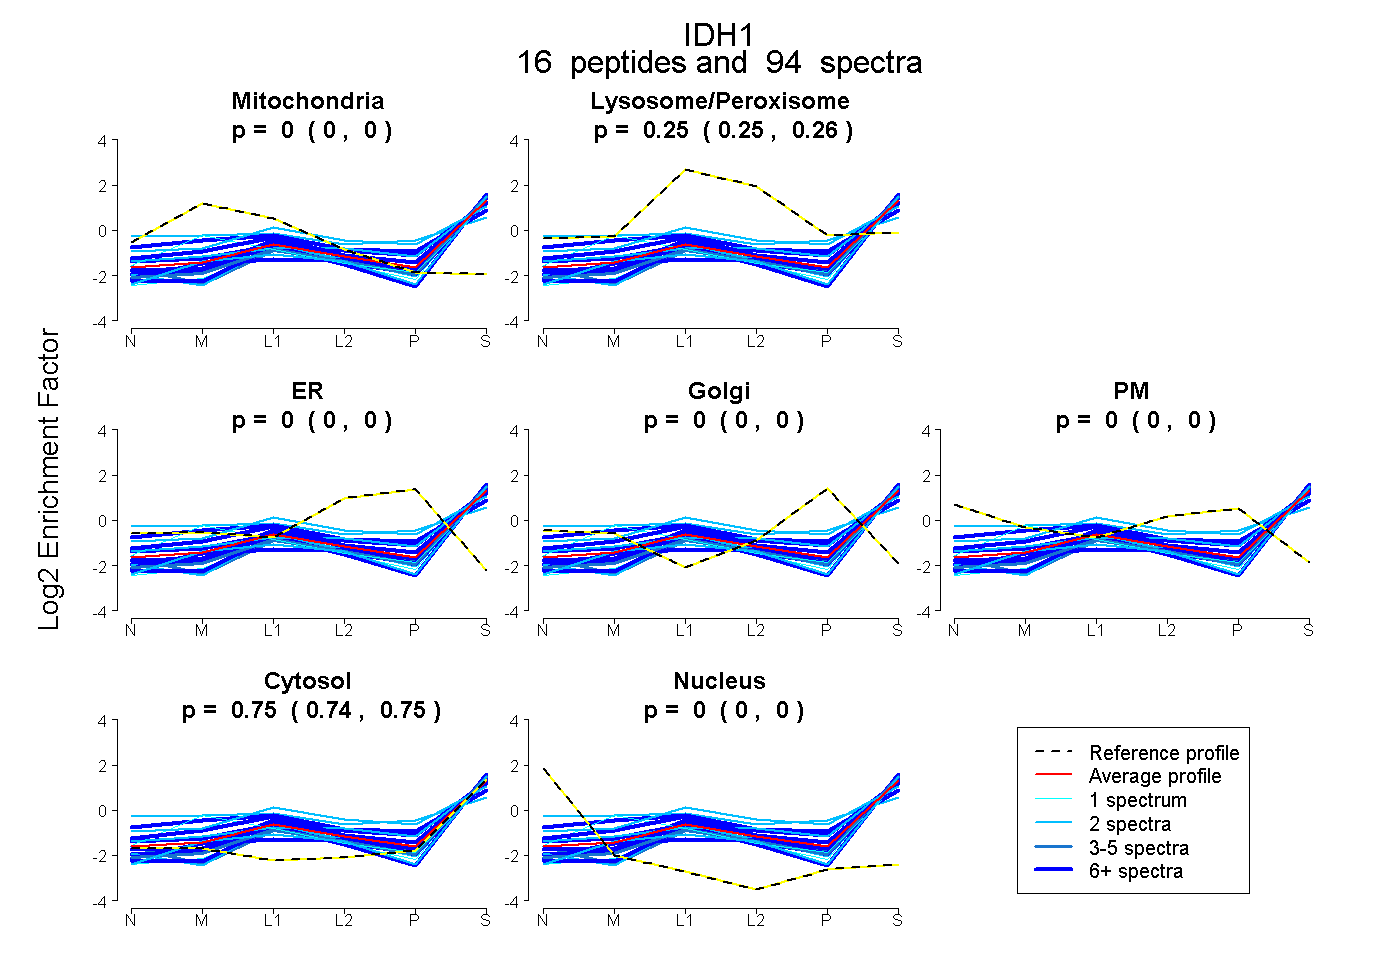
0.000 | 0.000
0.250 | 0.255
0.000 | 0.000
0.000 | 0.000
0.000 | 0.000
0.744 | 0.749
0.000 | 0.000
28peptides
spectra
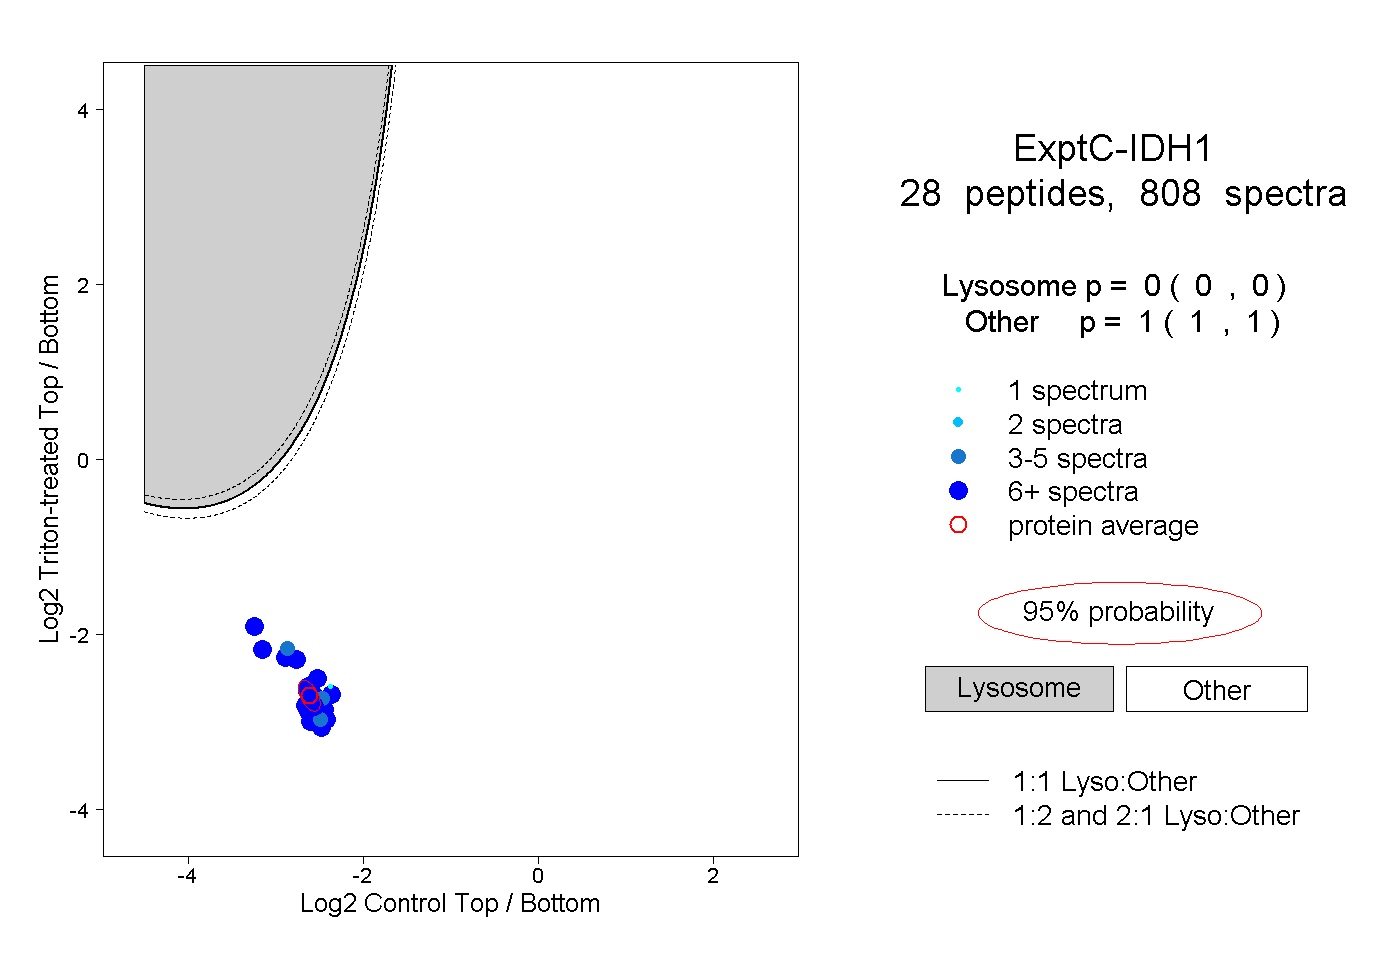
0.000 | 0.000
1.000 | 1.000
19peptides
spectra
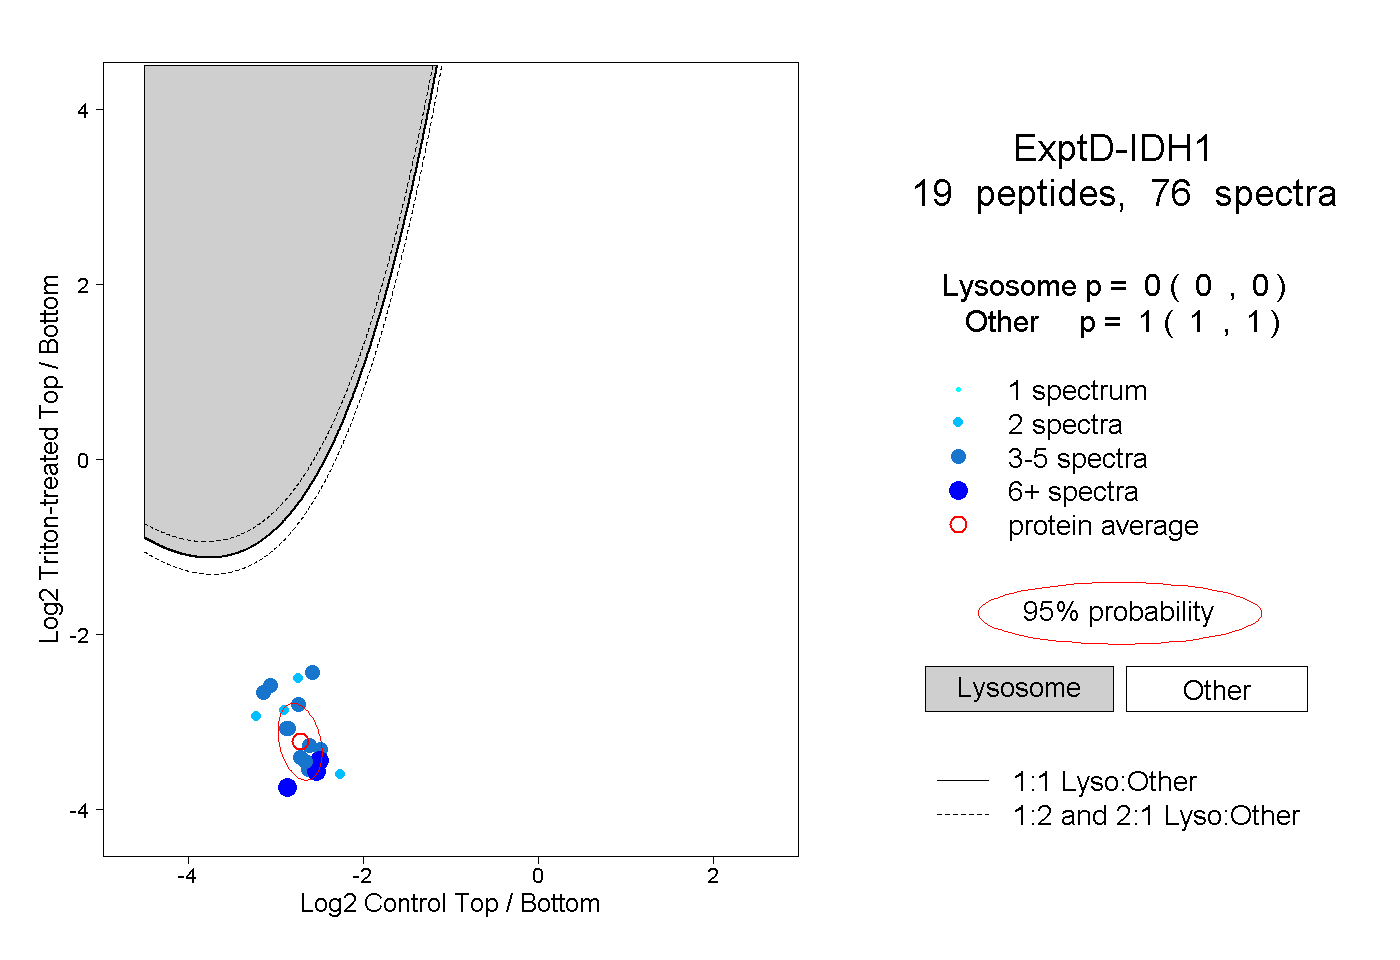
0.000 | 0.000
1.000 | 1.000