 7
7peptides
spectra
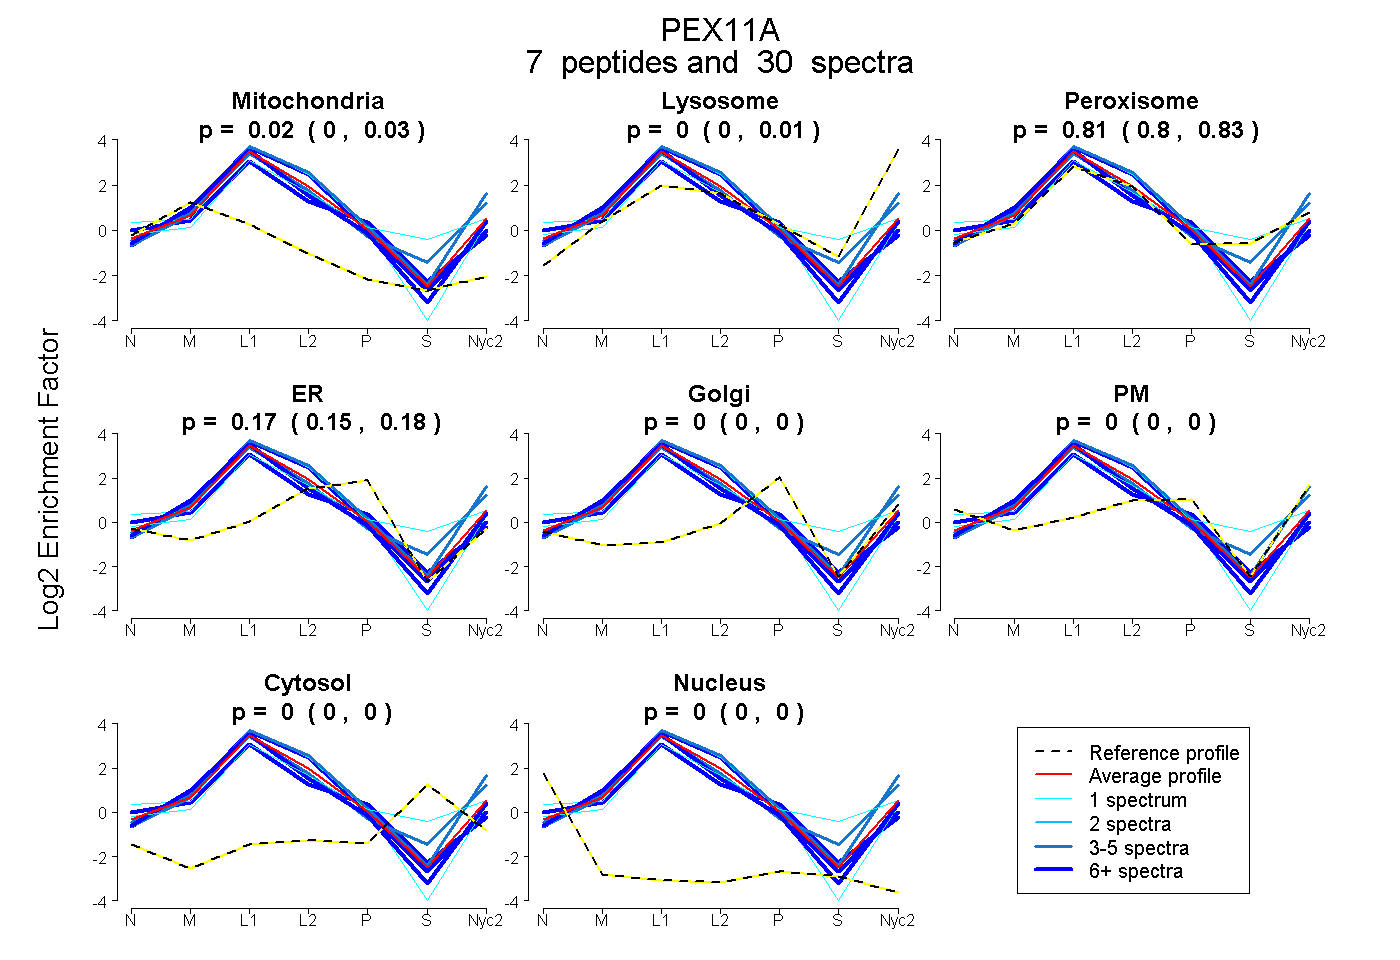
0.003 | 0.029
0.000 | 0.008
0.796 | 0.828
0.154 | 0.176
0.000 | 0.000
0.000 | 0.000
0.000 | 0.000
0.000 | 0.000
6peptides
spectra
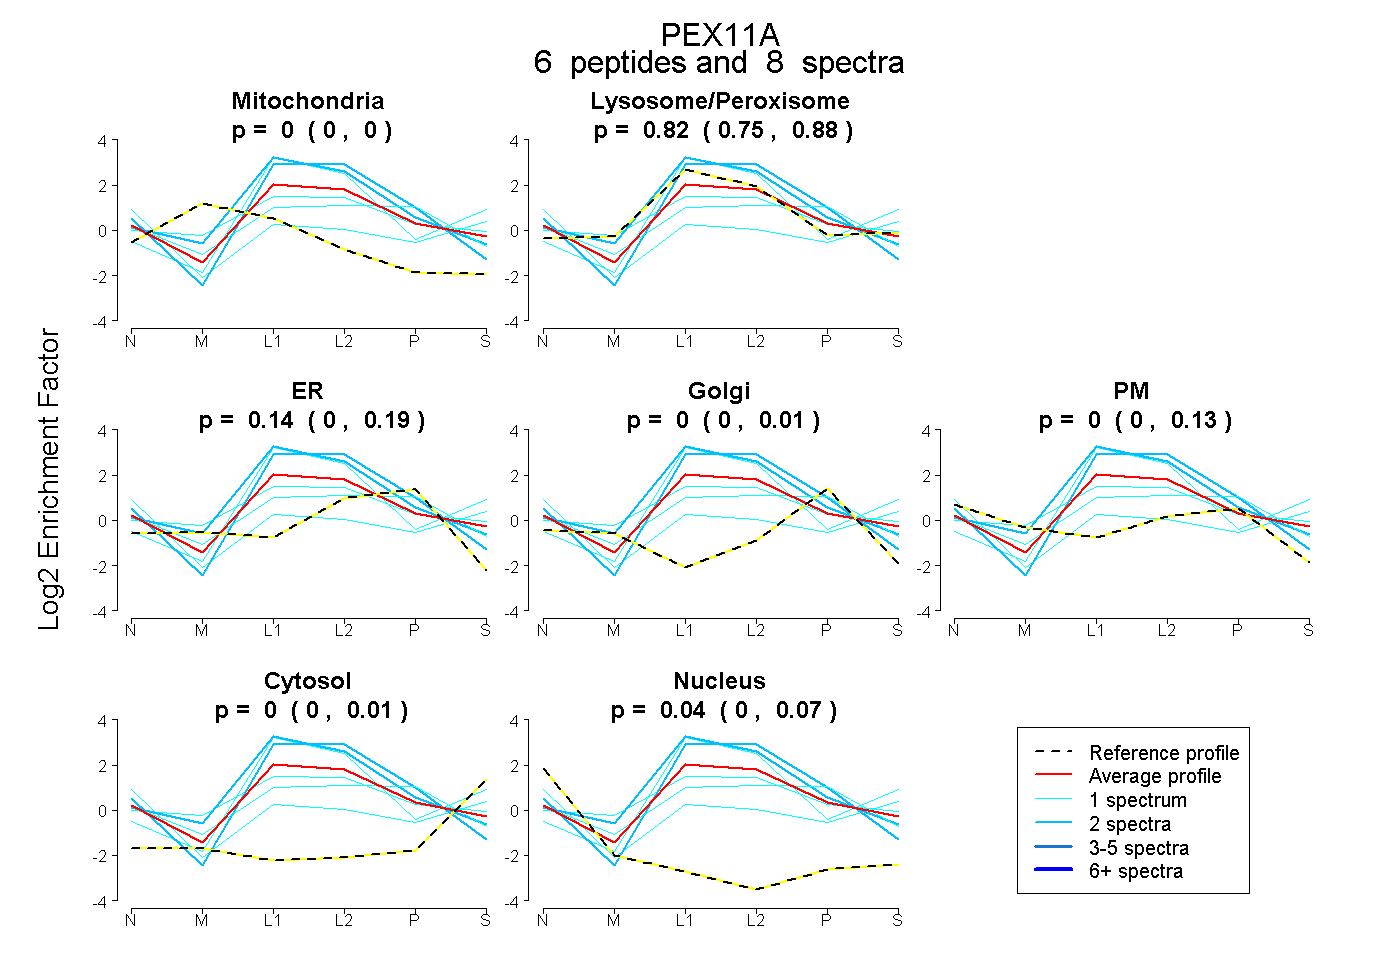
0.000 | 0.000
0.748 | 0.879
0.004 | 0.187
0.000 | 0.013
0.000 | 0.125
0.000 | 0.013
0.000 | 0.067
8peptides
spectra
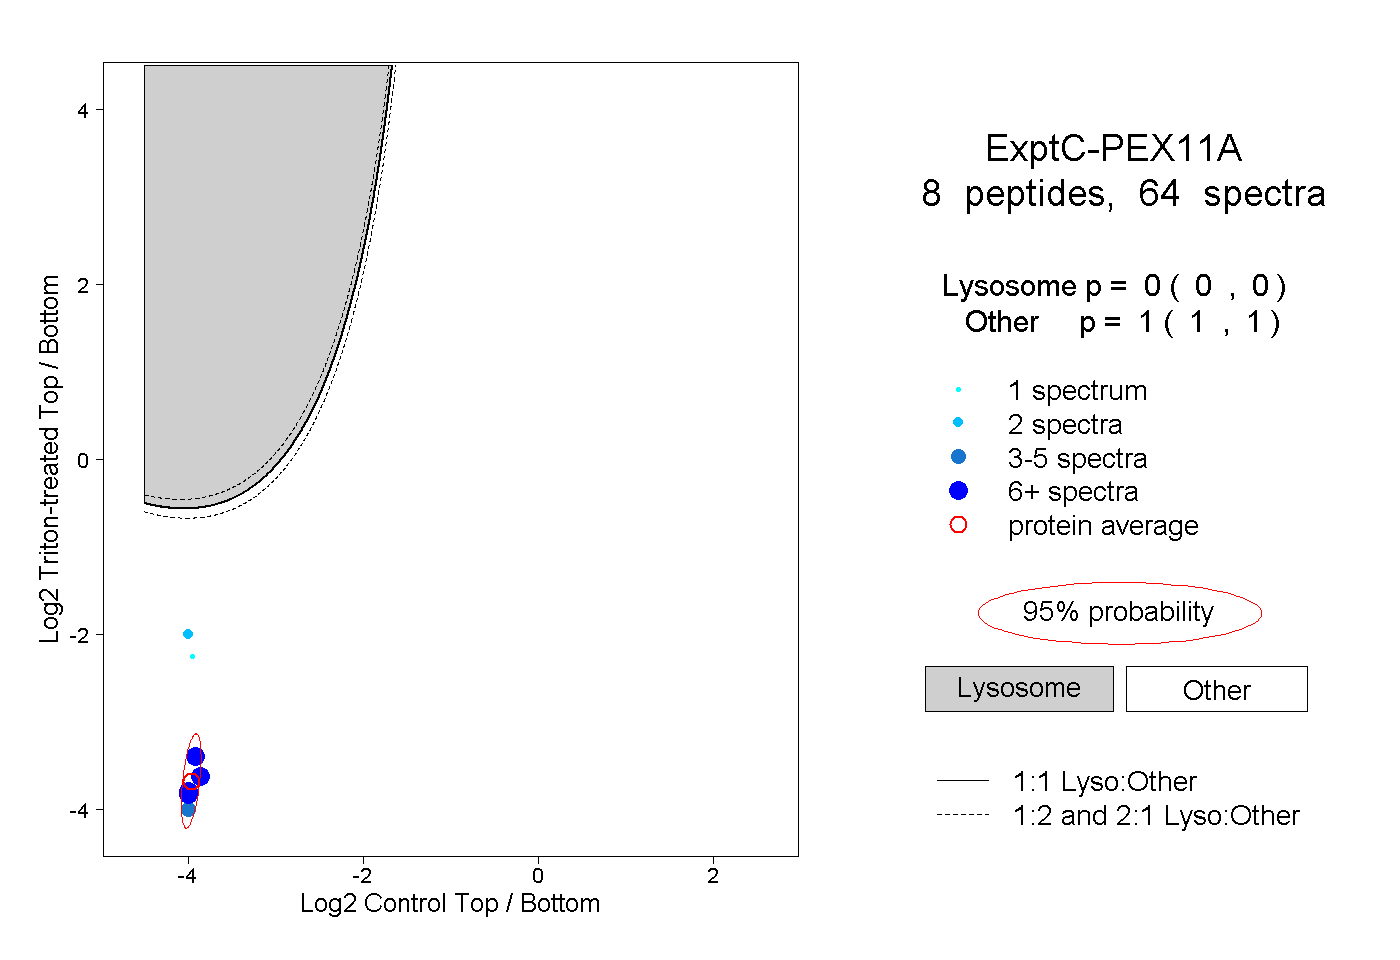
0.000 | 0.000
1.000 | 1.000
3peptides
spectra
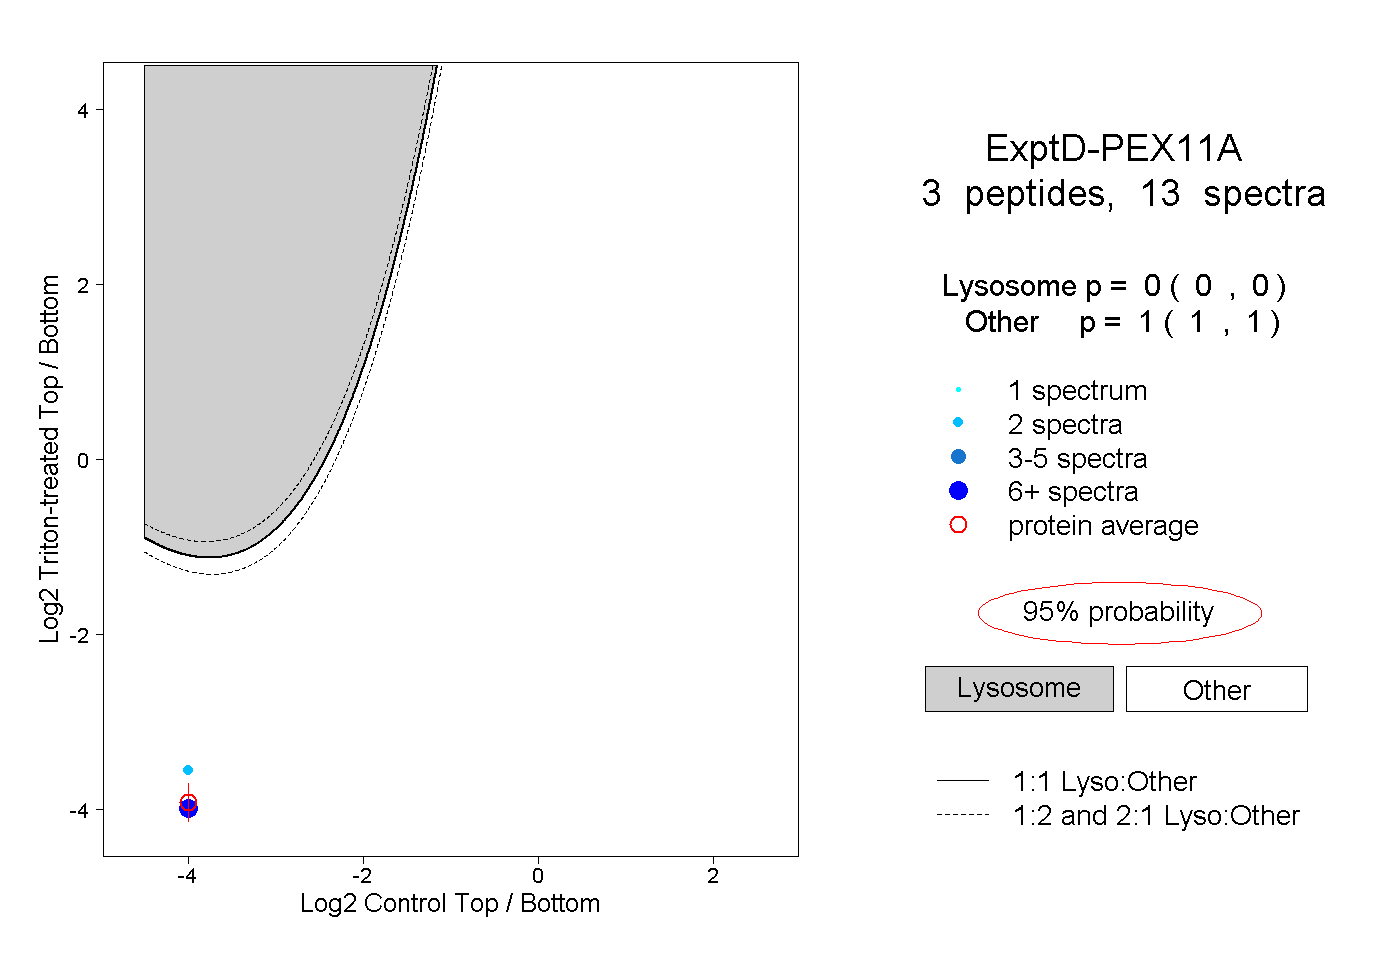
0.000 | 0.000
1.000 | 1.000