 7
7peptides
spectra
0.003 | 0.029
0.000 | 0.008
0.796 | 0.828
0.154 | 0.176
0.000 | 0.000
0.000 | 0.000
0.000 | 0.000
0.000 | 0.000
| Plot | Mito | Lyso | Perox | ER | Golgi | PM | Cytosol | Nucleus | |||||
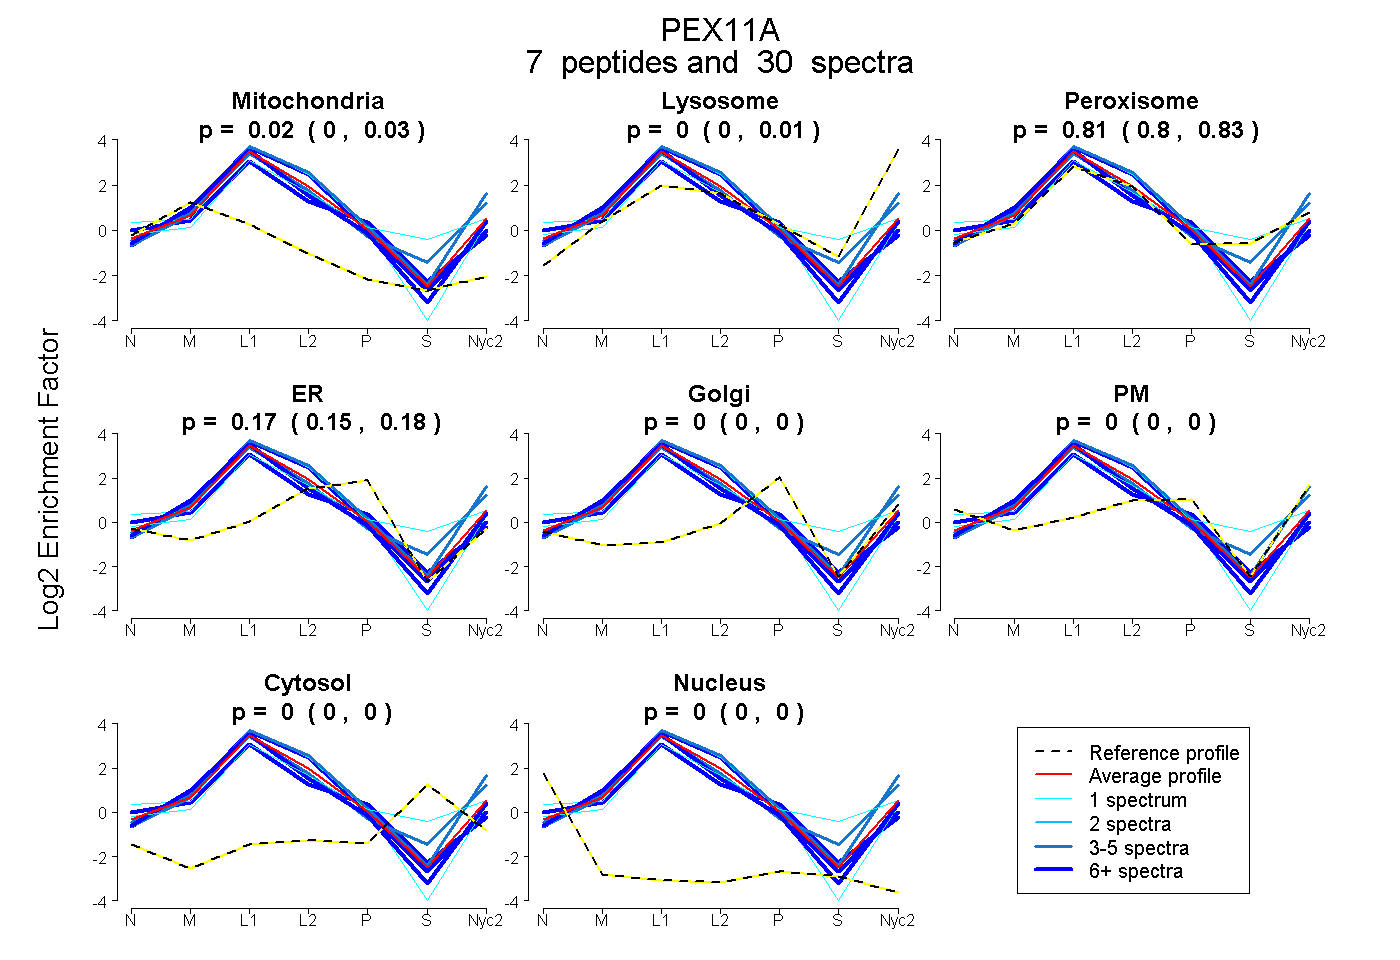
| Expt A |
7 peptides |
30 spectra |
|
0.018 0.003 | 0.029 |
0.000 0.000 | 0.008 |
0.814 0.796 | 0.828 |
0.168 0.154 | 0.176 |
0.000 0.000 | 0.000 |
0.000 0.000 | 0.000 |
0.000 0.000 | 0.000 |
0.000 0.000 | 0.000 |
| 6 spectra, ATQHACMLLR | 0.126 | 0.000 | 0.623 | 0.251 | 0.000 | 0.000 | 0.000 | 0.000 | ||
| 7 spectra, LCLTLANLNR | 0.025 | 0.000 | 0.824 | 0.152 | 0.000 | 0.000 | 0.000 | 0.000 | ||
| 7 spectra, VANQSQGR | 0.164 | 0.090 | 0.627 | 0.119 | 0.000 | 0.000 | 0.000 | 0.000 | ||
| 1 spectrum, VVYYICDTVLWAK | 0.000 | 0.000 | 0.935 | 0.065 | 0.000 | 0.000 | 0.000 | 0.000 | ||
| 3 spectra, NLETSVSTGR | 0.010 | 0.139 | 0.850 | 0.000 | 0.000 | 0.000 | 0.000 | 0.000 | ||
| 5 spectra, SVGLTSGINR | 0.000 | 0.300 | 0.657 | 0.043 | 0.000 | 0.000 | 0.000 | 0.000 | ||
| 1 spectrum, NPPLFLDTVK | 0.017 | 0.000 | 0.669 | 0.300 | 0.000 | 0.015 | 0.000 | 0.000 |
| Plot | Mito | Lyso or Perox | ER | Golgi | PM | Cytosol | Nucleus | ||||||
| Expt B |
6 peptides |
8 spectra |
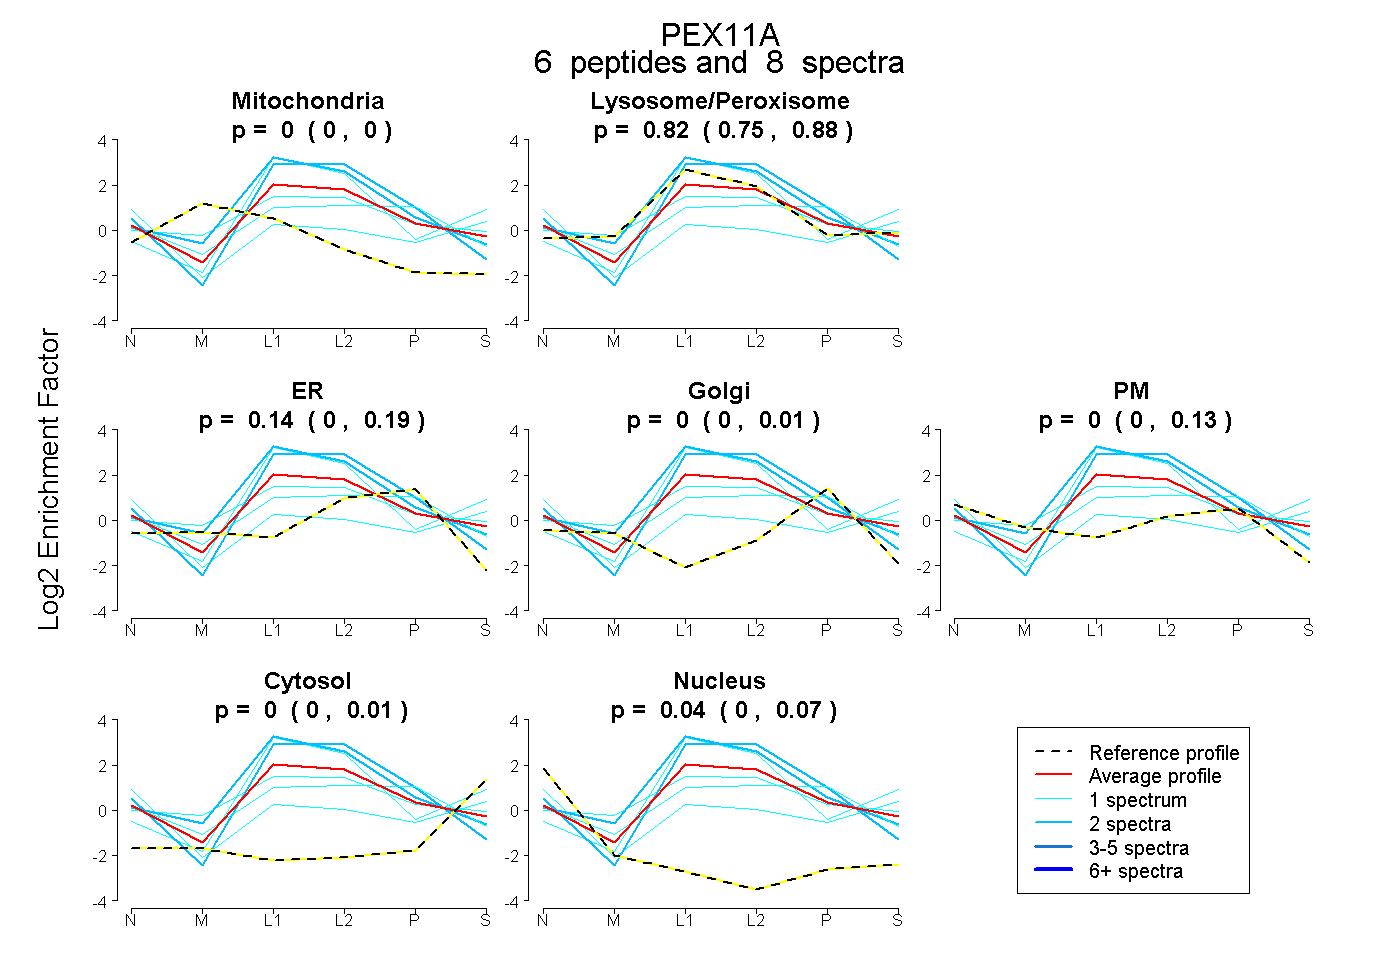 |
0.000 0.000 | 0.000 |
0.822 0.748 | 0.879 |
0.137 0.004 | 0.187 |
0.000 0.000 | 0.013 |
0.000 0.000 | 0.125 |
0.000 0.000 | 0.013 |
0.041 0.000 | 0.067 |
|||
| Plot | Lyso | Other | |||||||||||
| Expt C |
8 peptides |
64 spectra |
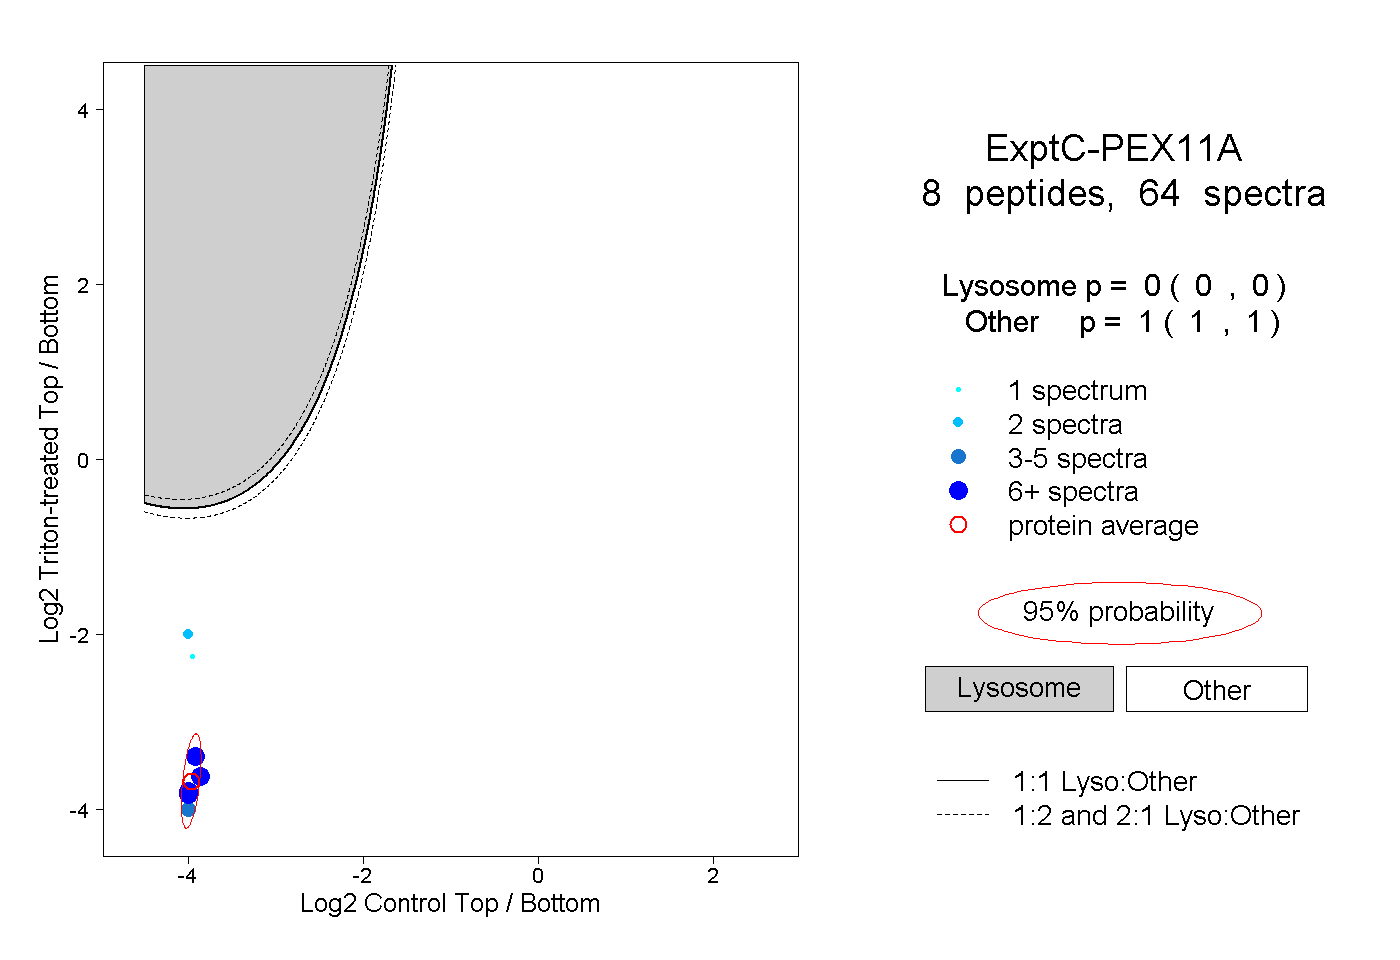 |
0.000 0.000 | 0.000 |
1.000 1.000 | 1.000 |
||||||||
| Plot | Lyso | Other | |||||||||||
| Expt D |
3 peptides |
13 spectra |
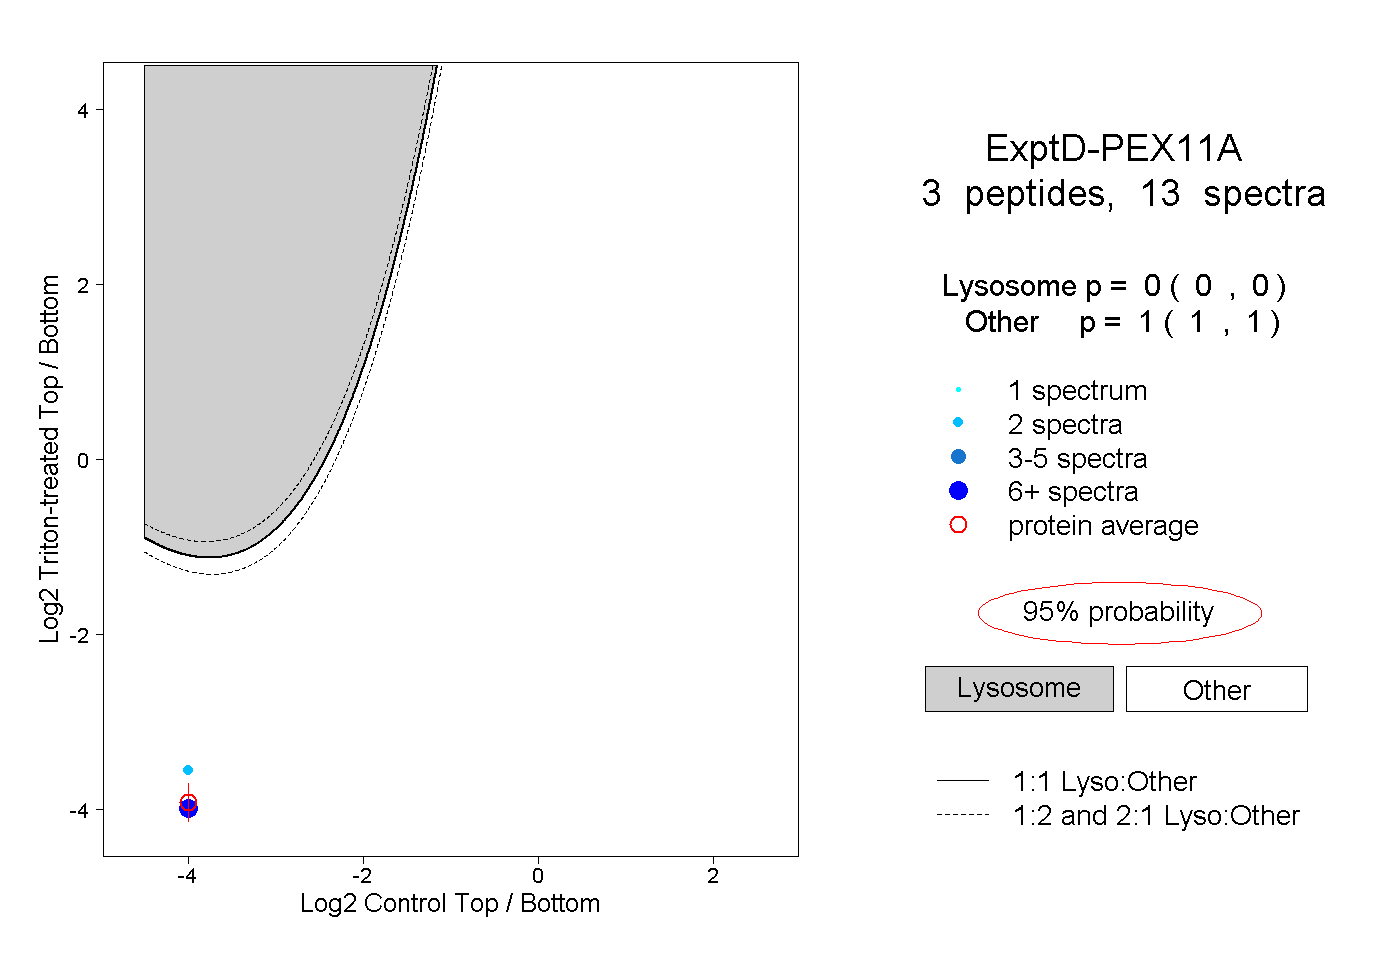 |
0.000 0.000 | 0.000 |
1.000 1.000 | 1.000 |