 8
8peptides
spectra
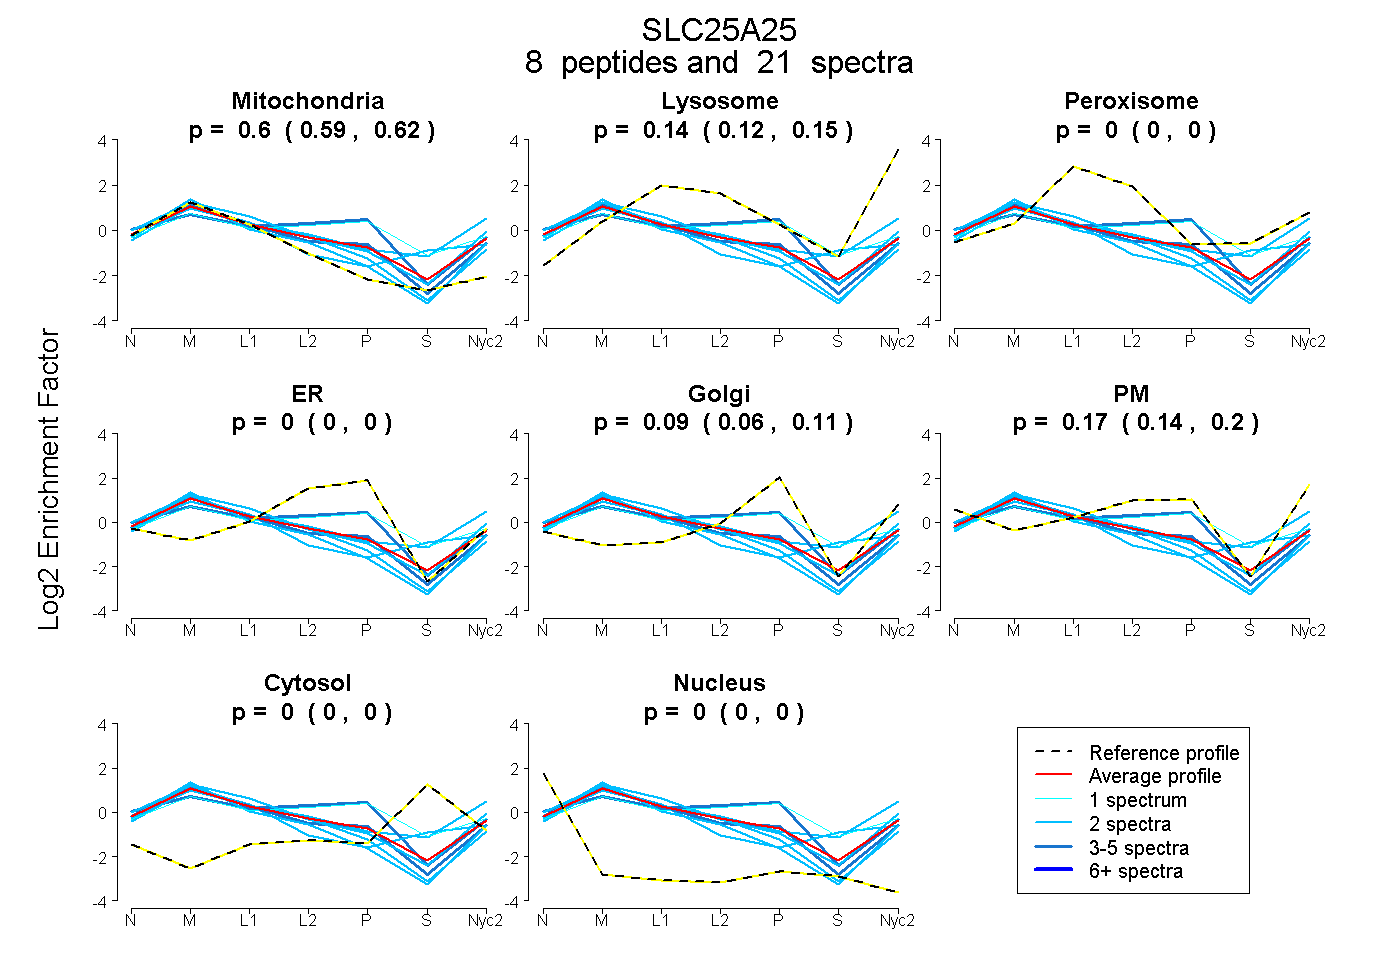
0.588 | 0.620
0.118 | 0.150
0.000 | 0.000
0.000 | 0.000
0.057 | 0.113
0.139 | 0.200
0.000 | 0.000
0.000 | 0.000
4peptides
spectra
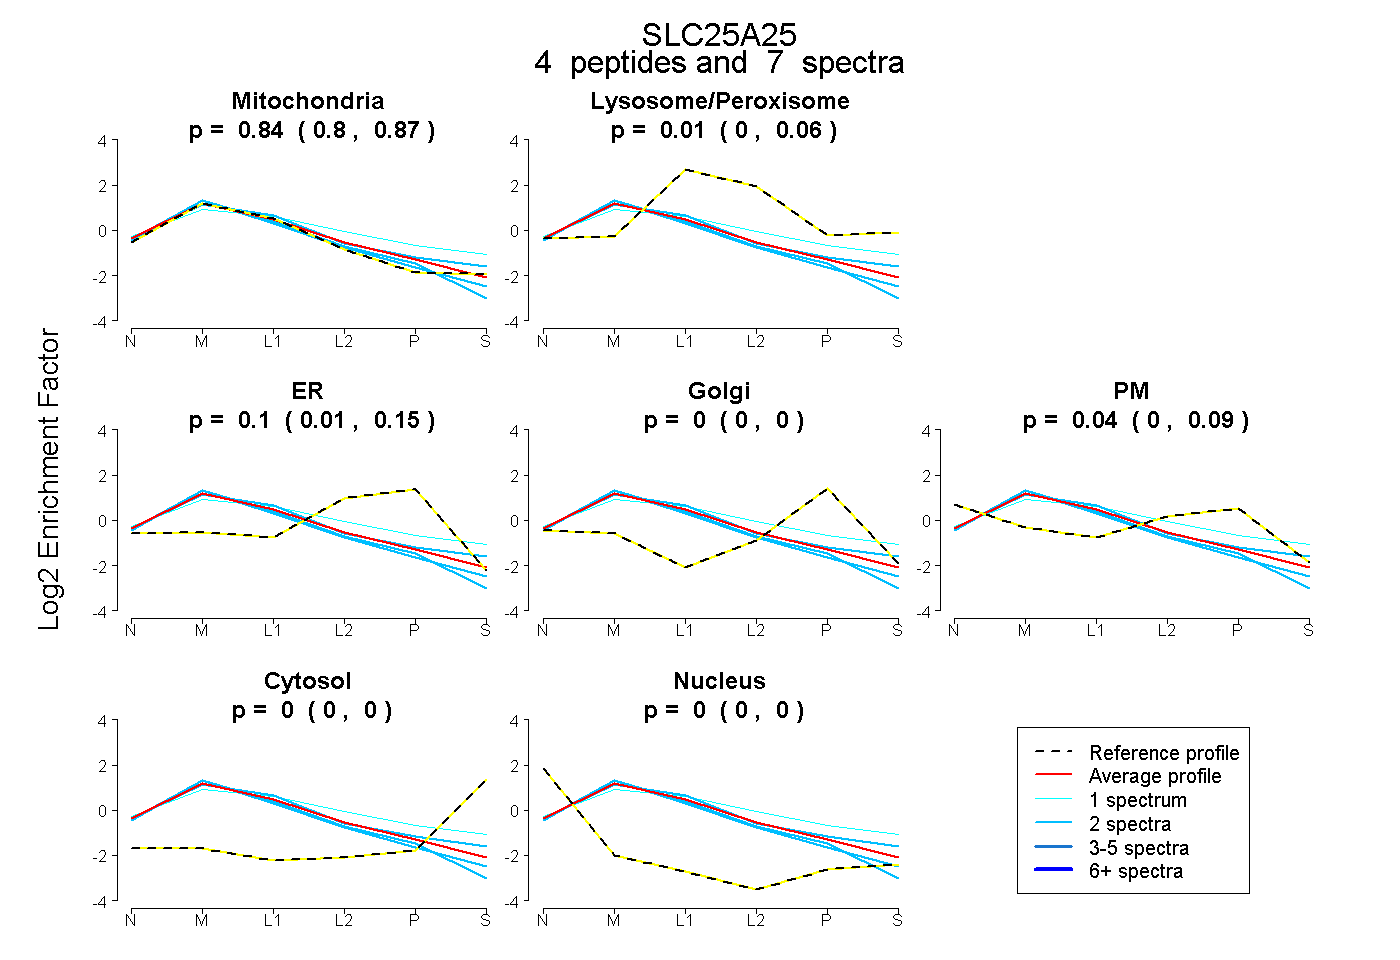
0.796 | 0.870
0.000 | 0.055
0.008 | 0.151
0.000 | 0.003
0.000 | 0.090
0.000 | 0.000
0.000 | 0.000
12peptides
spectra
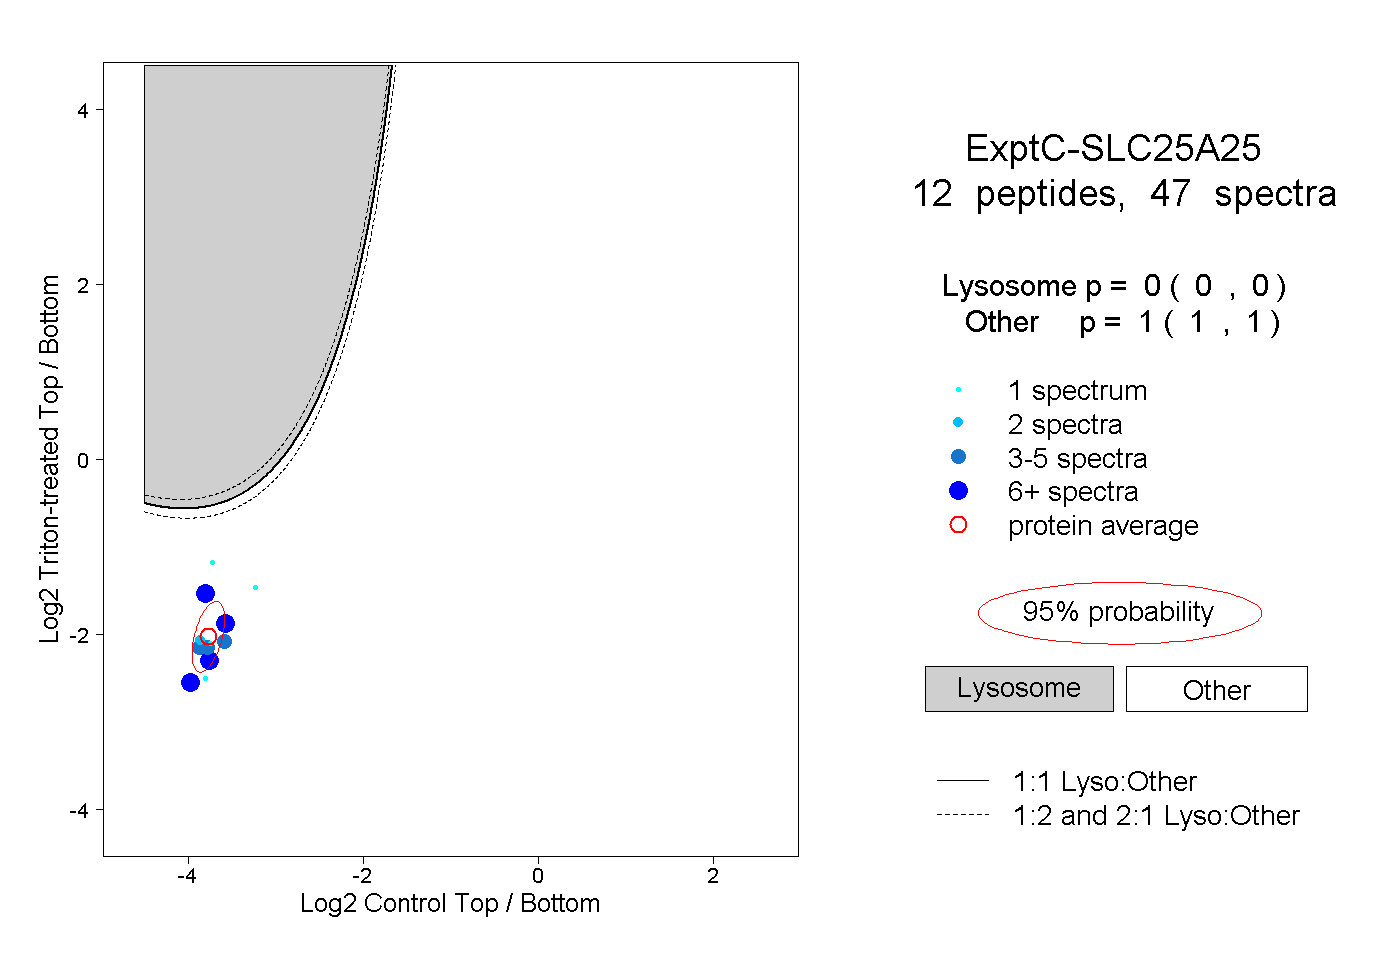
0.000 | 0.000
1.000 | 1.000
6peptides
spectra
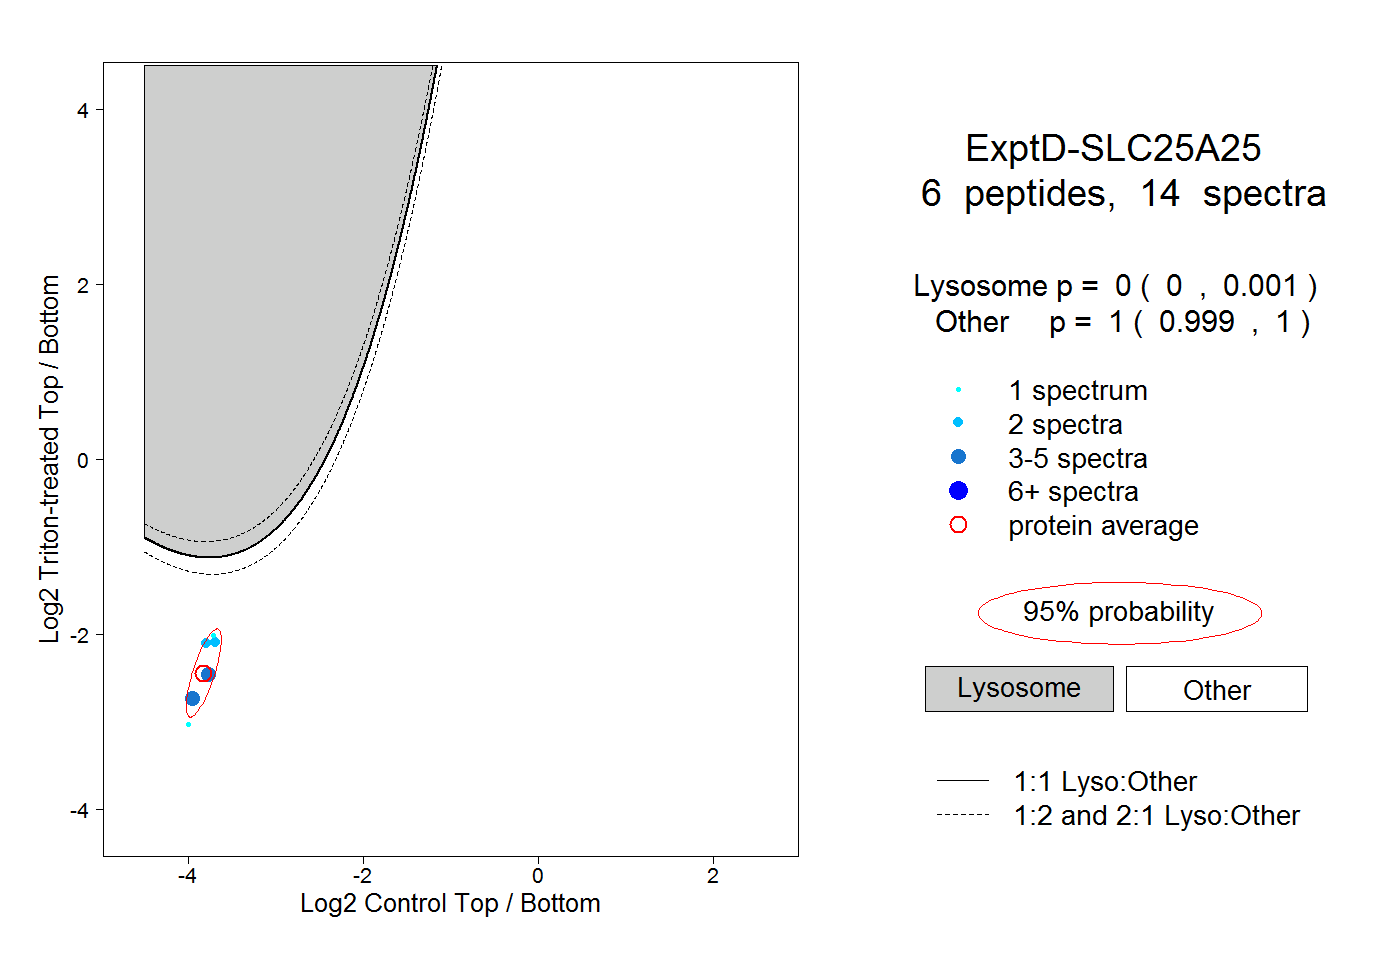
0.000 | 0.001
0.999 | 1.000