 8
8peptides
spectra
0.588 | 0.620
0.118 | 0.150
0.000 | 0.000
0.000 | 0.000
0.057 | 0.113
0.139 | 0.200
0.000 | 0.000
0.000 | 0.000
| Plot | Mito | Lyso | Perox | ER | Golgi | PM | Cytosol | Nucleus | |||||
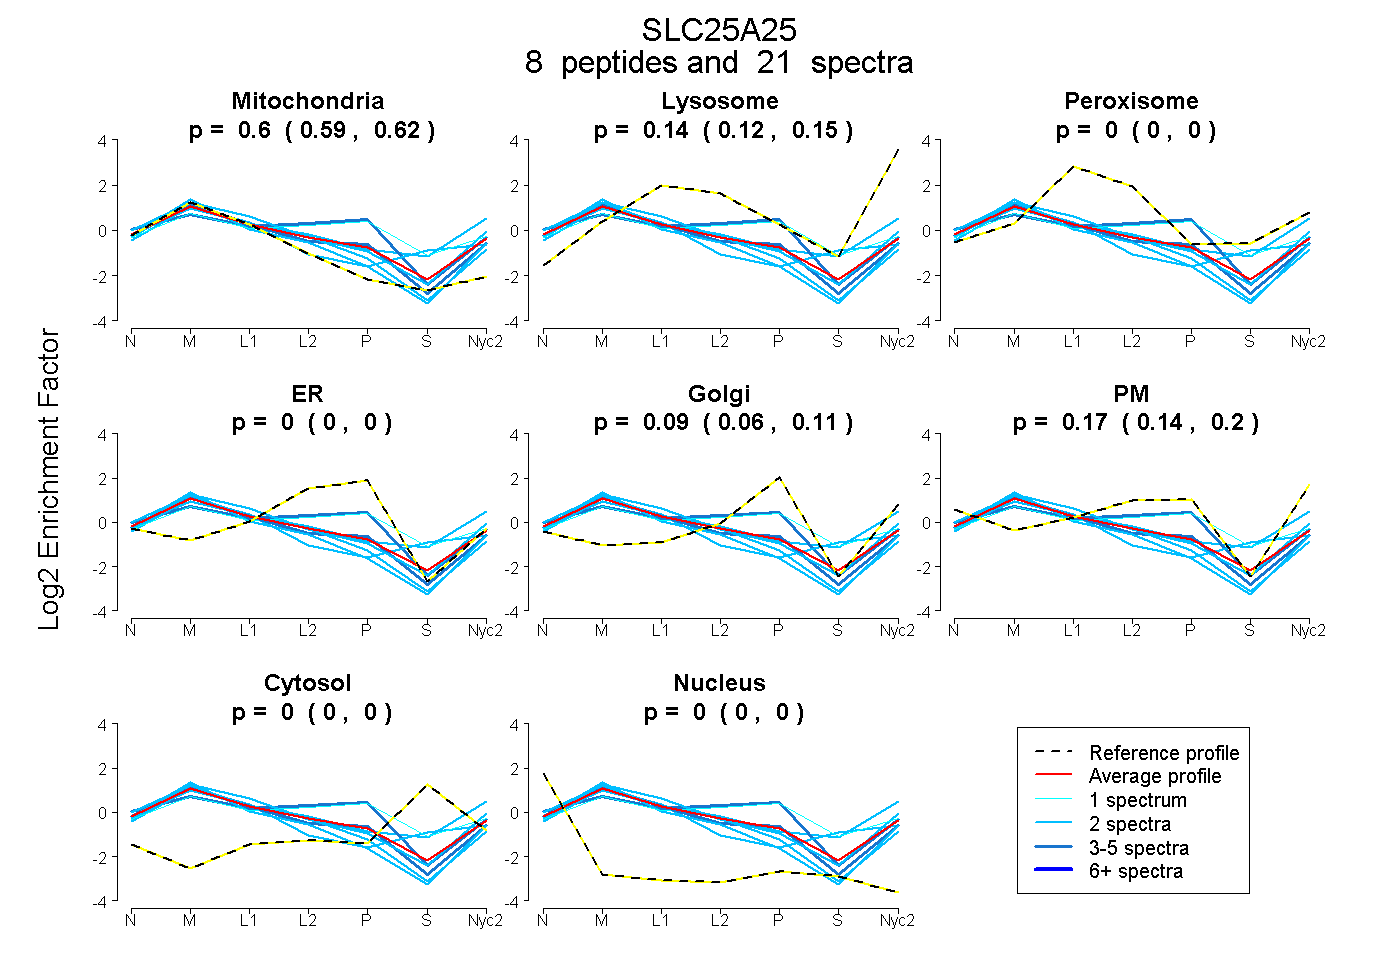
| Expt A |
8 peptides |
21 spectra |
|
0.605 0.588 | 0.620 |
0.136 0.118 | 0.150 |
0.000 0.000 | 0.000 |
0.000 0.000 | 0.000 |
0.086 0.057 | 0.113 |
0.172 0.139 | 0.200 |
0.000 0.000 | 0.000 |
0.000 0.000 | 0.000 |
| 1 spectrum, TGQYSGMLDCAK | 0.275 | 0.000 | 0.277 | 0.000 | 0.392 | 0.000 | 0.056 | 0.000 | ||
| 2 spectra, MQAQASIEGAPEVTMSSLFK | 0.620 | 0.218 | 0.000 | 0.000 | 0.000 | 0.162 | 0.000 | 0.000 | ||
| 2 spectra, IDAQEIMQSLR | 0.620 | 0.170 | 0.019 | 0.000 | 0.000 | 0.000 | 0.191 | 0.000 | ||
| 5 spectra, LVGSDQETLR | 0.631 | 0.055 | 0.000 | 0.000 | 0.110 | 0.205 | 0.000 | 0.000 | ||
| 2 spectra, TCTAPLDR | 0.714 | 0.000 | 0.000 | 0.000 | 0.000 | 0.286 | 0.000 | 0.000 | ||
| 5 spectra, HLVAGGGAGAVSR | 0.379 | 0.028 | 0.000 | 0.288 | 0.045 | 0.261 | 0.000 | 0.000 | ||
| 2 spectra, FMAYEQMK | 0.442 | 0.297 | 0.000 | 0.000 | 0.000 | 0.143 | 0.118 | 0.000 | ||
| 2 spectra, NTWLQR | 0.756 | 0.049 | 0.000 | 0.000 | 0.000 | 0.195 | 0.000 | 0.000 |
| Plot | Mito | Lyso or Perox | ER | Golgi | PM | Cytosol | Nucleus | ||||||
| Expt B |
4 peptides |
7 spectra |
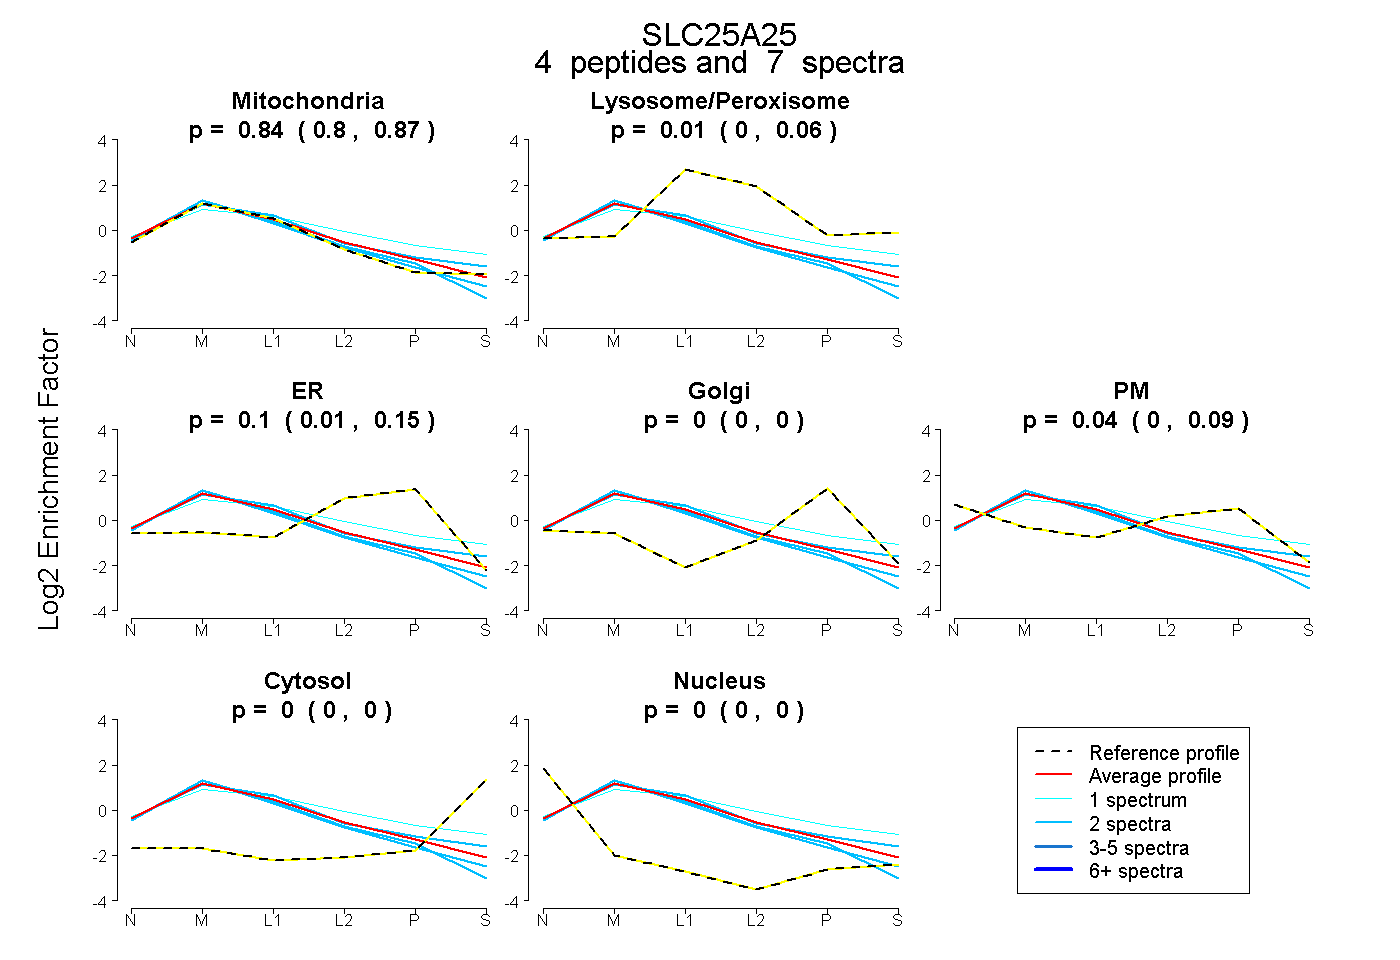 |
0.843 0.796 | 0.870 |
0.013 0.000 | 0.055 |
0.102 0.008 | 0.151 |
0.000 0.000 | 0.003 |
0.042 0.000 | 0.090 |
0.000 0.000 | 0.000 |
0.000 0.000 | 0.000 |
|||
| Plot | Lyso | Other | |||||||||||
| Expt C |
12 peptides |
47 spectra |
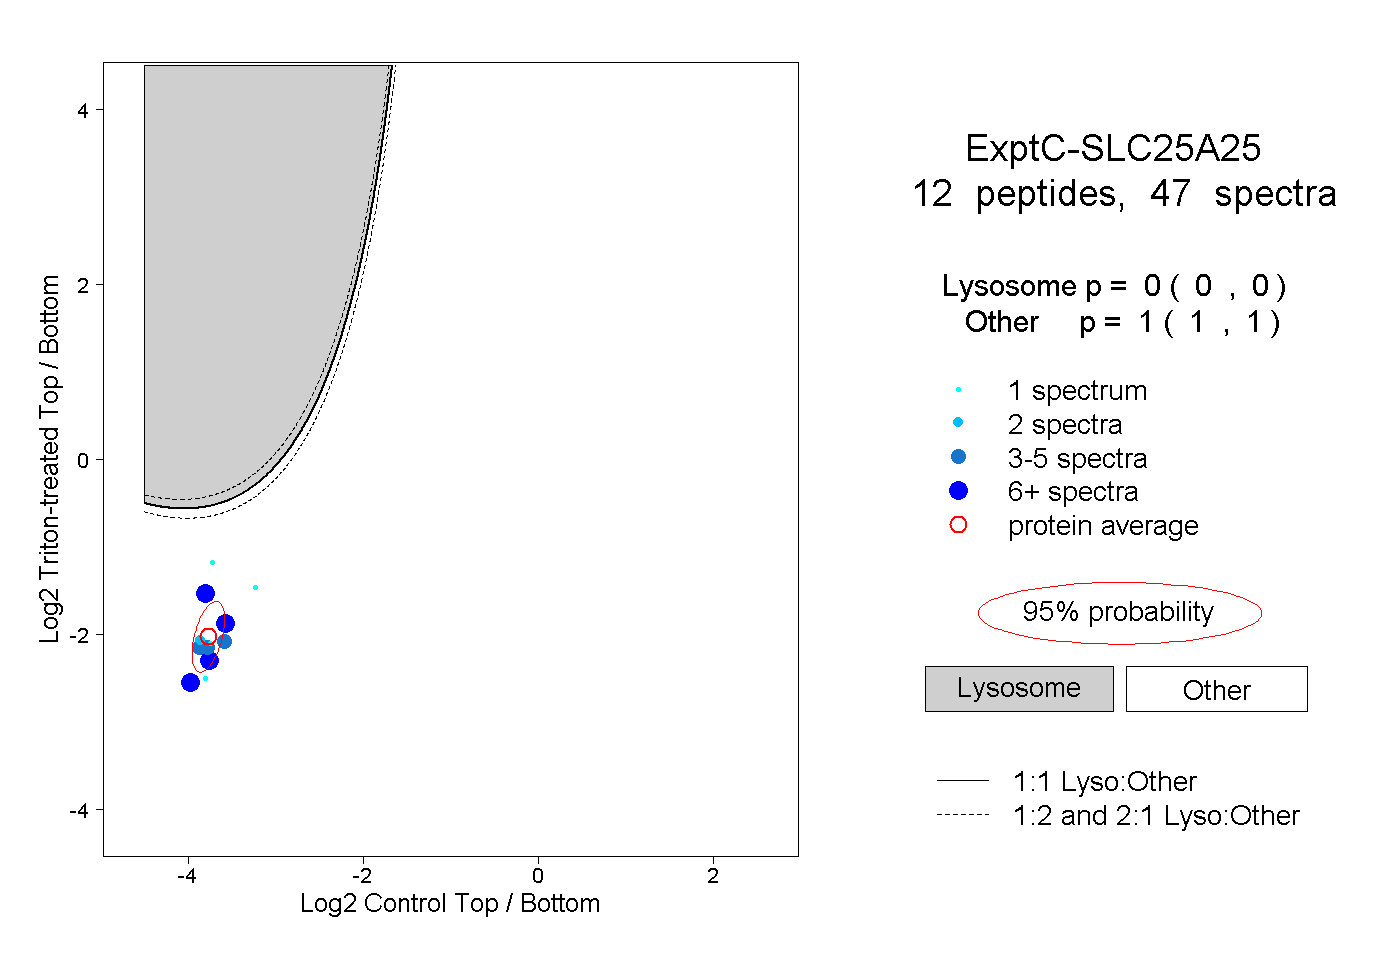 |
0.000 0.000 | 0.000 |
1.000 1.000 | 1.000 |
||||||||
| Plot | Lyso | Other | |||||||||||
| Expt D |
6 peptides |
14 spectra |
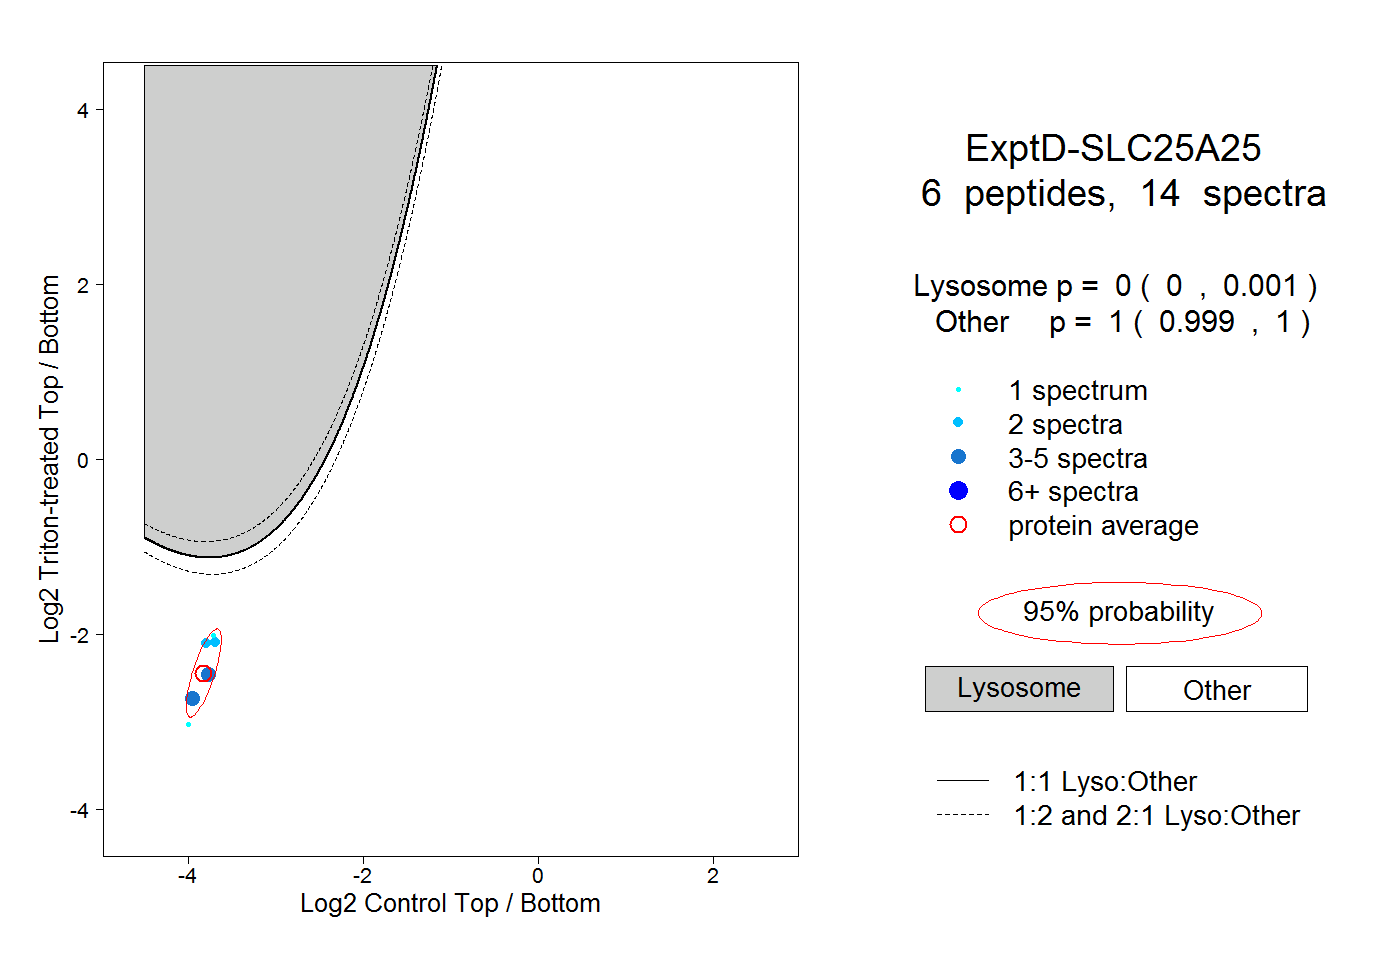 |
0.000 0.000 | 0.001 |
1.000 0.999 | 1.000 |