 10
10peptides
spectra
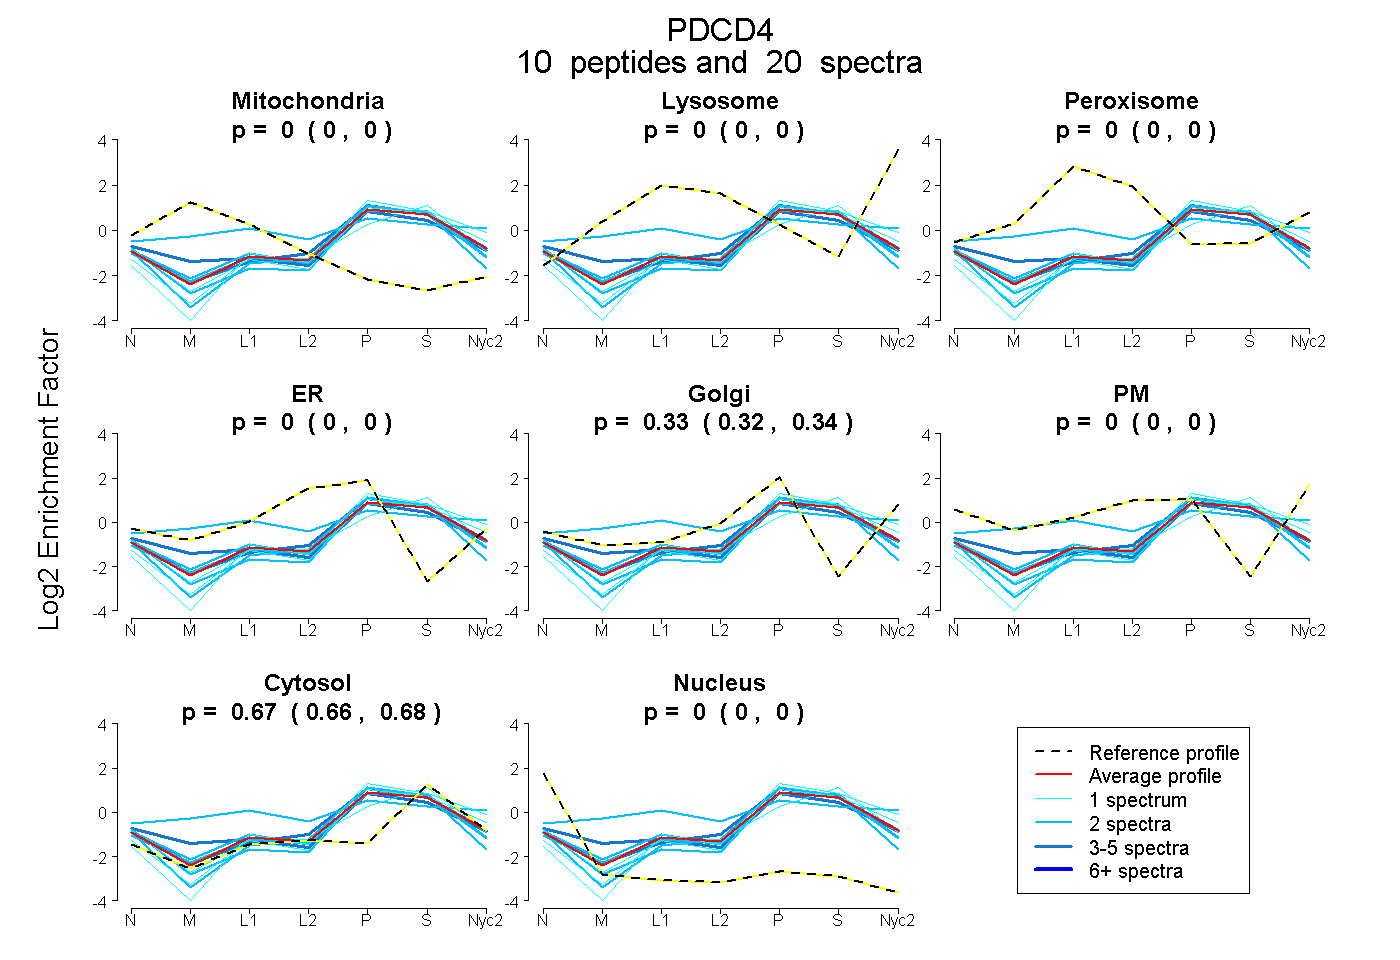
0.000 | 0.000
0.000 | 0.000
0.000 | 0.000
0.000 | 0.000
0.318 | 0.335
0.000 | 0.000
0.663 | 0.681
0.000 | 0.000
3peptides
spectra
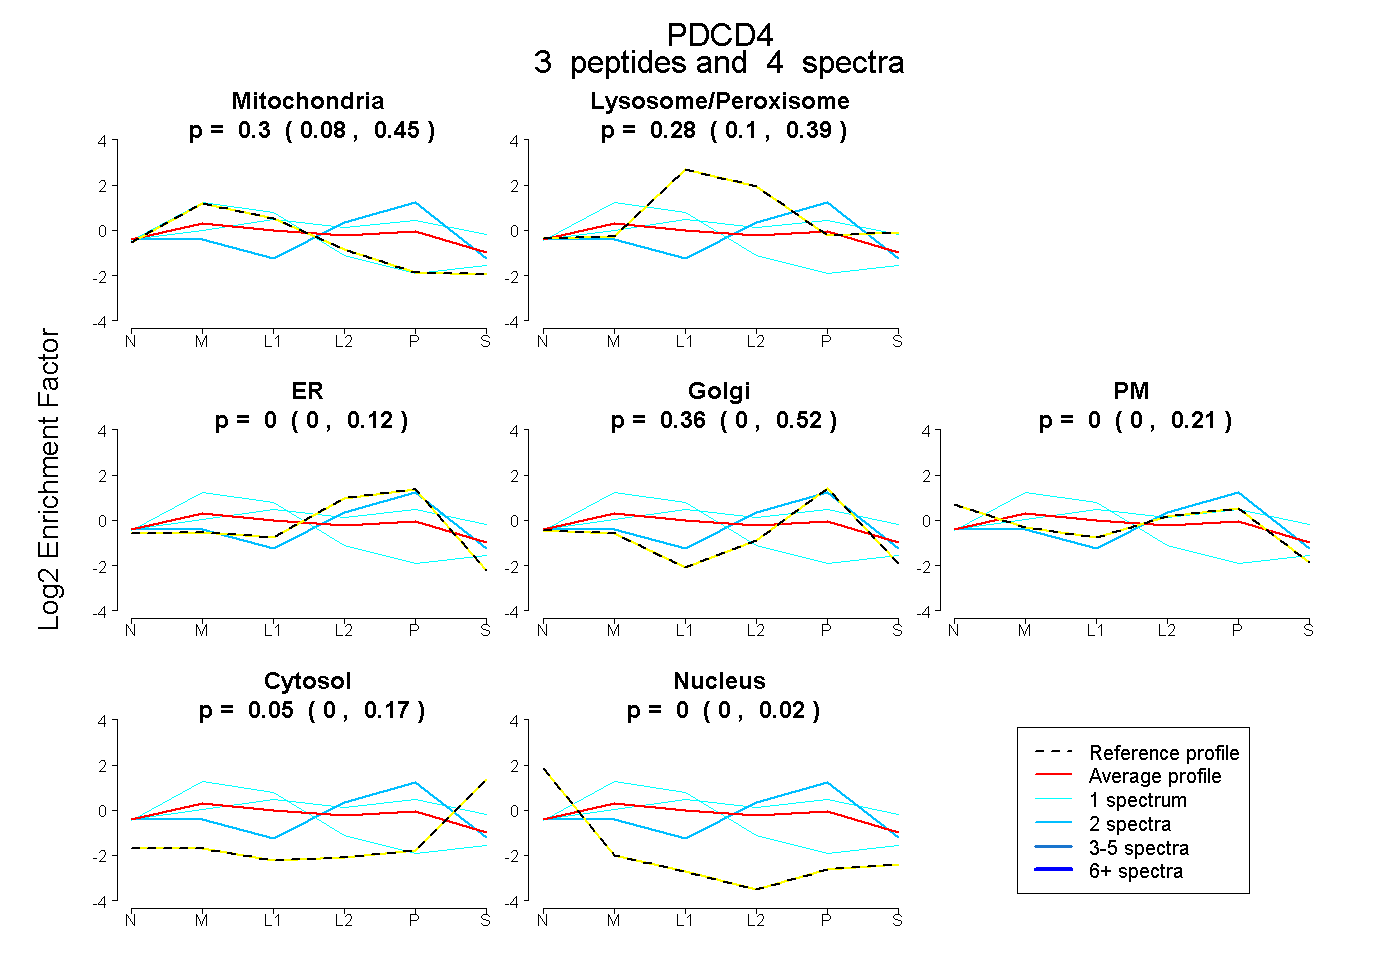
0.083 | 0.451
0.105 | 0.389
0.000 | 0.118
0.000 | 0.524
0.000 | 0.210
0.000 | 0.167
0.000 | 0.016
7peptides
spectra
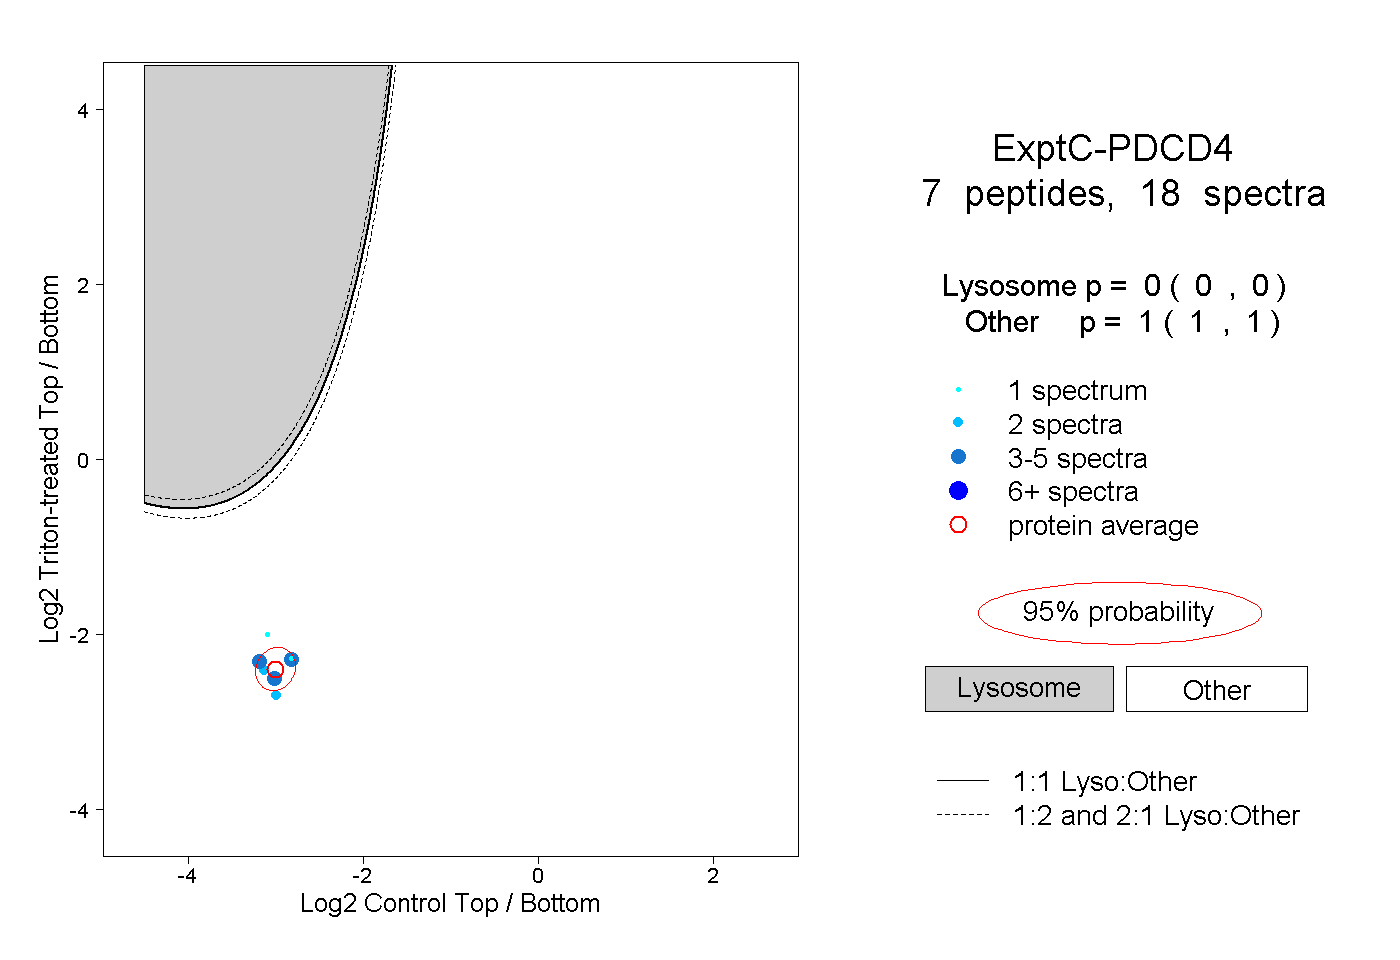
0.000 | 0.000
1.000 | 1.000
1peptide
spectrum
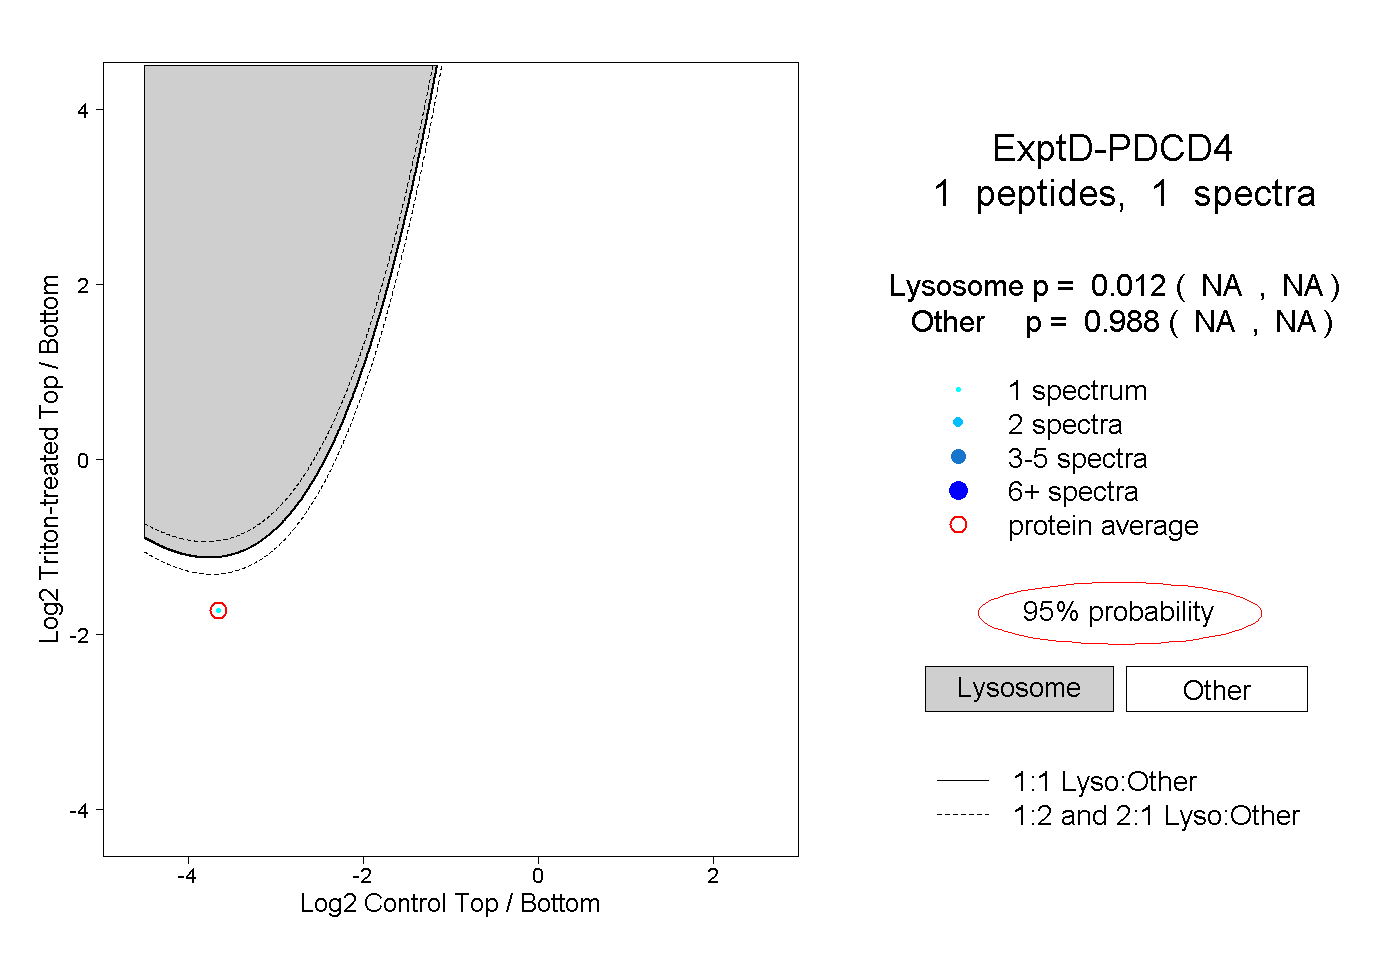
NA | NA
NA | NA