 10
10peptides
spectra
0.000 | 0.000
0.000 | 0.000
0.000 | 0.000
0.000 | 0.000
0.318 | 0.335
0.000 | 0.000
0.663 | 0.681
0.000 | 0.000
| Plot | Mito | Lyso | Perox | ER | Golgi | PM | Cytosol | Nucleus | |||||
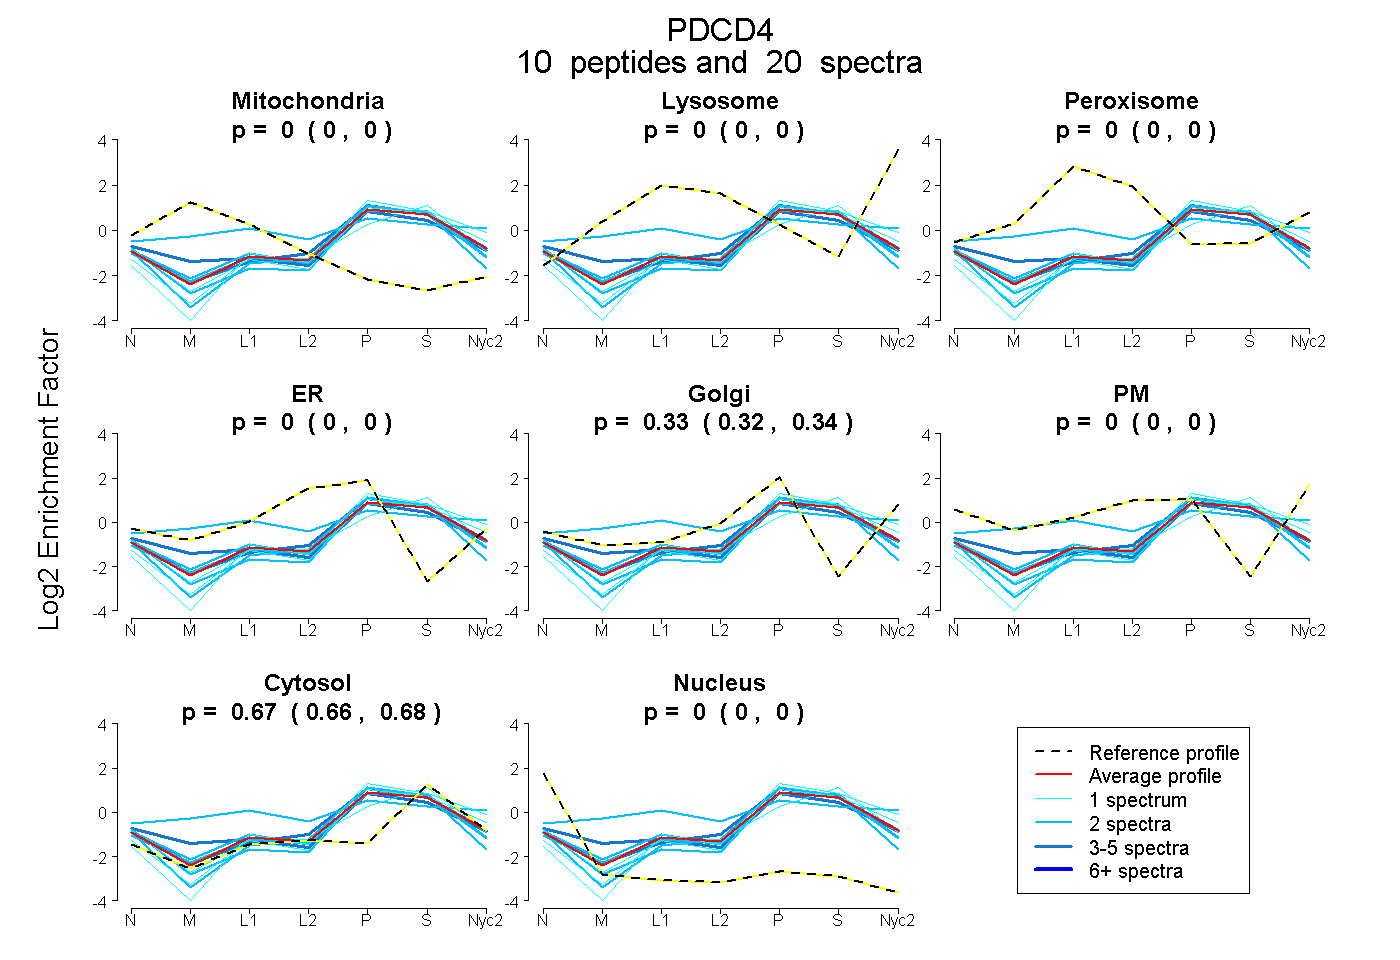
| Expt A |
10 peptides |
20 spectra |
|
0.000 0.000 | 0.000 |
0.000 0.000 | 0.000 |
0.000 0.000 | 0.000 |
0.000 0.000 | 0.000 |
0.327 0.318 | 0.335 |
0.000 0.000 | 0.000 |
0.673 0.663 | 0.681 |
0.000 0.000 | 0.000 |
| 2 spectra, DLPELALDTPR | 0.000 | 0.000 | 0.000 | 0.000 | 0.296 | 0.000 | 0.682 | 0.022 | ||
| 4 spectra, EIDMLLK | 0.000 | 0.000 | 0.000 | 0.000 | 0.358 | 0.000 | 0.642 | 0.000 | ||
| 1 spectrum, LLSDLCGTVMSTNDVEK | 0.000 | 0.000 | 0.000 | 0.000 | 0.162 | 0.000 | 0.838 | 0.000 | ||
| 1 spectrum, SGVPVLAVSLALEGK | 0.000 | 0.000 | 0.000 | 0.000 | 0.324 | 0.000 | 0.676 | 0.000 | ||
| 2 spectra, GDSVSDNGSEAVR | 0.000 | 0.000 | 0.000 | 0.000 | 0.275 | 0.000 | 0.721 | 0.004 | ||
| 3 spectra, APQLVGQFIAR | 0.000 | 0.000 | 0.000 | 0.000 | 0.383 | 0.000 | 0.605 | 0.013 | ||
| 2 spectra, EYLLSGDMSEAEHCLK | 0.000 | 0.000 | 0.000 | 0.000 | 0.291 | 0.000 | 0.709 | 0.000 | ||
| 2 spectra, FVSEGDGGR | 0.017 | 0.000 | 0.310 | 0.000 | 0.316 | 0.000 | 0.358 | 0.000 | ||
| 2 spectra, GTVDCVQAR | 0.000 | 0.000 | 0.000 | 0.124 | 0.149 | 0.000 | 0.697 | 0.030 | ||
| 1 spectrum, TLTPIIQEYFEHGDTNEVAEMLR | 0.000 | 0.000 | 0.000 | 0.000 | 0.296 | 0.000 | 0.704 | 0.000 |
| Plot | Mito | Lyso or Perox | ER | Golgi | PM | Cytosol | Nucleus | ||||||
| Expt B |
3 peptides |
4 spectra |
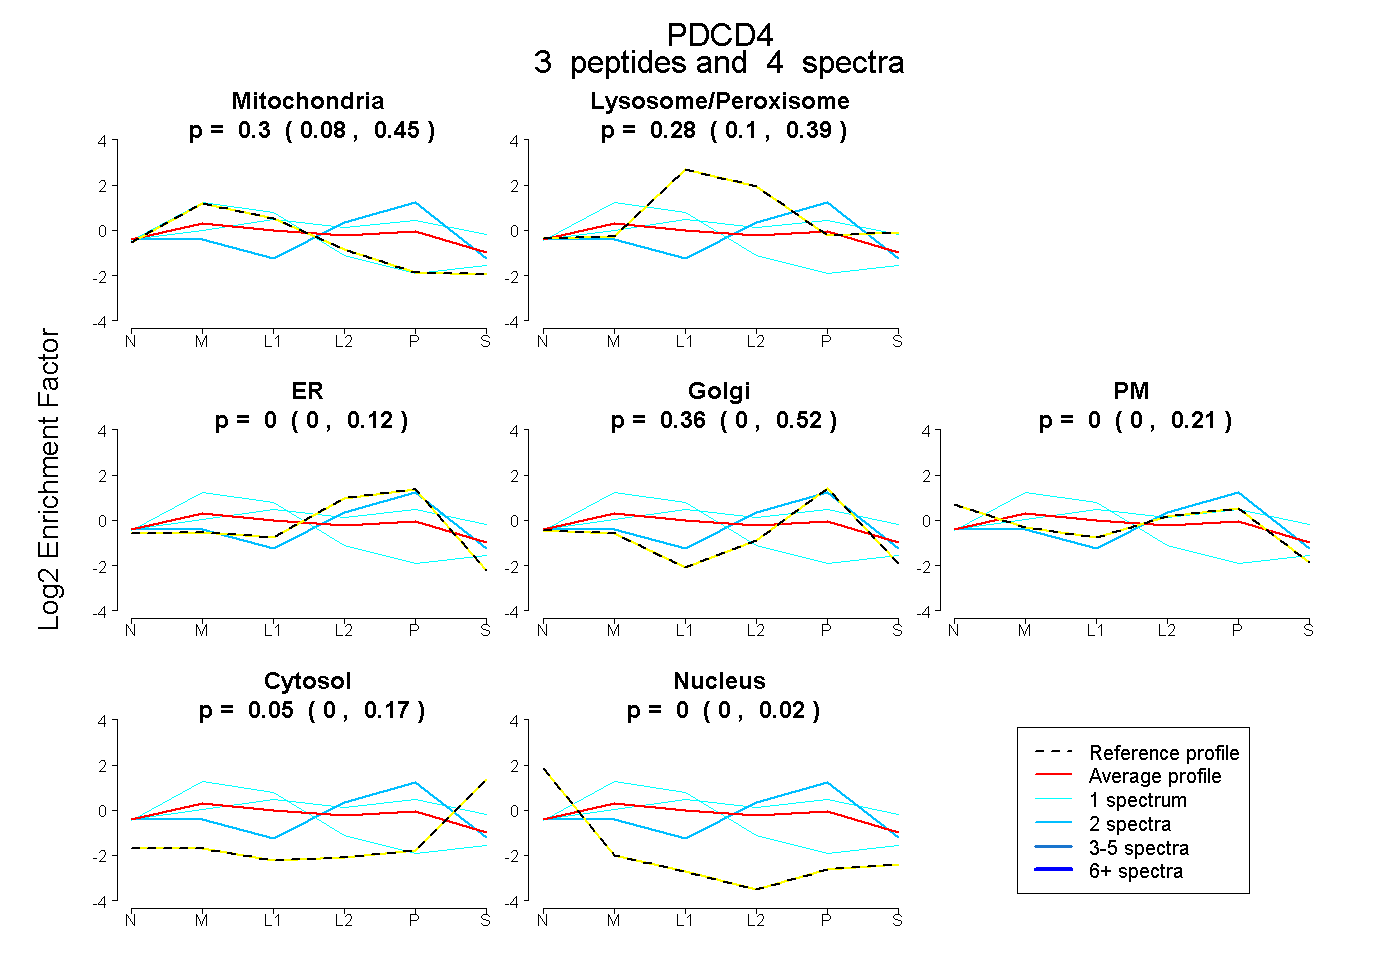 |
0.303 0.083 | 0.451 |
0.278 0.105 | 0.389 |
0.000 0.000 | 0.118 |
0.364 0.000 | 0.524 |
0.000 0.000 | 0.210 |
0.055 0.000 | 0.167 |
0.000 0.000 | 0.016 |
|||
| Plot | Lyso | Other | |||||||||||
| Expt C |
7 peptides |
18 spectra |
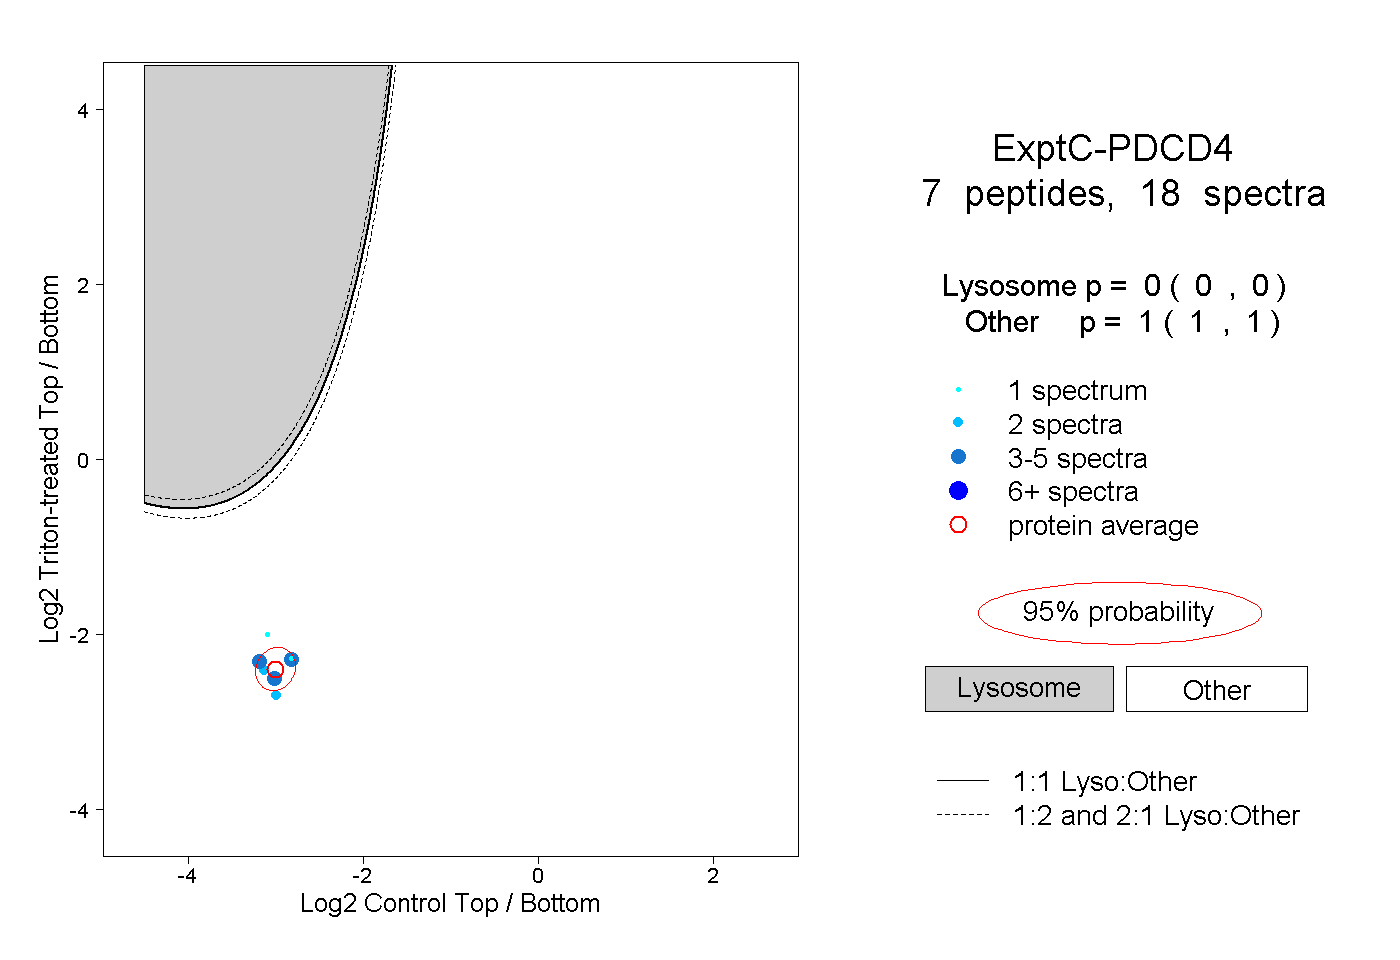 |
0.000 0.000 | 0.000 |
1.000 1.000 | 1.000 |
||||||||
| Plot | Lyso | Other | |||||||||||
| Expt D |
1 peptide |
1 spectrum |
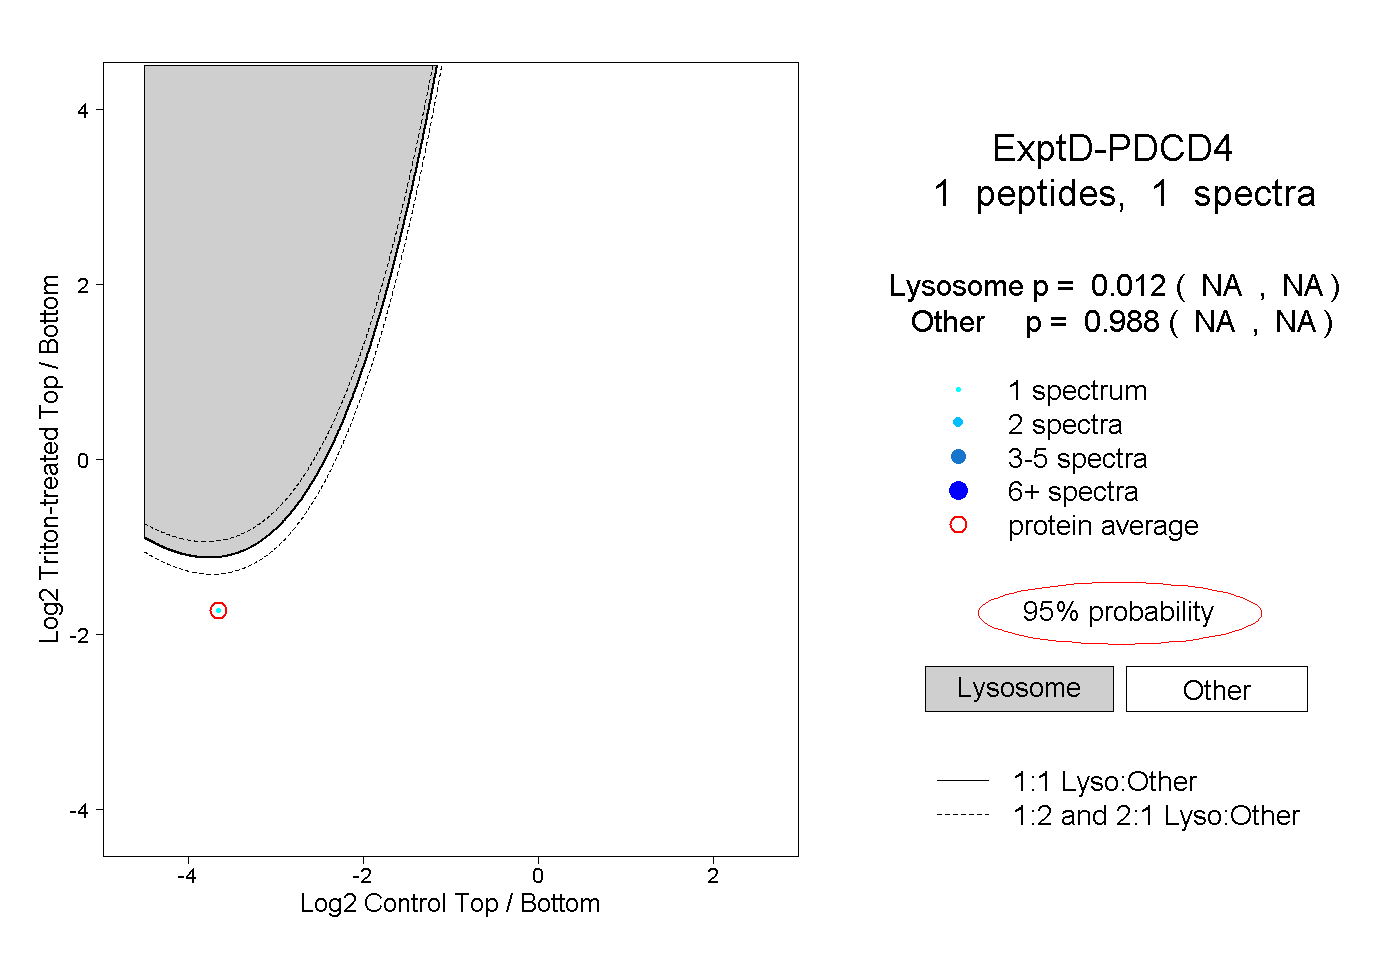 |
0.012 NA | NA |
0.988 NA | NA |