 10
10peptides
spectra
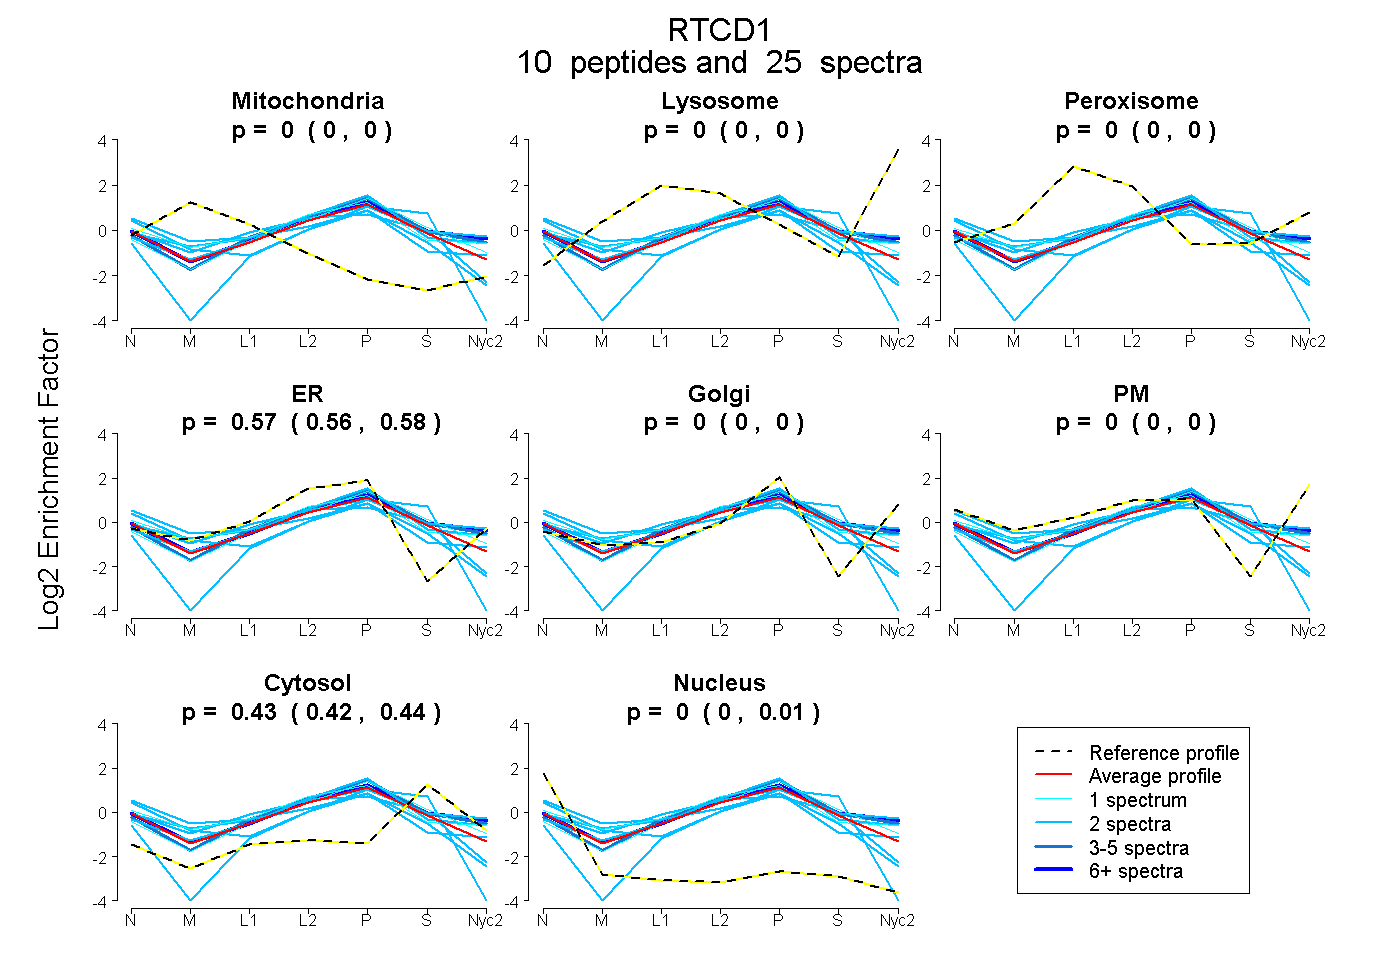
0.000 | 0.000
0.000 | 0.000
0.000 | 0.000
0.558 | 0.575
0.000 | 0.000
0.000 | 0.000
0.421 | 0.439
0.000 | 0.009
2peptides
spectra
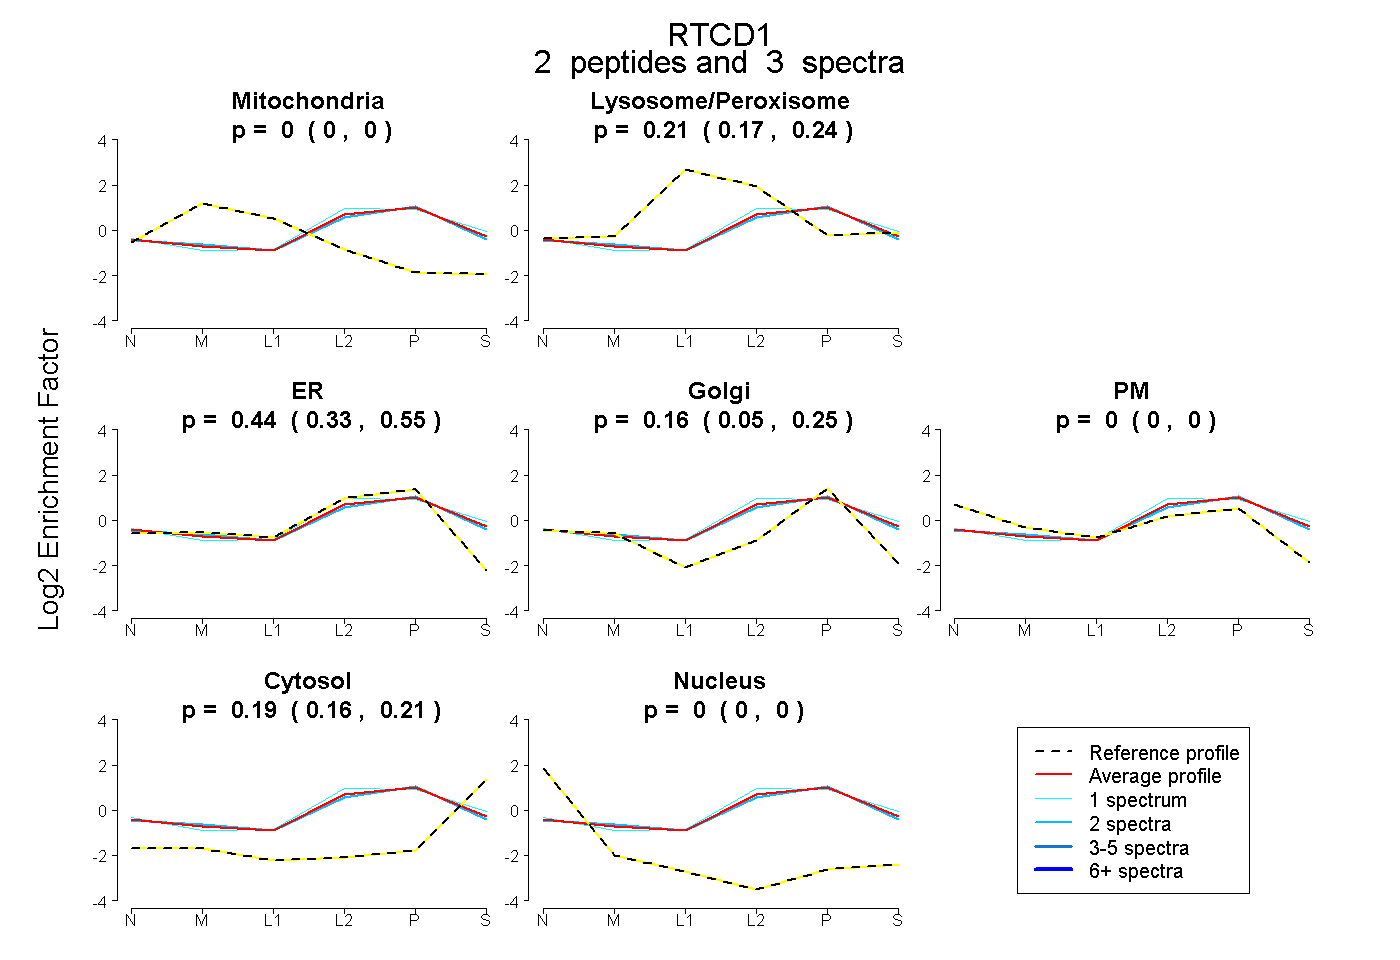
0.000 | 0.000
0.172 | 0.236
0.325 | 0.553
0.048 | 0.251
0.000 | 0.000
0.163 | 0.209
0.000 | 0.000
9peptides
spectra
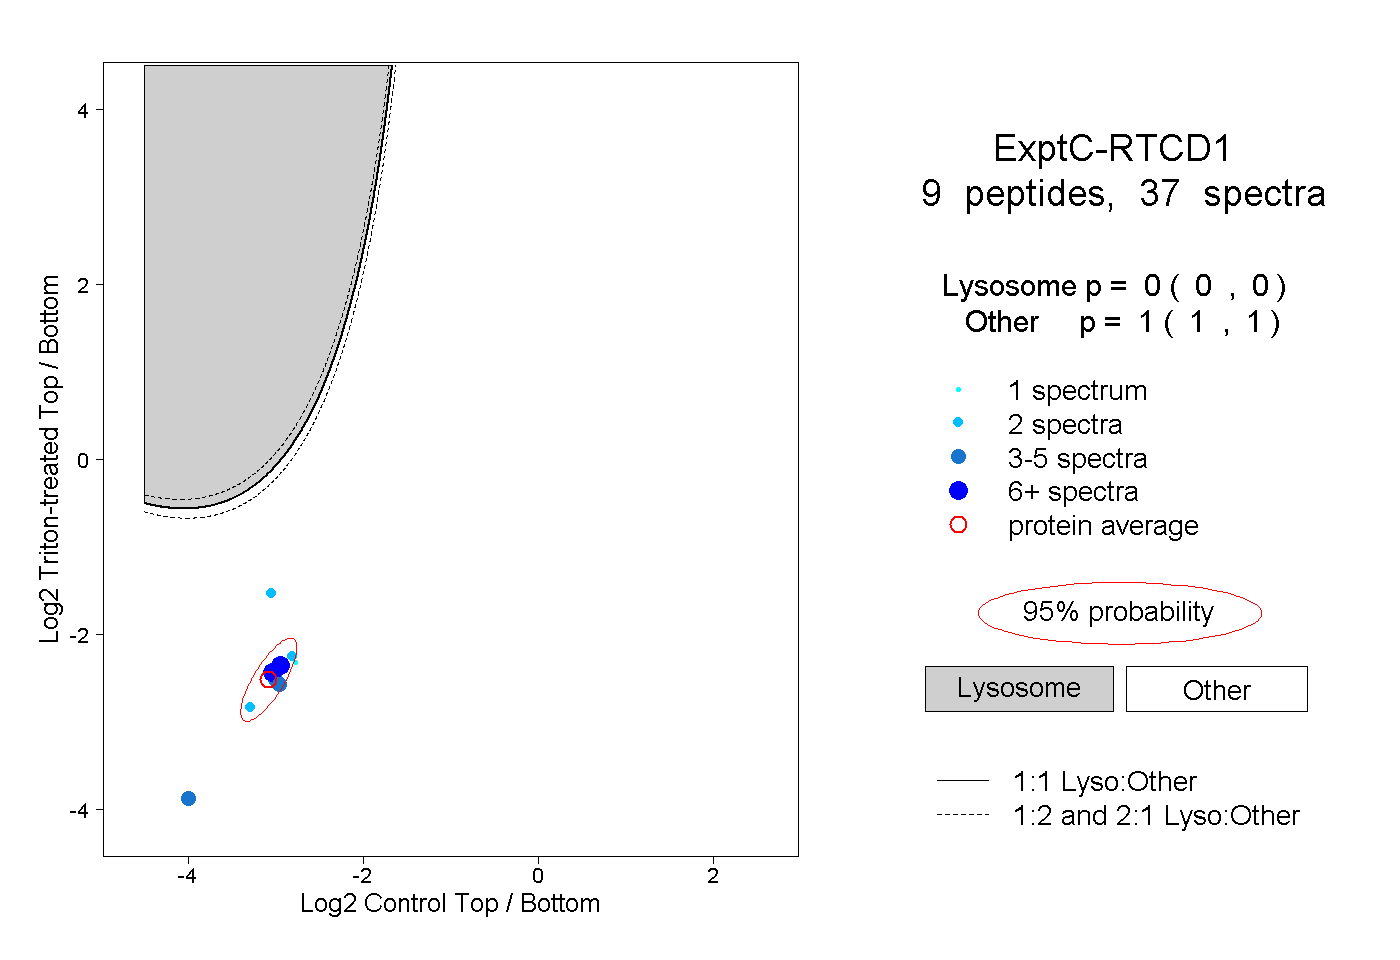
0.000 | 0.000
1.000 | 1.000
2peptides
spectra
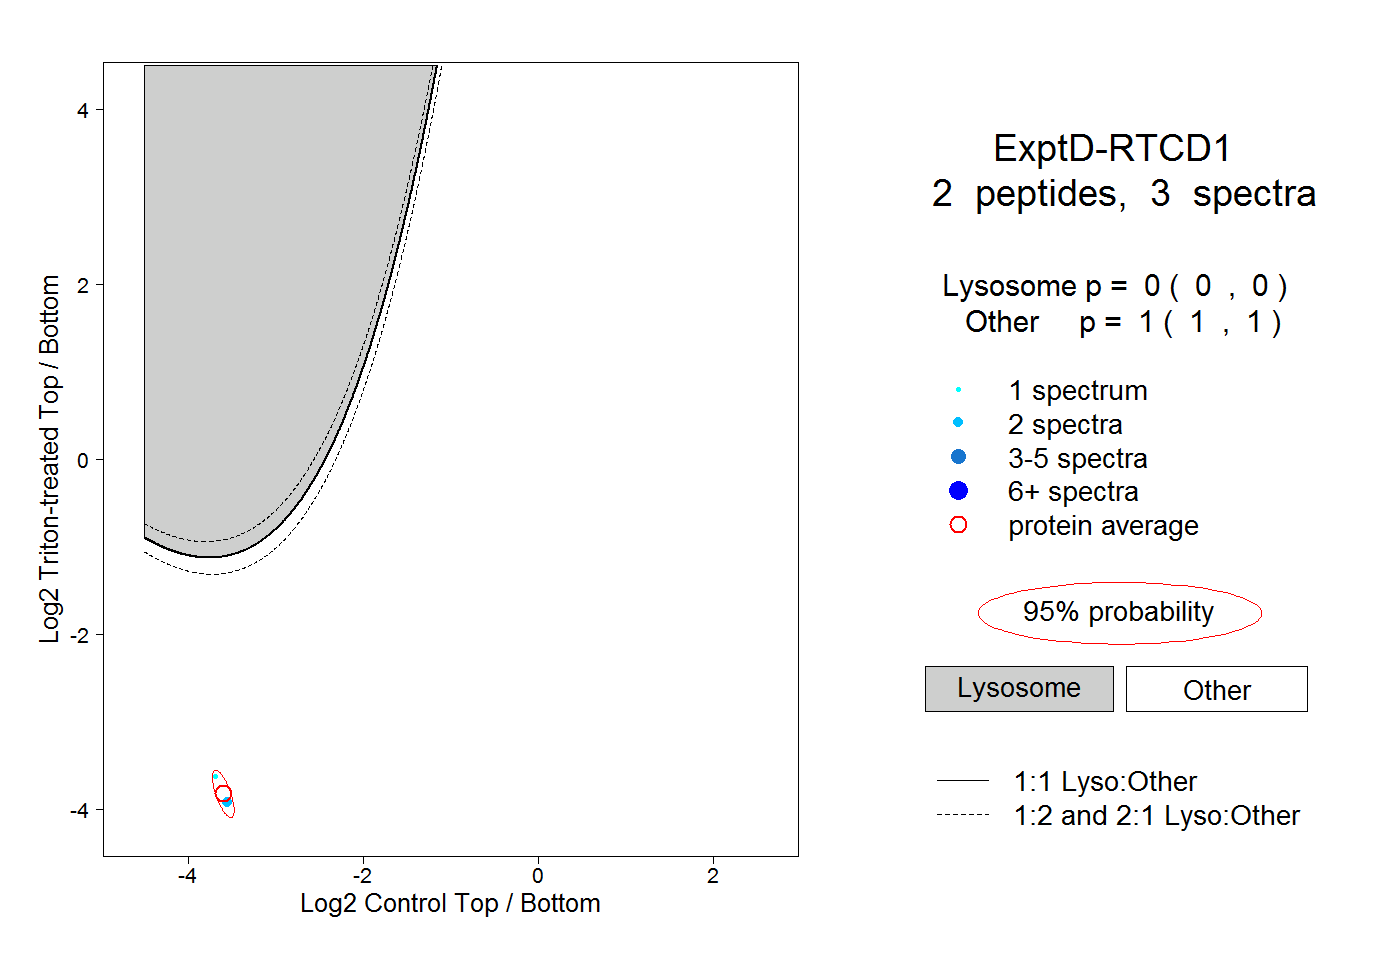
0.000 | 0.000
1.000 | 1.000