 10
10peptides
spectra
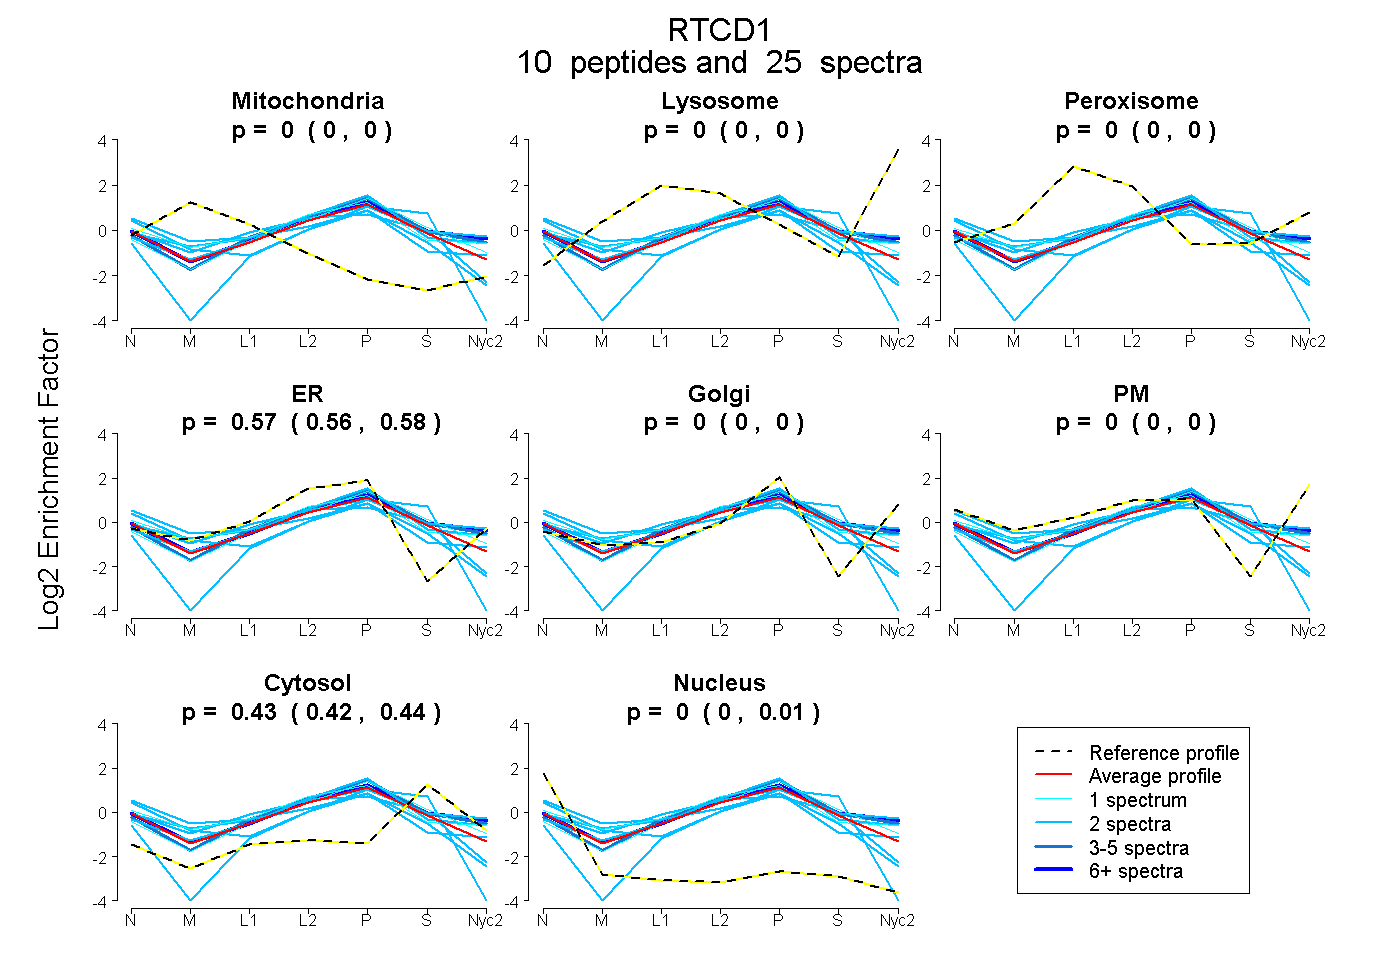
0.000 | 0.000
0.000 | 0.000
0.000 | 0.000
0.558 | 0.575
0.000 | 0.000
0.000 | 0.000
0.421 | 0.439
0.000 | 0.009
| Plot | Mito | Lyso | Perox | ER | Golgi | PM | Cytosol | Nucleus | |||||
| Expt A |
10 peptides |
25 spectra |
|
0.000 0.000 | 0.000 |
0.000 0.000 | 0.000 |
0.000 0.000 | 0.000 |
0.567 0.558 | 0.575 |
0.000 0.000 | 0.000 |
0.000 0.000 | 0.000 |
0.433 0.421 | 0.439 |
0.000 0.000 | 0.009 |
| 4 spectra, GGGEVIVR | 0.000 | 0.000 | 0.018 | 0.579 | 0.000 | 0.000 | 0.403 | 0.000 | ||
| 7 spectra, DMAAAAVR | 0.000 | 0.000 | 0.020 | 0.507 | 0.000 | 0.069 | 0.405 | 0.000 | ||
| 2 spectra, DLYVSIQPVQEAR | 0.129 | 0.000 | 0.004 | 0.471 | 0.000 | 0.000 | 0.396 | 0.000 | ||
| 2 spectra, AFVAGVLPLK | 0.000 | 0.000 | 0.000 | 0.243 | 0.000 | 0.000 | 0.601 | 0.157 | ||
| 1 spectrum, VGIEAAEMLLANLR | 0.000 | 0.000 | 0.000 | 0.547 | 0.000 | 0.000 | 0.453 | 0.000 | ||
| 2 spectra, FGFTFNCDIK | 0.035 | 0.000 | 0.000 | 0.509 | 0.000 | 0.000 | 0.276 | 0.180 | ||
| 2 spectra, GVNADK | 0.000 | 0.000 | 0.167 | 0.378 | 0.085 | 0.025 | 0.345 | 0.000 | ||
| 2 spectra, GGVHTADTK | 0.076 | 0.000 | 0.095 | 0.526 | 0.000 | 0.010 | 0.192 | 0.101 | ||
| 2 spectra, LDPINLTDR | 0.000 | 0.000 | 0.000 | 0.639 | 0.000 | 0.000 | 0.361 | 0.000 | ||
| 1 spectrum, VEVDGGIMEGGGQILR | 0.000 | 0.000 | 0.086 | 0.598 | 0.000 | 0.007 | 0.308 | 0.000 |
| Plot | Mito | Lyso or Perox | ER | Golgi | PM | Cytosol | Nucleus | ||||||
| Expt B |
2 peptides |
3 spectra |
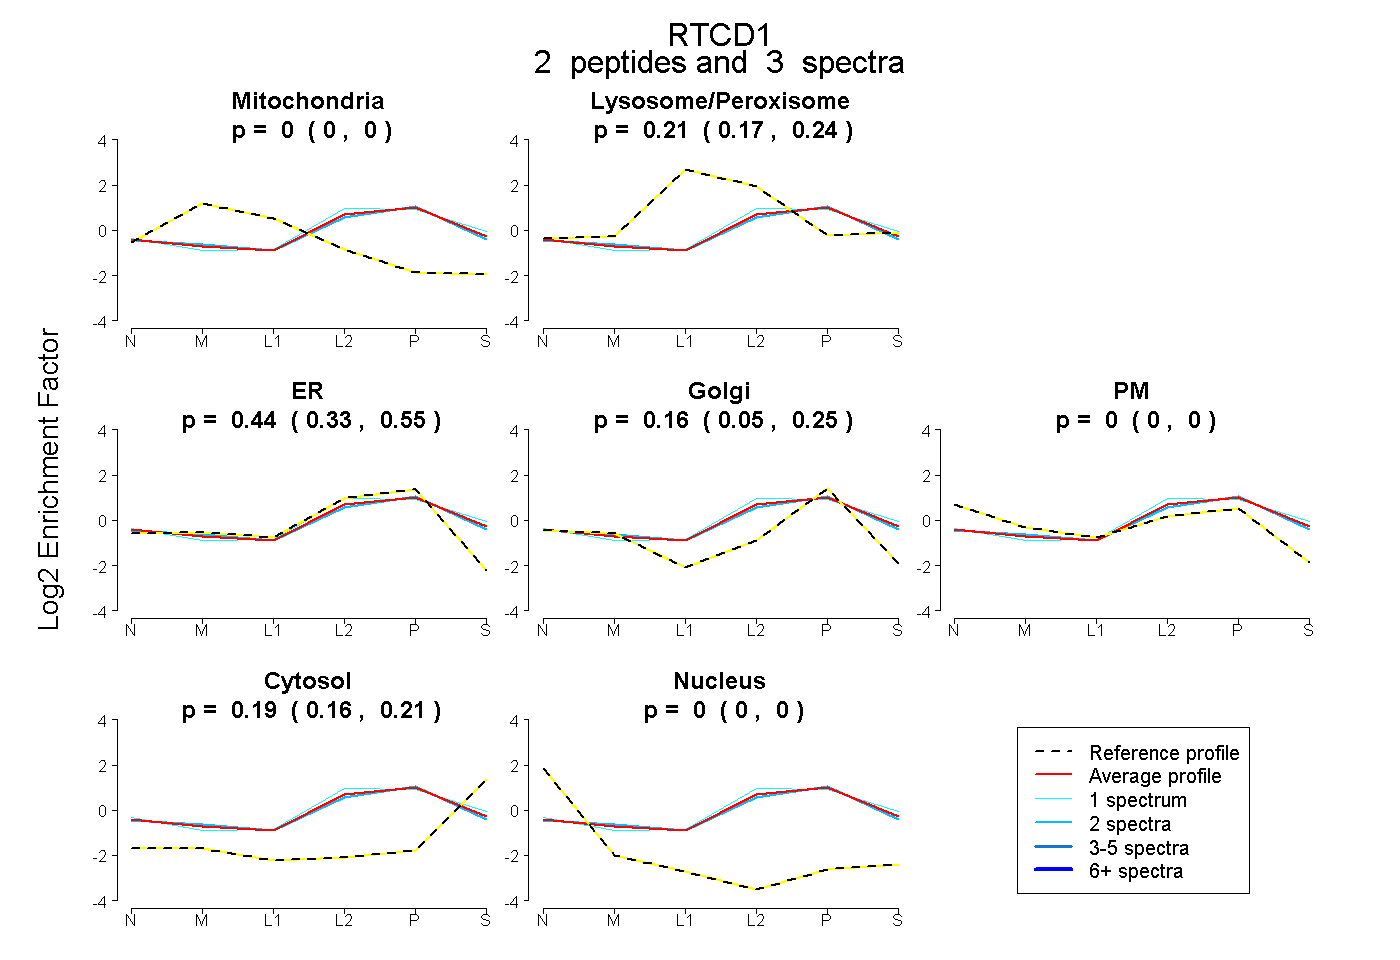 |
0.000 0.000 | 0.000 |
0.208 0.172 | 0.236 |
0.444 0.325 | 0.553 |
0.162 0.048 | 0.251 |
0.000 0.000 | 0.000 |
0.187 0.163 | 0.209 |
0.000 0.000 | 0.000 |
|||
| Plot | Lyso | Other | |||||||||||
| Expt C |
9 peptides |
37 spectra |
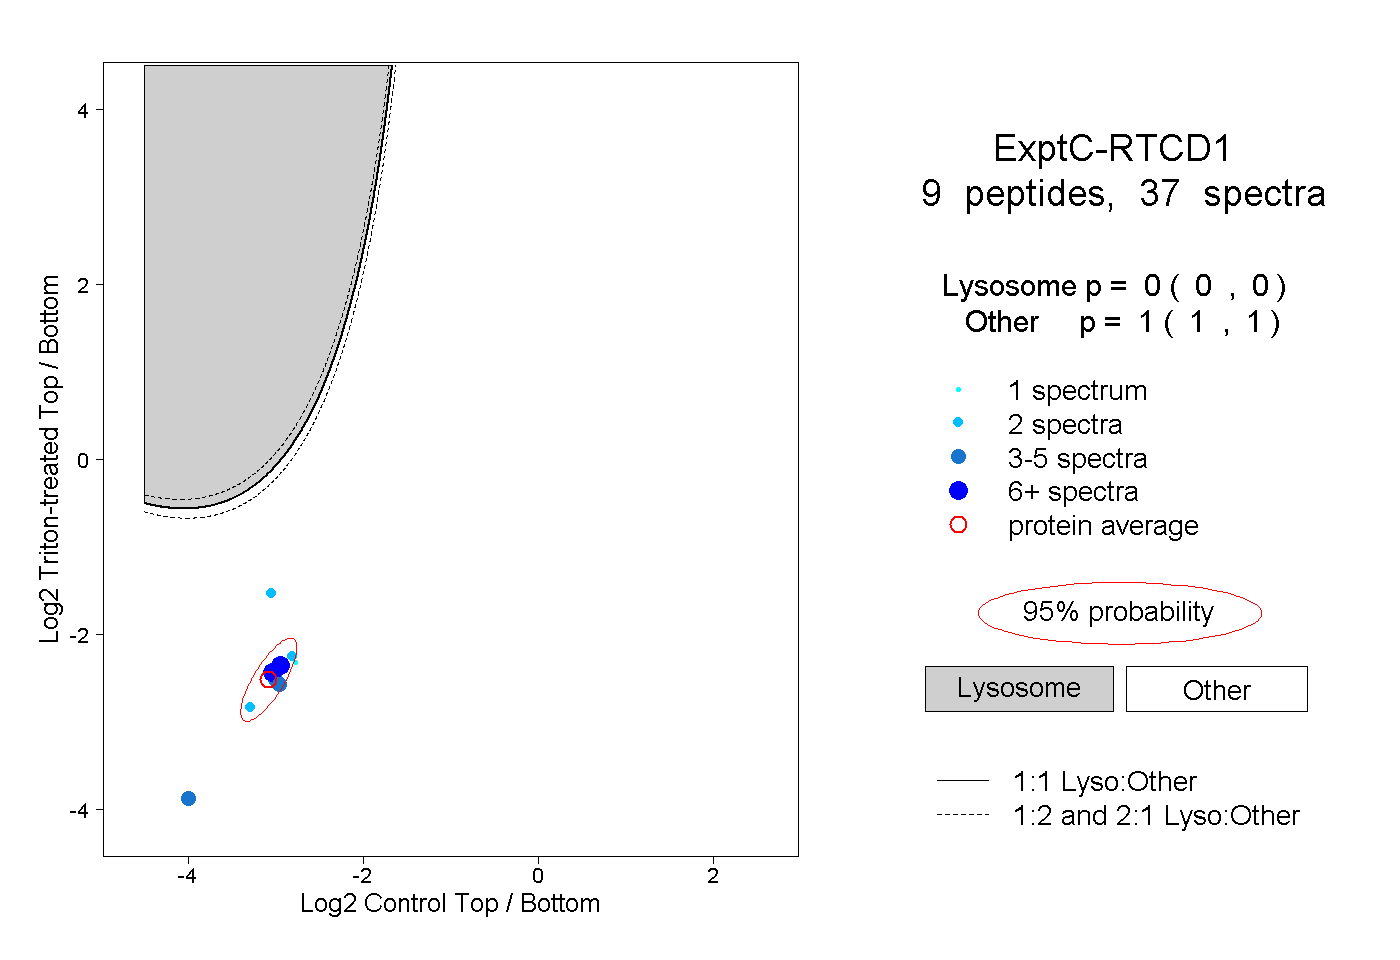 |
0.000 0.000 | 0.000 |
1.000 1.000 | 1.000 |
||||||||
| Plot | Lyso | Other | |||||||||||
| Expt D |
2 peptides |
3 spectra |
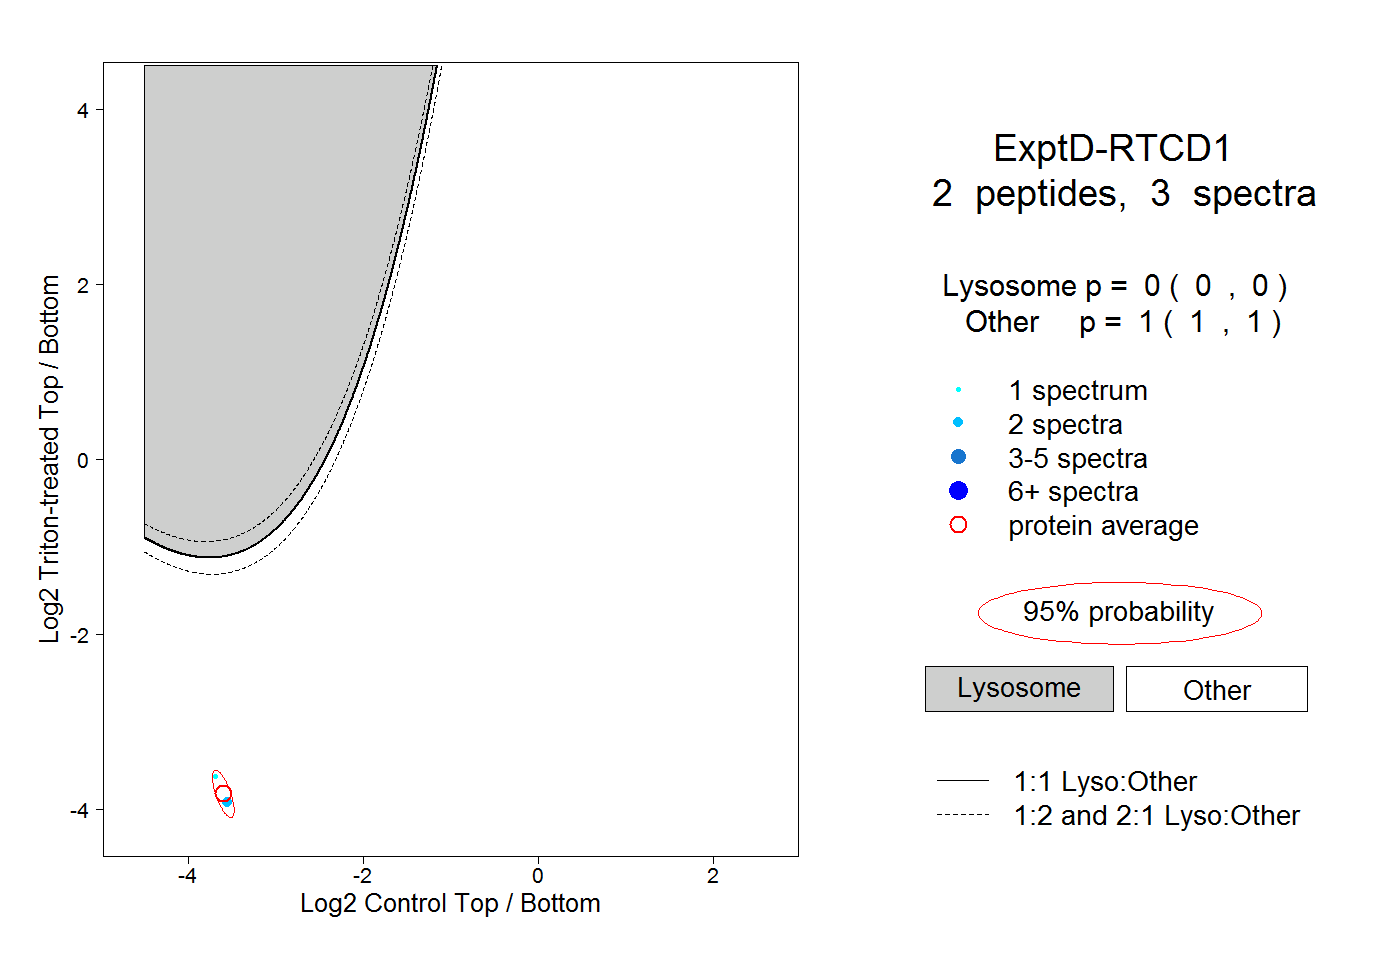 |
0.000 0.000 | 0.000 |
1.000 1.000 | 1.000 |