 7
7peptides
spectra
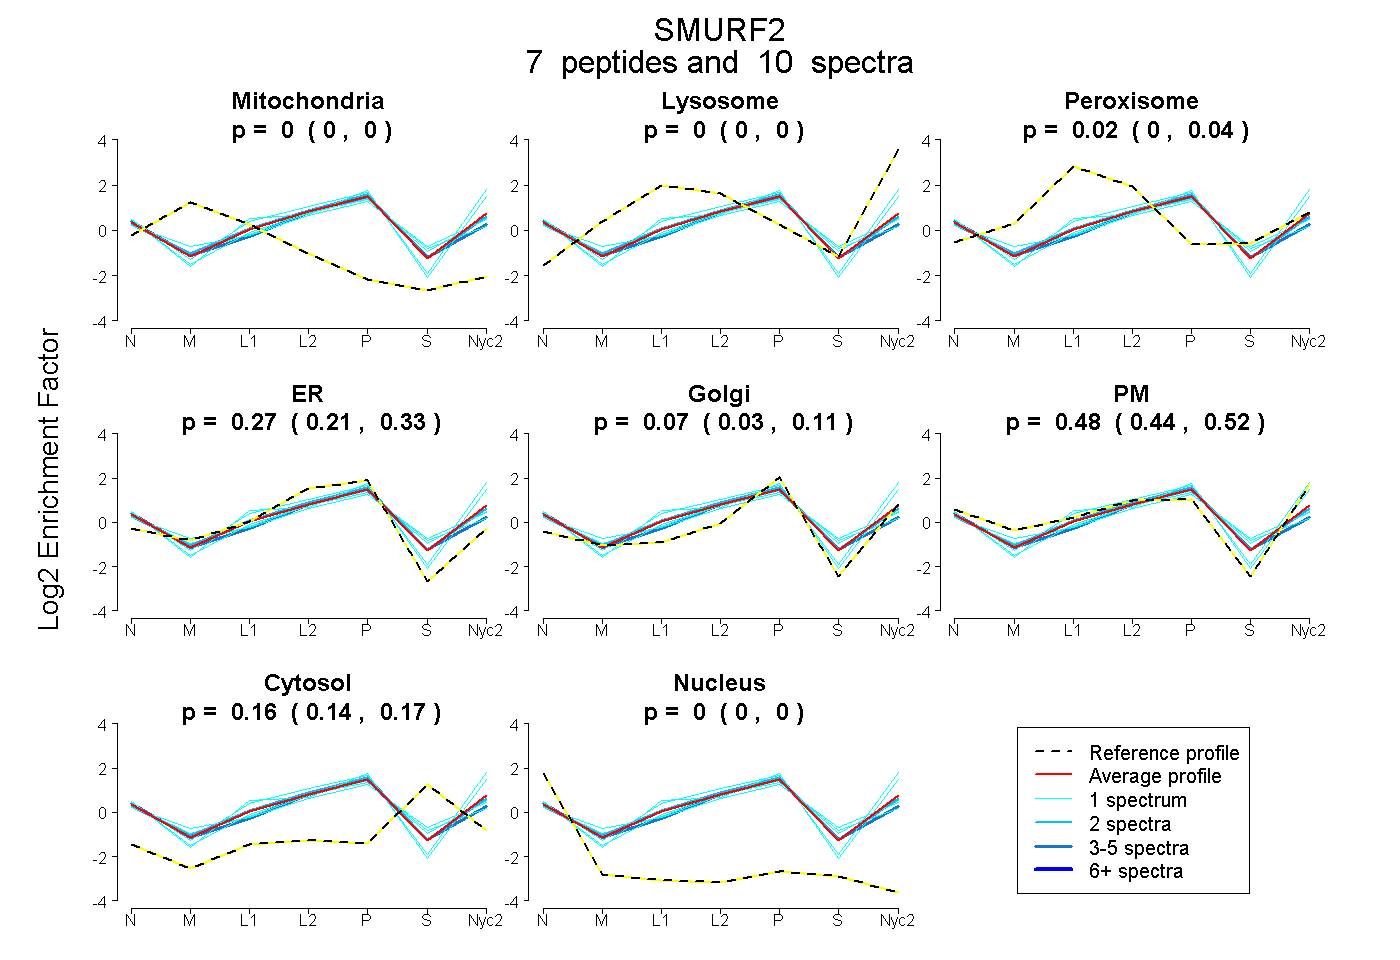
0.000 | 0.000
0.000 | 0.000
0.000 | 0.041
0.206 | 0.326
0.027 | 0.111
0.442 | 0.518
0.141 | 0.175
0.000 | 0.000
2peptides
spectra
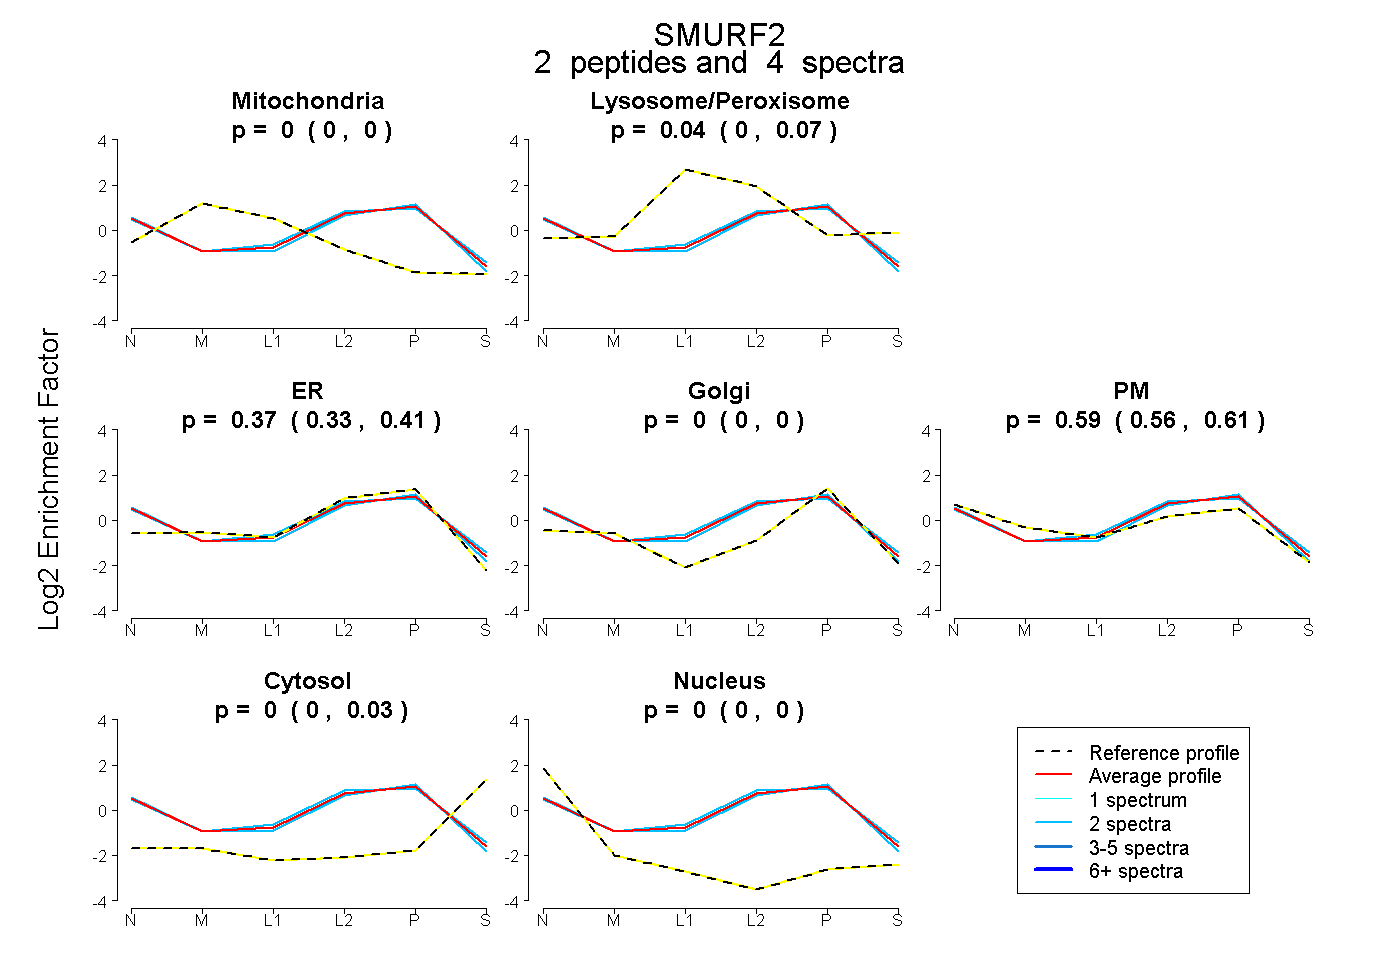
0.000 | 0.000
0.000 | 0.072
0.327 | 0.410
0.000 | 0.000
0.558 | 0.610
0.000 | 0.027
0.000 | 0.000
4peptides
spectra
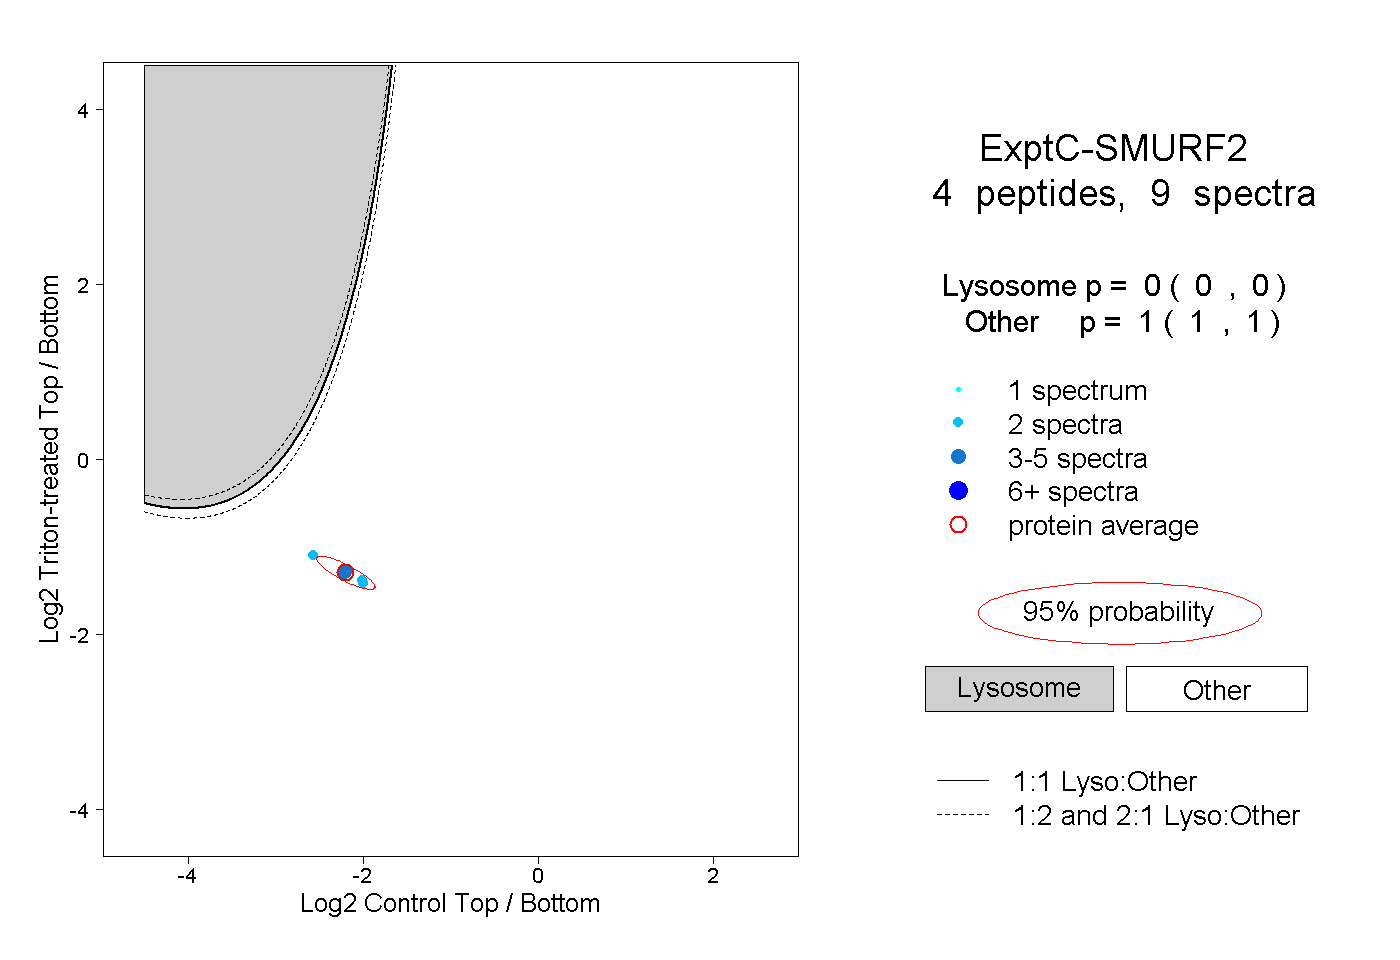
0.000 | 0.000
1.000 | 1.000
1peptide
spectra
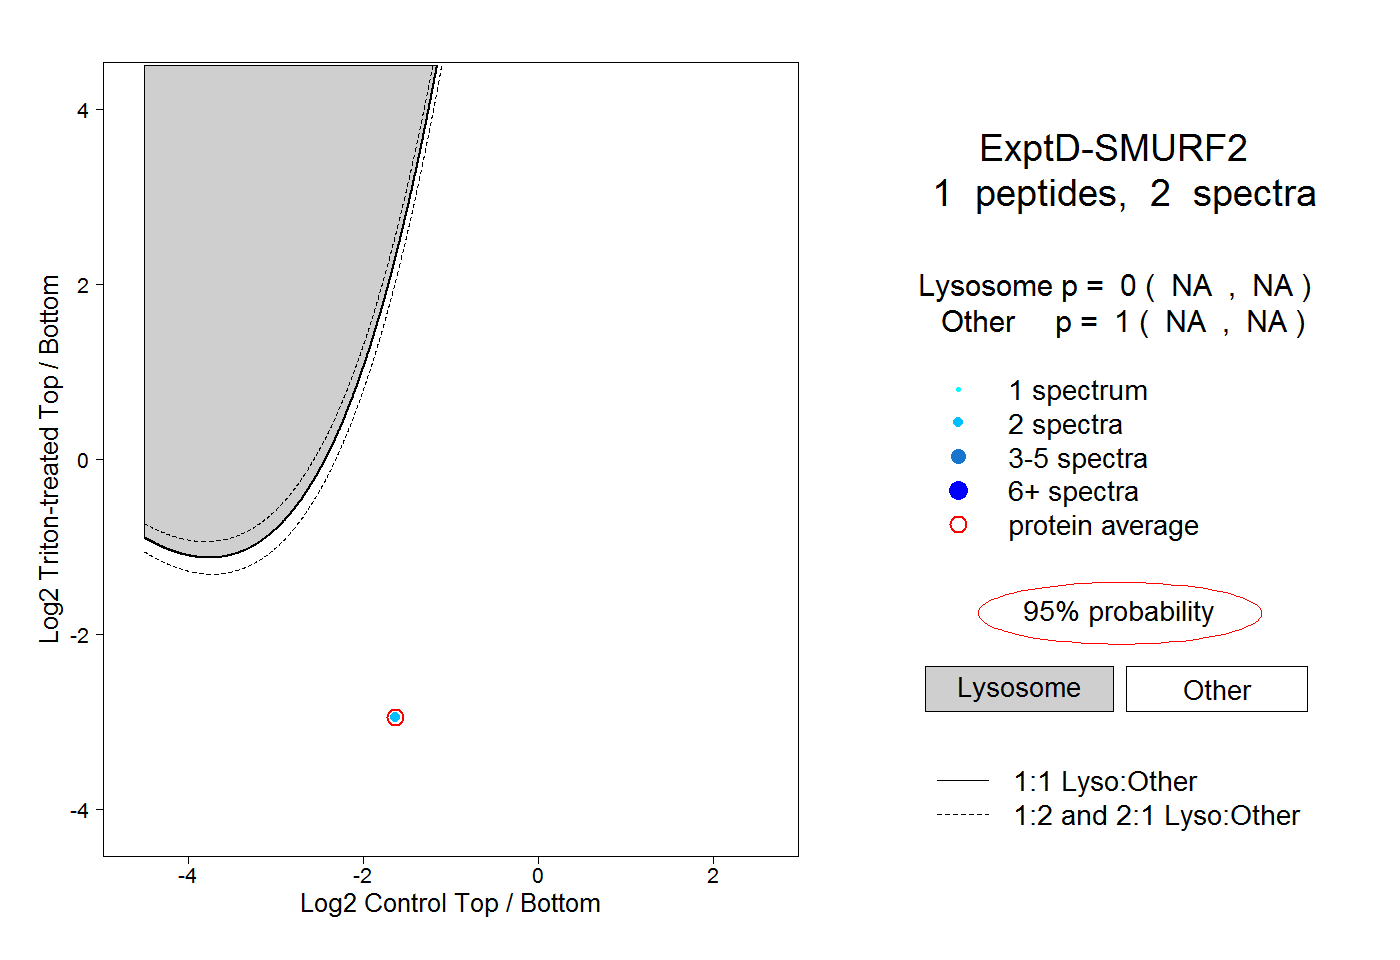
NA | NA
NA | NA