 7
7peptides
spectra
0.000 | 0.000
0.000 | 0.000
0.000 | 0.041
0.206 | 0.326
0.027 | 0.111
0.442 | 0.518
0.141 | 0.175
0.000 | 0.000
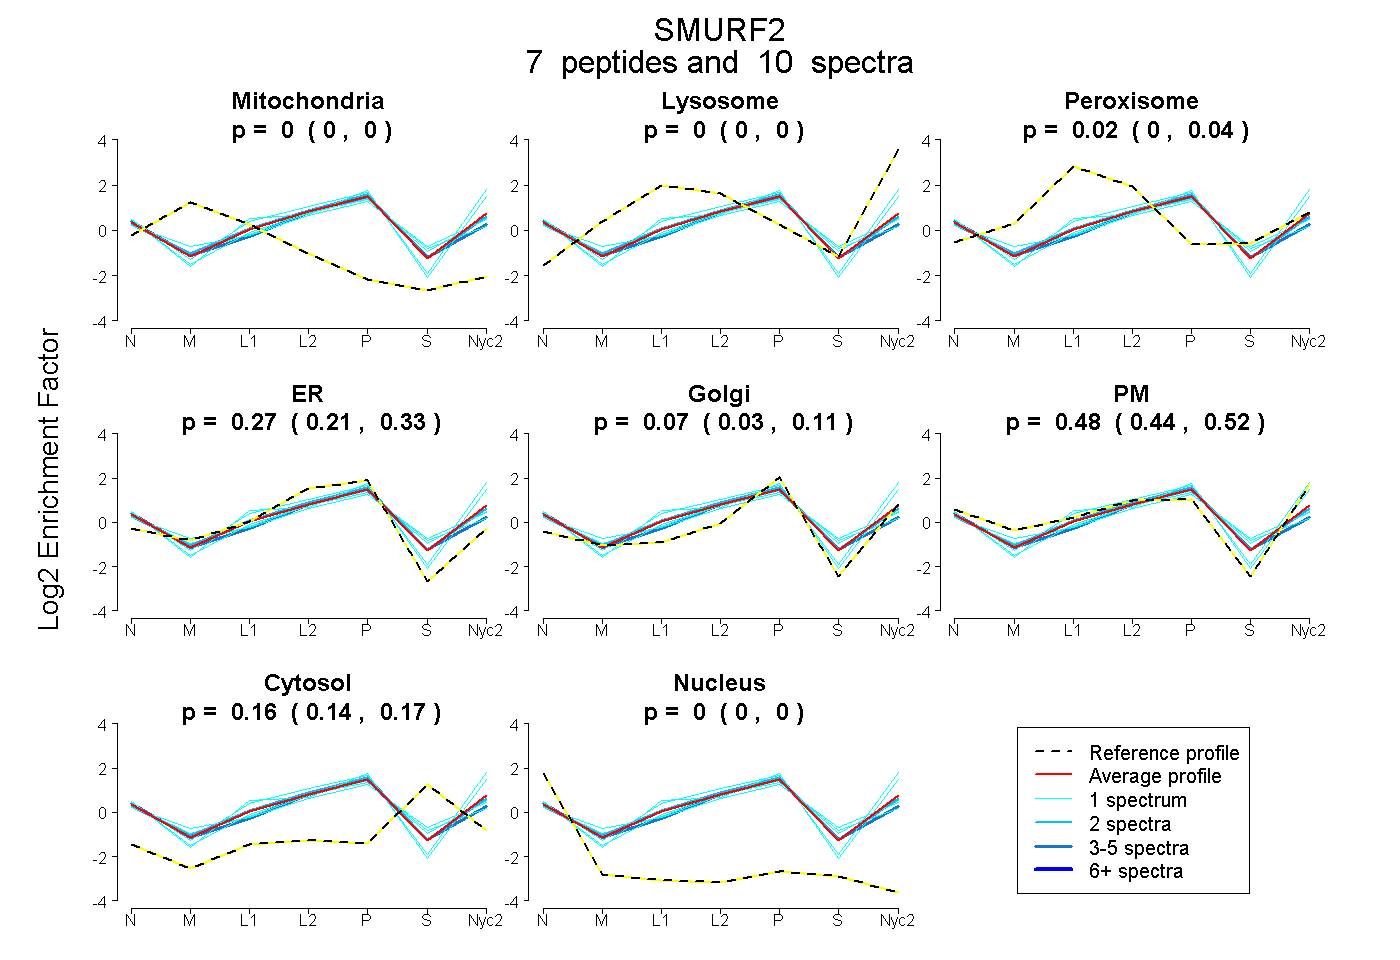
| Plot | Mito | Lyso | Perox | ER | Golgi | PM | Cytosol | Nucleus | |||||
| Expt A |
7 peptides |
10 spectra |
|
0.000 0.000 | 0.000 |
0.000 0.000 | 0.000 |
0.017 0.000 | 0.041 |
0.269 0.206 | 0.326 |
0.069 0.027 | 0.111 |
0.485 0.442 | 0.518 |
0.159 0.141 | 0.175 |
0.000 0.000 | 0.000 |
| 1 spectrum, EEIFEESYR | 0.000 | 0.000 | 0.000 | 0.404 | 0.000 | 0.332 | 0.264 | 0.000 | ||
| 1 spectrum, GQIVVSLQSR | 0.000 | 0.077 | 0.000 | 0.054 | 0.176 | 0.683 | 0.010 | 0.000 | ||
| 3 spectra, ALQGAAGPR | 0.000 | 0.000 | 0.000 | 0.427 | 0.044 | 0.328 | 0.201 | 0.000 | ||
| 1 spectrum, IGTGGQVVDCSR | 0.000 | 0.000 | 0.053 | 0.029 | 0.330 | 0.584 | 0.005 | 0.000 | ||
| 2 spectra, IDVSDWK | 0.000 | 0.000 | 0.072 | 0.312 | 0.127 | 0.354 | 0.135 | 0.000 | ||
| 1 spectrum, AVELFDEER | 0.000 | 0.000 | 0.029 | 0.290 | 0.072 | 0.401 | 0.208 | 0.000 | ||
| 1 spectrum, LYVNWR | 0.000 | 0.000 | 0.087 | 0.209 | 0.129 | 0.350 | 0.226 | 0.000 |
| Plot | Mito | Lyso or Perox | ER | Golgi | PM | Cytosol | Nucleus | ||||||
| Expt B |
2 peptides |
4 spectra |
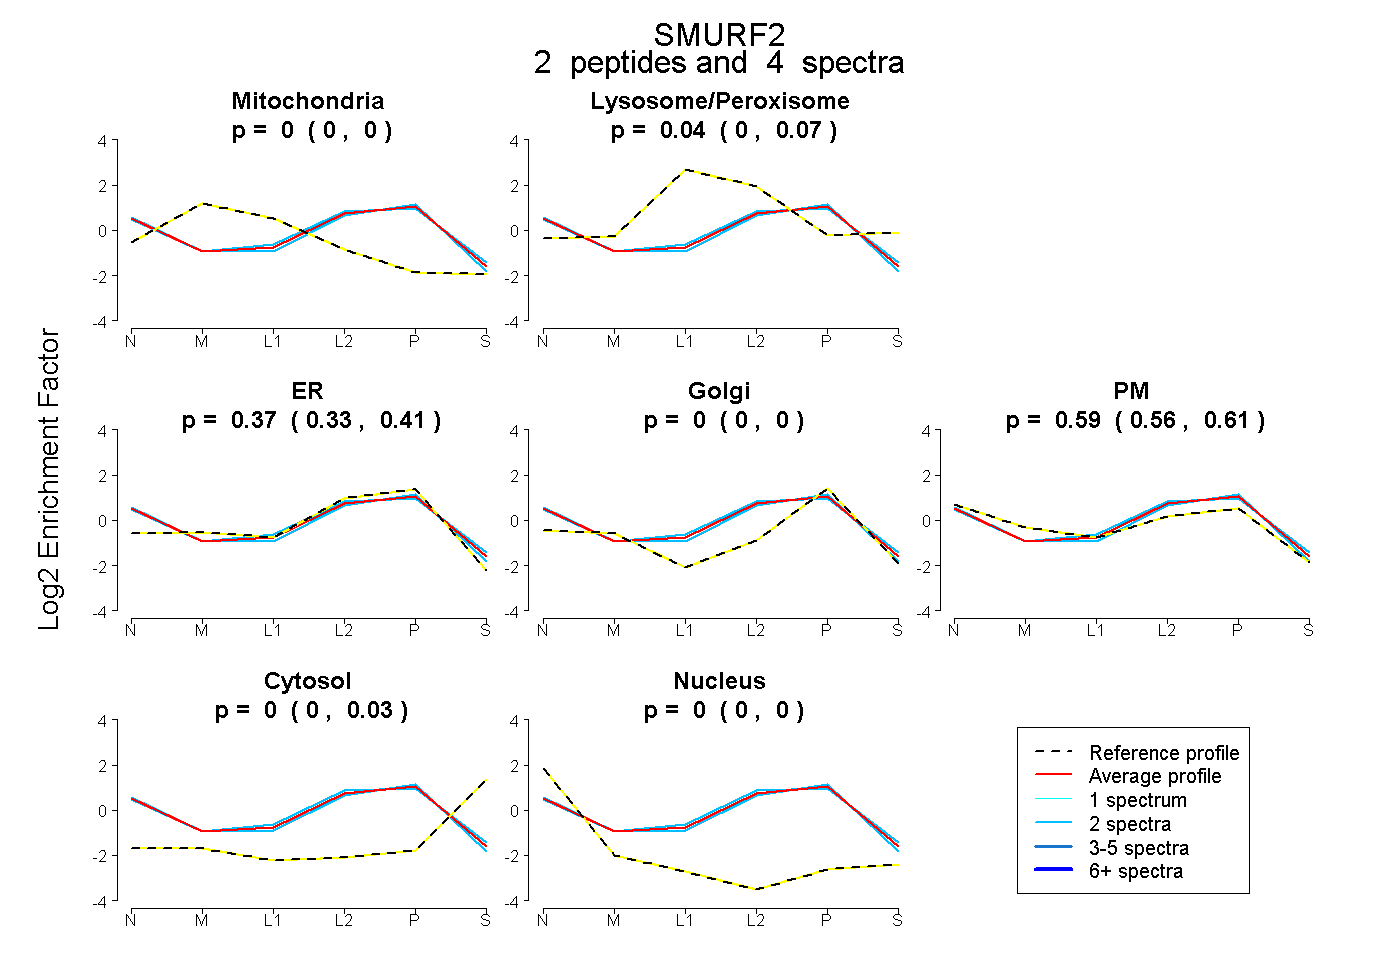 |
0.000 0.000 | 0.000 |
0.036 0.000 | 0.072 |
0.367 0.327 | 0.410 |
0.000 0.000 | 0.000 |
0.595 0.558 | 0.610 |
0.002 0.000 | 0.027 |
0.000 0.000 | 0.000 |
|||
| Plot | Lyso | Other | |||||||||||
| Expt C |
4 peptides |
9 spectra |
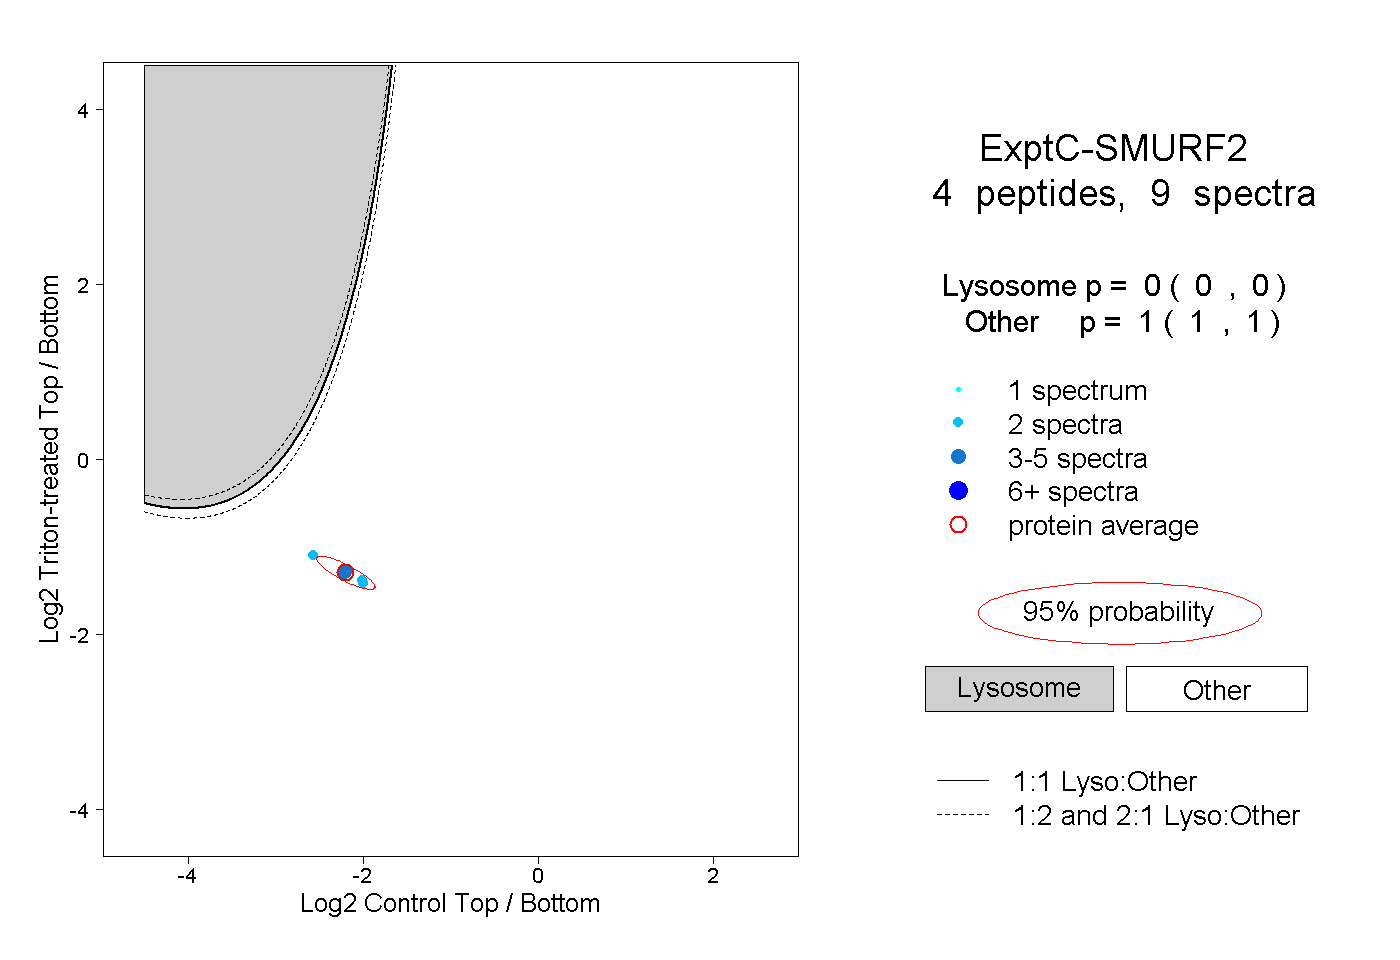 |
0.000 0.000 | 0.000 |
1.000 1.000 | 1.000 |
||||||||
| Plot | Lyso | Other | |||||||||||
| Expt D |
1 peptide |
2 spectra |
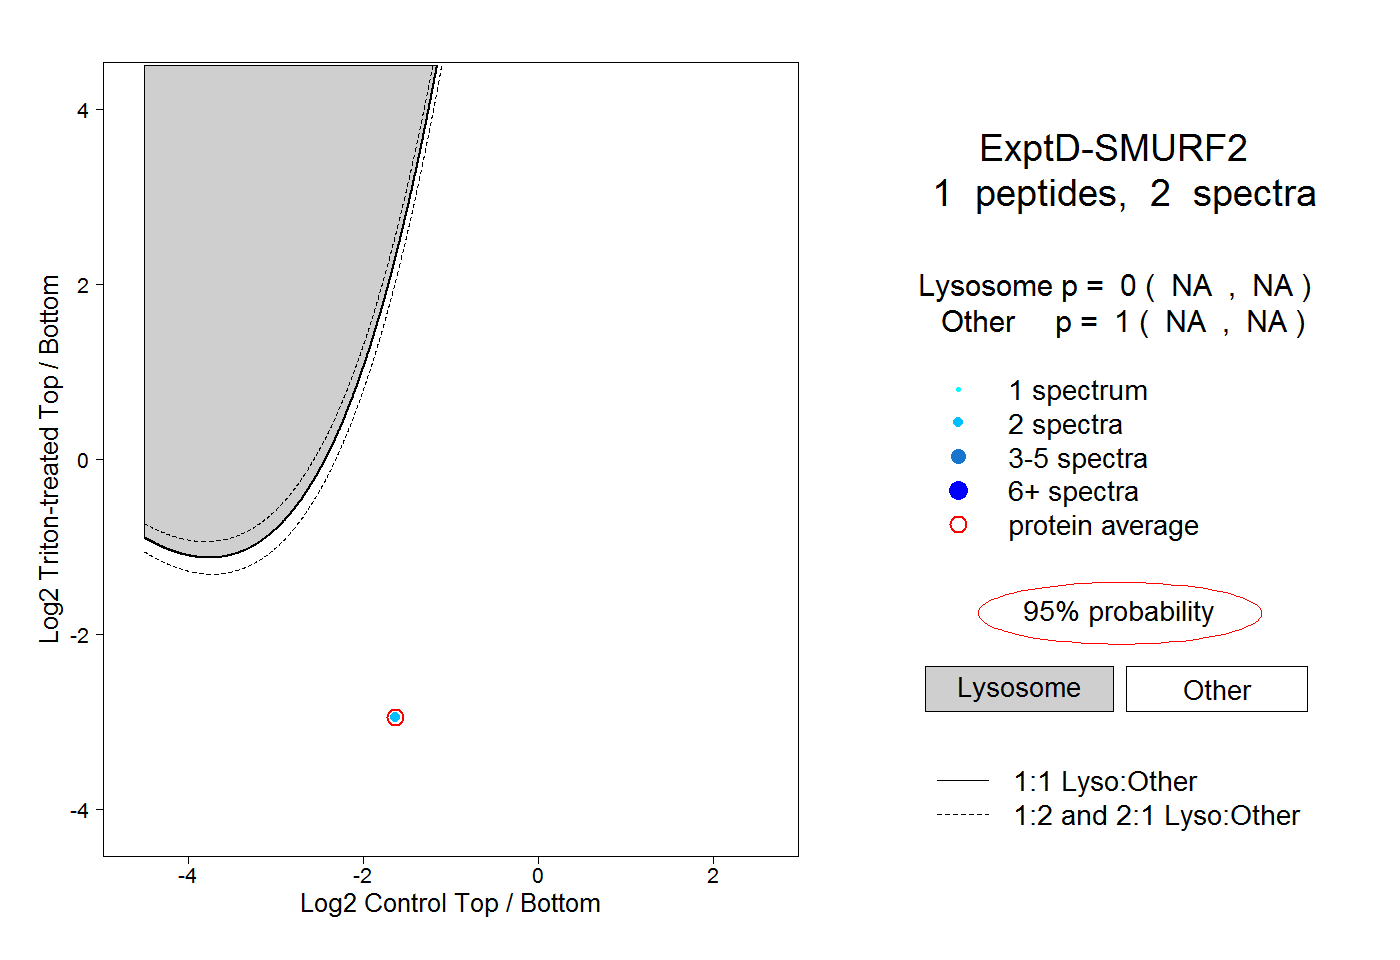 |
0.000 NA | NA |
1.000 NA | NA |