 6
6peptides
spectra
0.000 | 0.000
0.000 | 0.000
0.000 | 0.012
0.265 | 0.429
0.000 | 0.149
0.000 | 0.000
0.545 | 0.589
0.000 | 0.000
4peptides
spectra
0.000 | 0.000
1.000 | 1.000
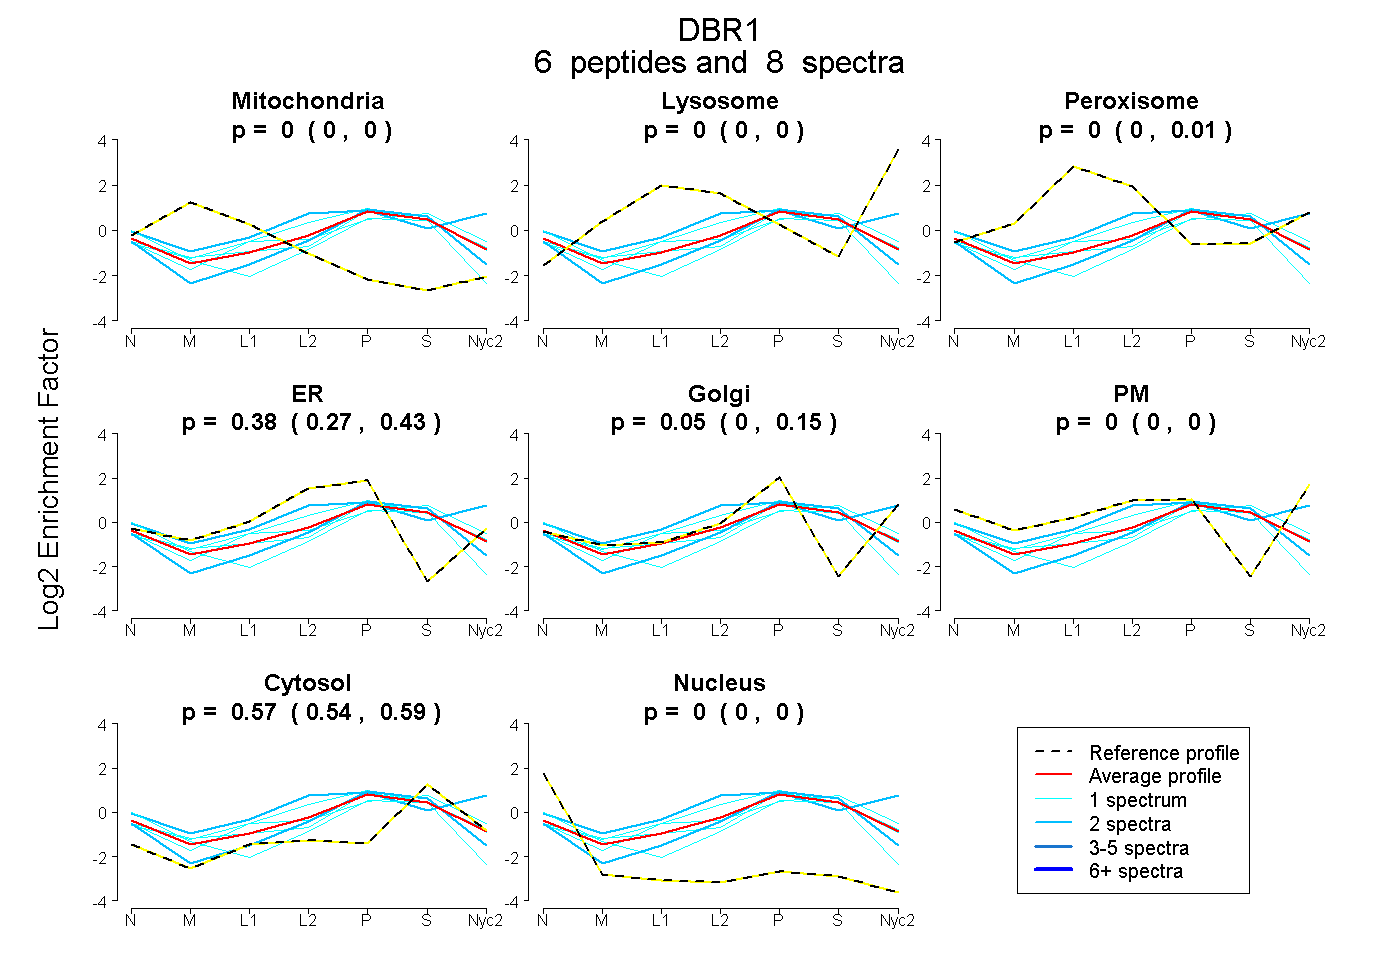
| Plot | Mito | Lyso | Perox | ER | Golgi | PM | Cytosol | Nucleus | |||||
| Expt A |
6 peptides |
8 spectra |
|
0.000 0.000 | 0.000 |
0.000 0.000 | 0.000 |
0.000 0.000 | 0.012 |
0.375 0.265 | 0.429 |
0.051 0.000 | 0.149 |
0.000 0.000 | 0.000 |
0.573 0.545 | 0.589 |
0.000 0.000 | 0.000 |
||
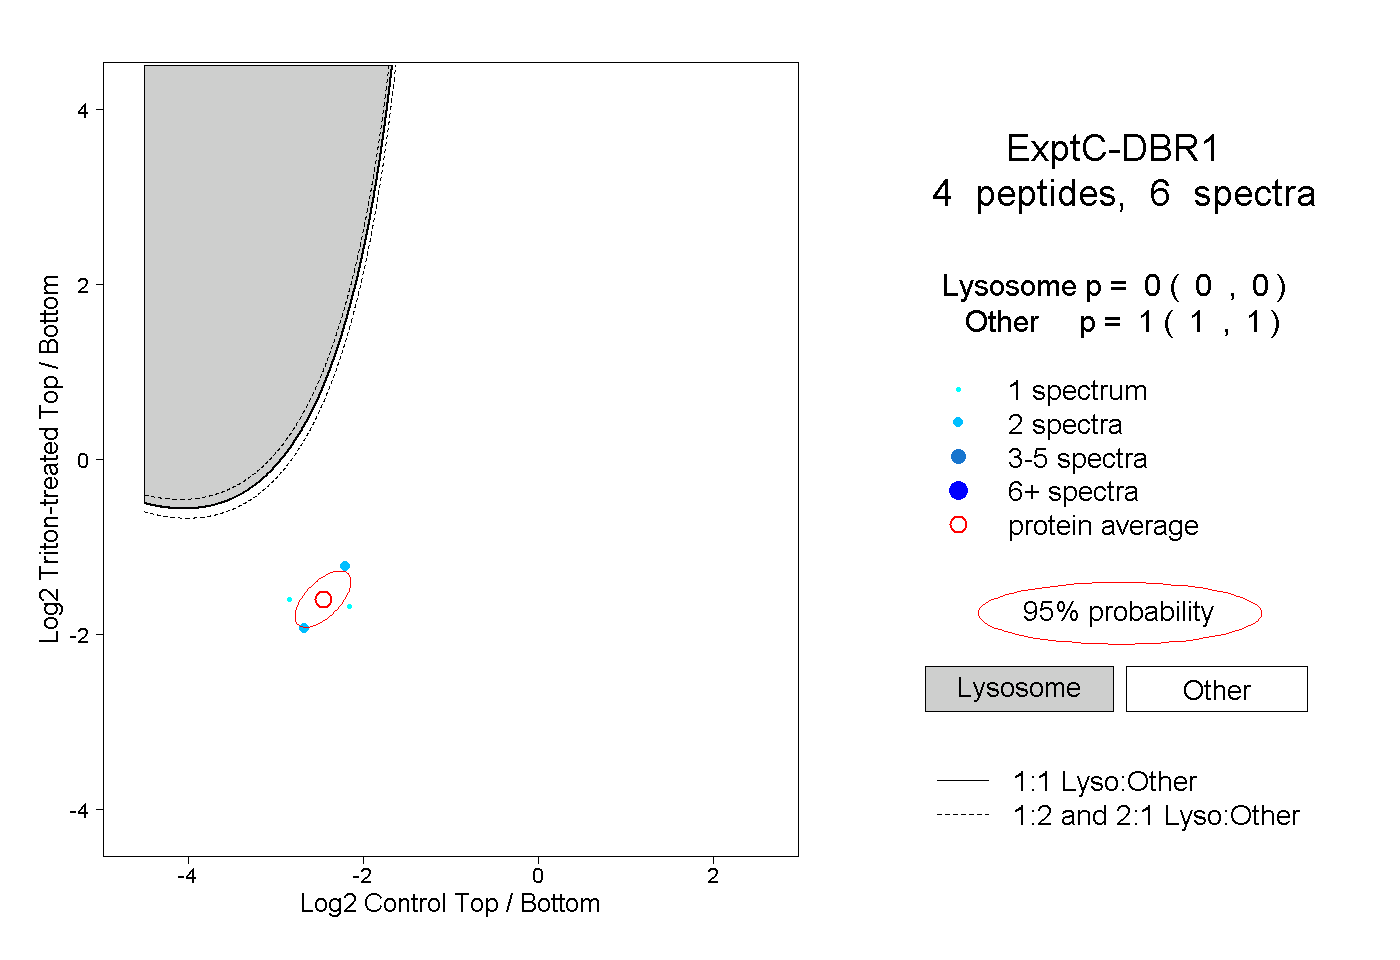
| Plot | Lyso | Other | |||||||||||
| Expt C |
4 peptides |
6 spectra |
|
0.000 0.000 | 0.000 |
1.000 1.000 | 1.000 |