 6
6peptides
spectra
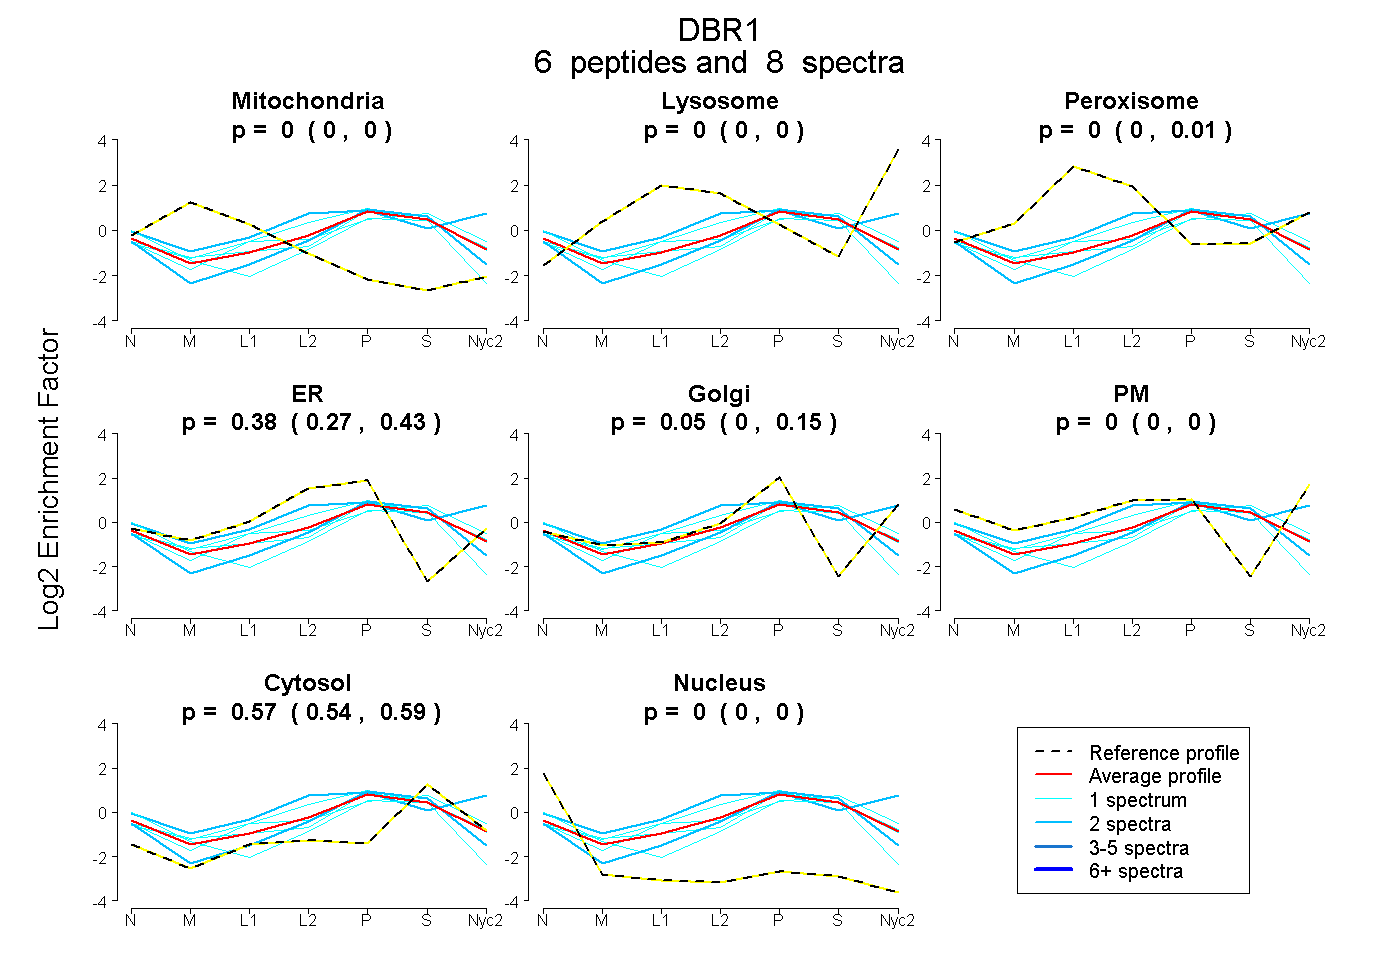
0.000 | 0.000
0.000 | 0.000
0.000 | 0.012
0.265 | 0.429
0.000 | 0.149
0.000 | 0.000
0.545 | 0.589
0.000 | 0.000
| Plot | Mito | Lyso | Perox | ER | Golgi | PM | Cytosol | Nucleus | |||||
| Expt A |
6 peptides |
8 spectra |
|
0.000 0.000 | 0.000 |
0.000 0.000 | 0.000 |
0.000 0.000 | 0.012 |
0.375 0.265 | 0.429 |
0.051 0.000 | 0.149 |
0.000 0.000 | 0.000 |
0.573 0.545 | 0.589 |
0.000 0.000 | 0.000 |
| 2 spectra, LSNEHEPEQR | 0.000 | 0.086 | 0.060 | 0.136 | 0.000 | 0.365 | 0.354 | 0.000 | ||
| 1 spectrum, ISPQTTK | 0.000 | 0.000 | 0.000 | 0.230 | 0.200 | 0.000 | 0.570 | 0.000 | ||
| 1 spectrum, HMQTFYR | 0.000 | 0.000 | 0.066 | 0.443 | 0.000 | 0.000 | 0.491 | 0.000 | ||
| 1 spectrum, GHFECPPYNSSTIR | 0.000 | 0.000 | 0.102 | 0.173 | 0.126 | 0.000 | 0.599 | 0.000 | ||
| 2 spectra, QPVHIFLSHDWPR | 0.000 | 0.000 | 0.000 | 0.318 | 0.008 | 0.000 | 0.651 | 0.023 | ||
| 1 spectrum, NIYHYGNK | 0.000 | 0.000 | 0.000 | 0.286 | 0.000 | 0.000 | 0.530 | 0.183 |
| Plot | Lyso | Other | |||||||||||
| Expt C |
4 peptides |
6 spectra |
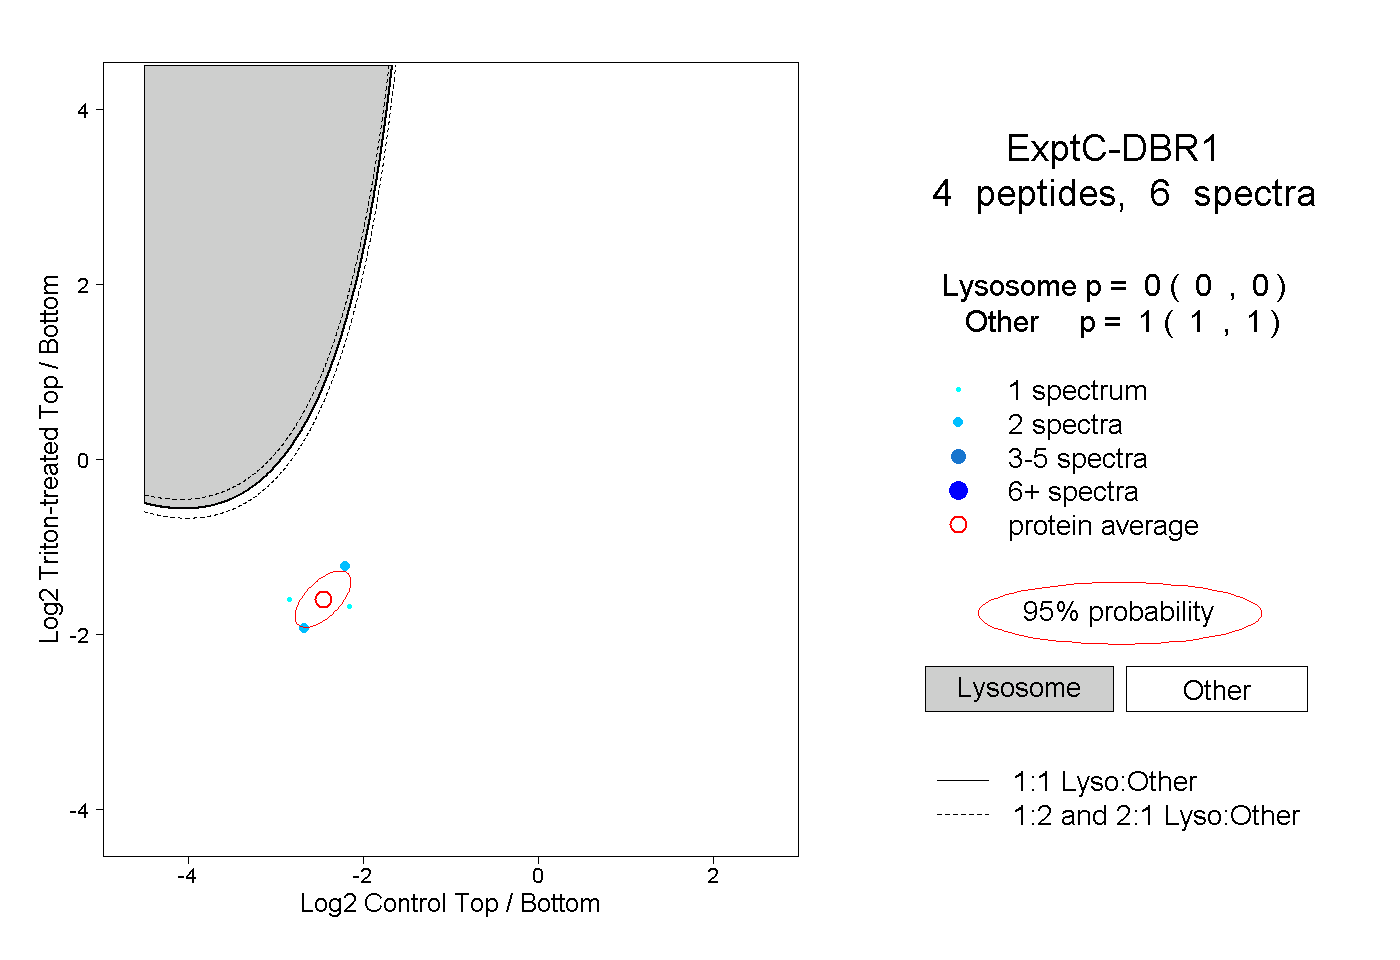 |
0.000 0.000 | 0.000 |
1.000 1.000 | 1.000 |