 5
5peptides
spectra
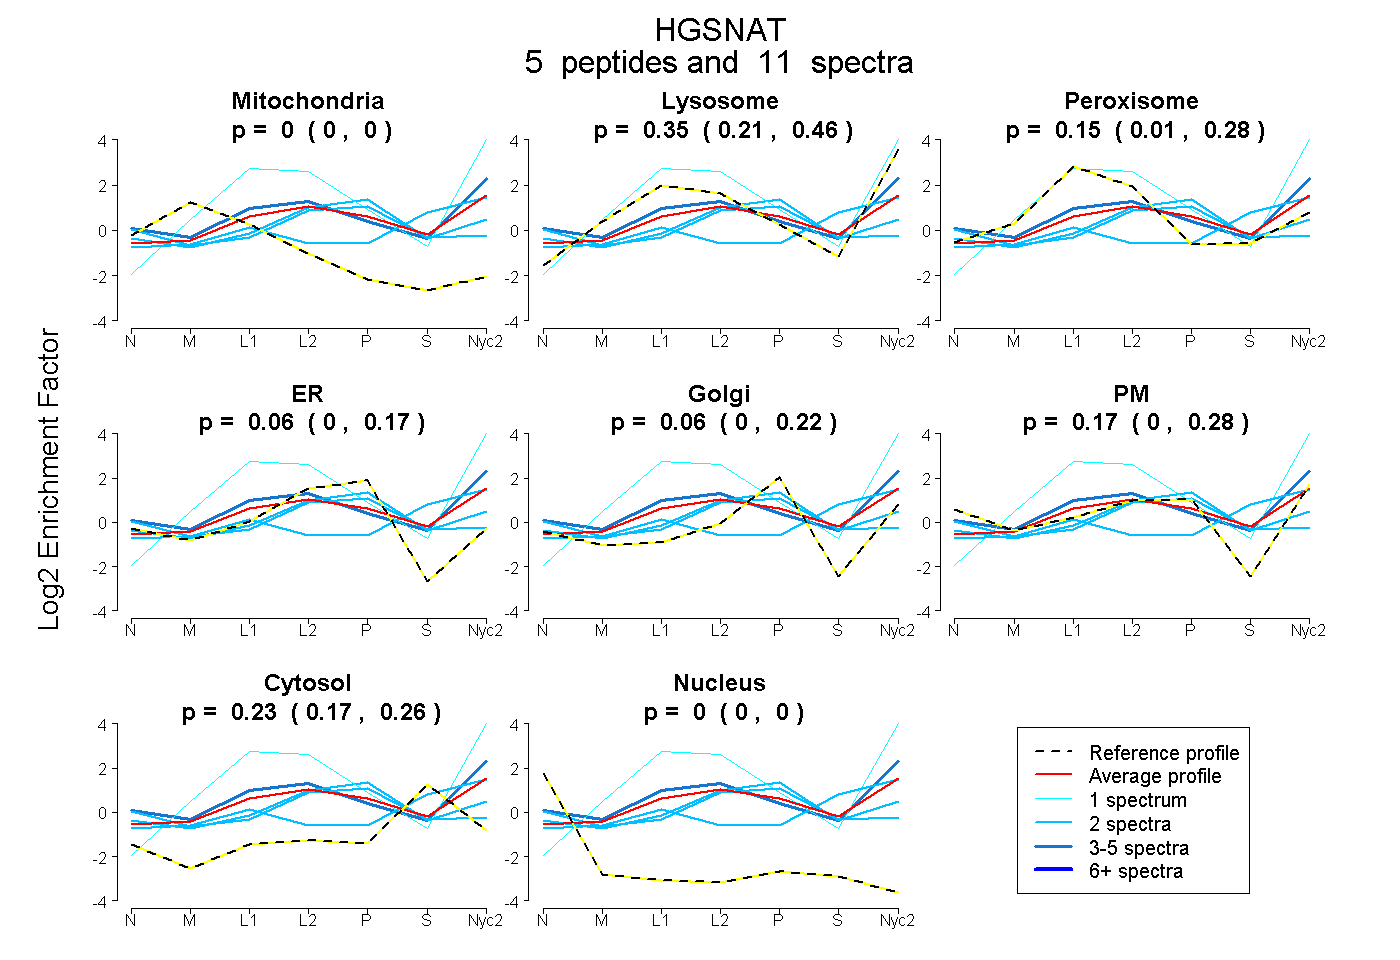
0.000 | 0.000
0.213 | 0.455
0.012 | 0.276
0.000 | 0.175
0.000 | 0.224
0.000 | 0.278
0.174 | 0.261
0.000 | 0.000
2peptides
spectra
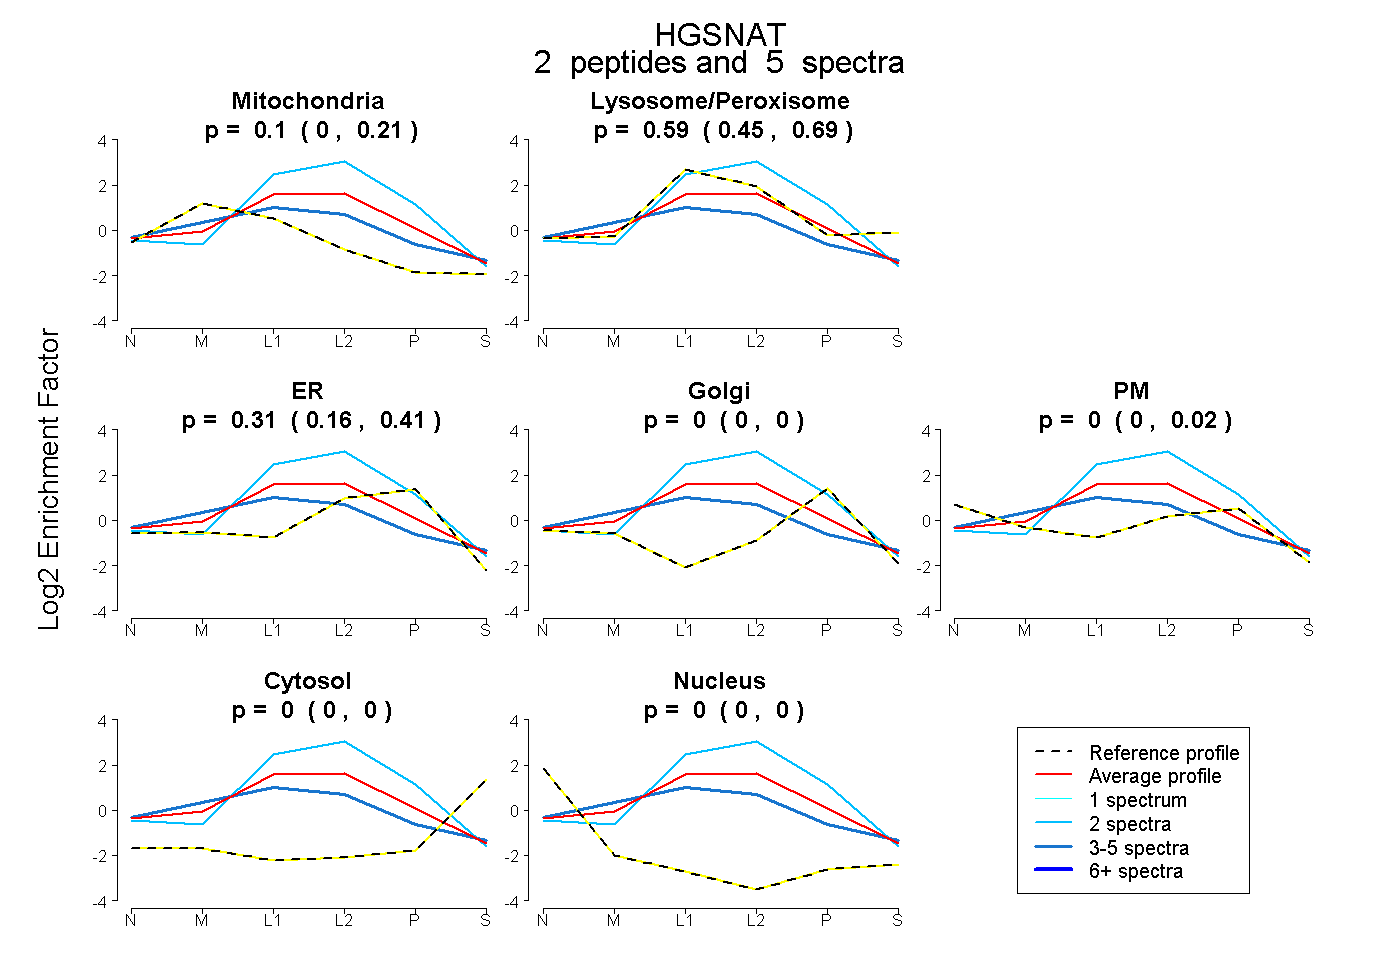
0.000 | 0.211
0.449 | 0.689
0.165 | 0.409
0.000 | 0.000
0.000 | 0.024
0.000 | 0.000
0.000 | 0.000
8peptides
spectra
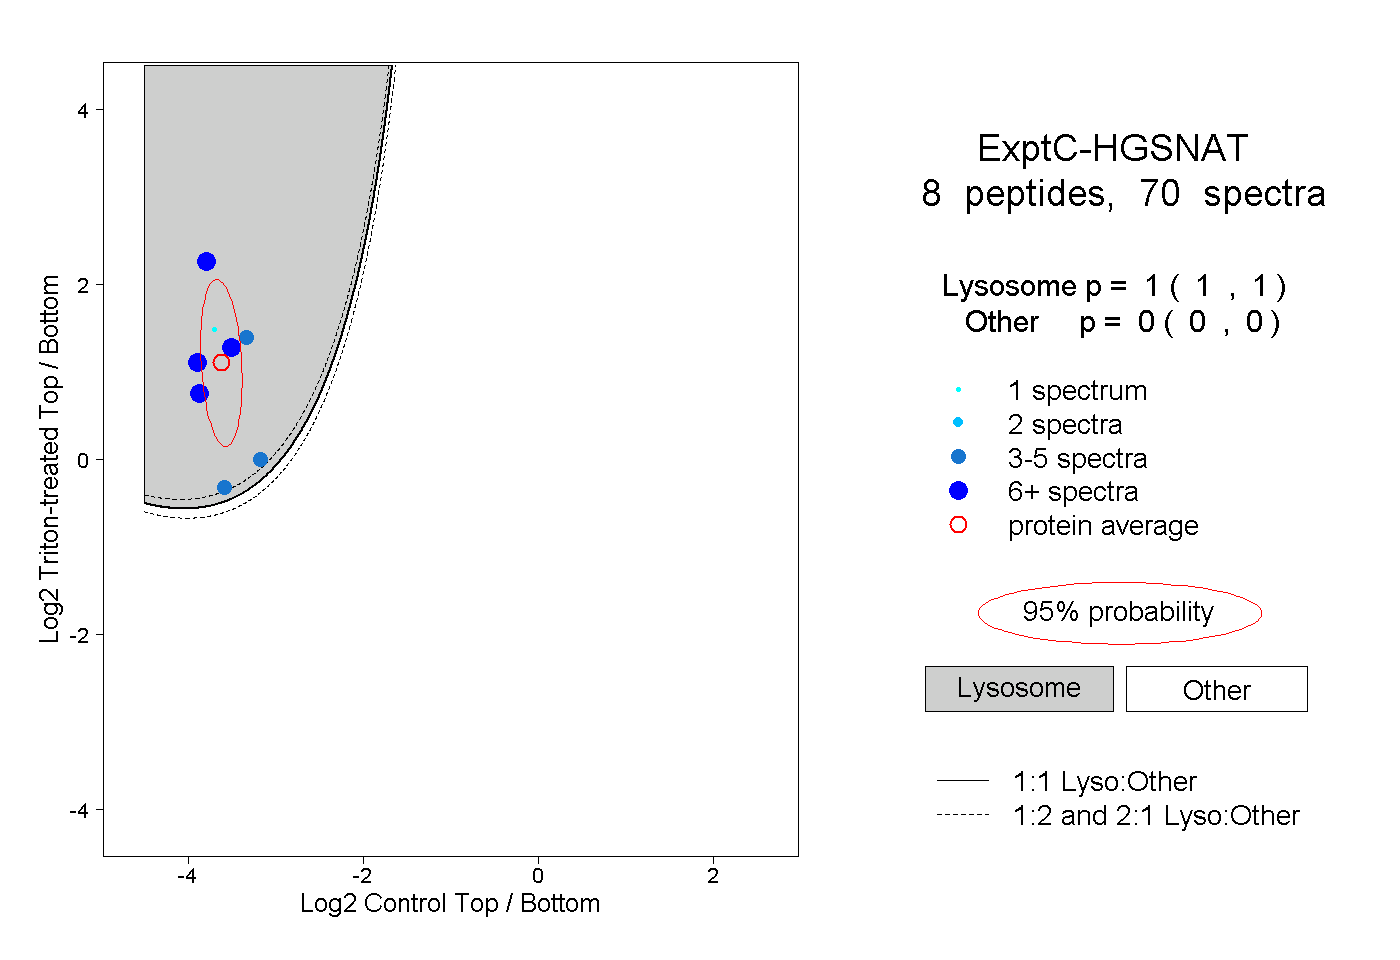
1.000 | 1.000
0.000 | 0.000
2peptides
spectra
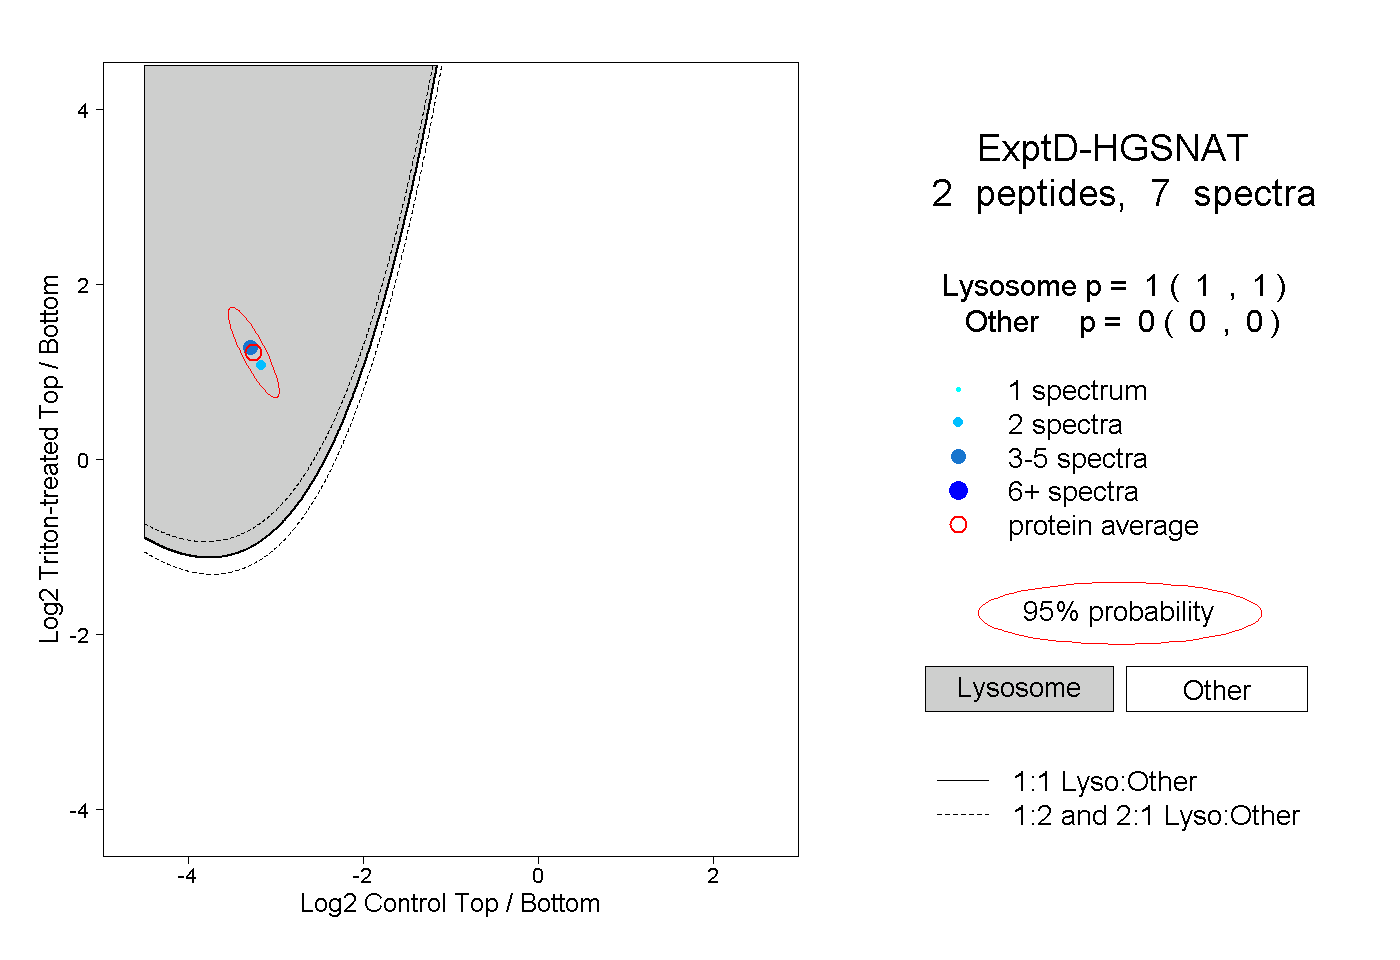
1.000 | 1.000
0.000 | 0.000