 5
5peptides
spectra
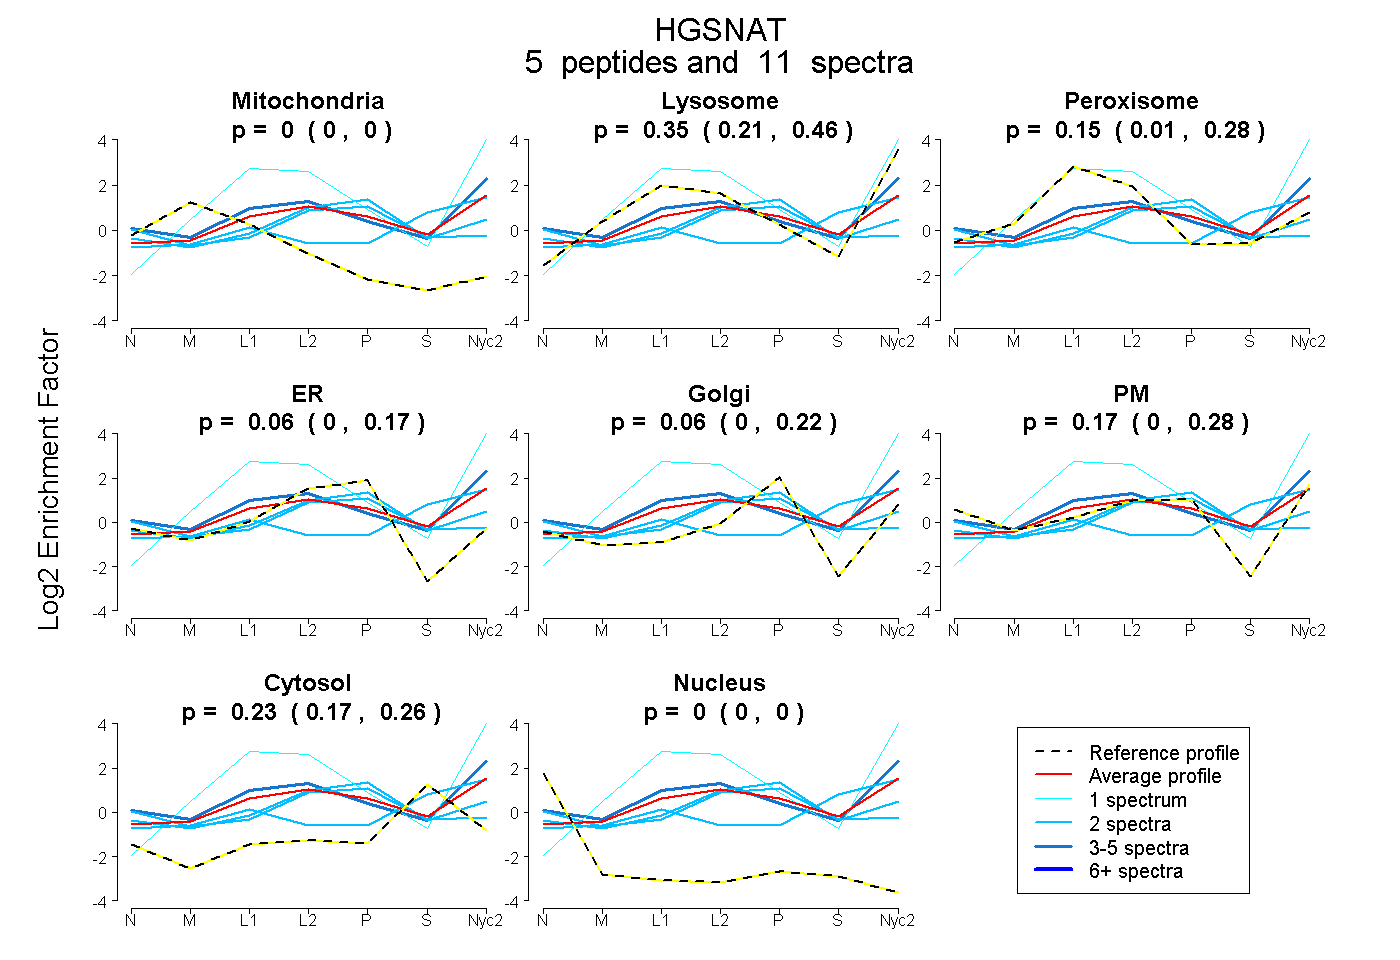
0.000 | 0.000
0.213 | 0.455
0.012 | 0.276
0.000 | 0.175
0.000 | 0.224
0.000 | 0.278
0.174 | 0.261
0.000 | 0.000
| Plot | Mito | Lyso | Perox | ER | Golgi | PM | Cytosol | Nucleus | |||||
| Expt A |
5 peptides |
11 spectra |
|
0.000 0.000 | 0.000 |
0.345 0.213 | 0.455 |
0.149 0.012 | 0.276 |
0.057 0.000 | 0.175 |
0.058 0.000 | 0.224 |
0.165 0.000 | 0.278 |
0.226 0.174 | 0.261 |
0.000 0.000 | 0.000 |
| 4 spectra, ADPLGADCQPETR | 0.000 | 0.372 | 0.156 | 0.000 | 0.000 | 0.347 | 0.125 | 0.000 | ||
| 2 spectra, SSAAGAER | 0.000 | 0.000 | 0.126 | 0.466 | 0.000 | 0.108 | 0.300 | 0.000 | ||
| 2 spectra, AEPDLDEK | 0.000 | 0.146 | 0.083 | 0.386 | 0.136 | 0.014 | 0.235 | 0.000 | ||
| 1 spectrum, LINSELGSPSR | 0.000 | 1.000 | 0.000 | 0.000 | 0.000 | 0.000 | 0.000 | 0.000 | ||
| 2 spectra, YPHCTGGAAGYIDR | 0.003 | 0.447 | 0.000 | 0.000 | 0.000 | 0.003 | 0.546 | 0.000 |
| Plot | Mito | Lyso or Perox | ER | Golgi | PM | Cytosol | Nucleus | ||||||
| Expt B |
2 peptides |
5 spectra |
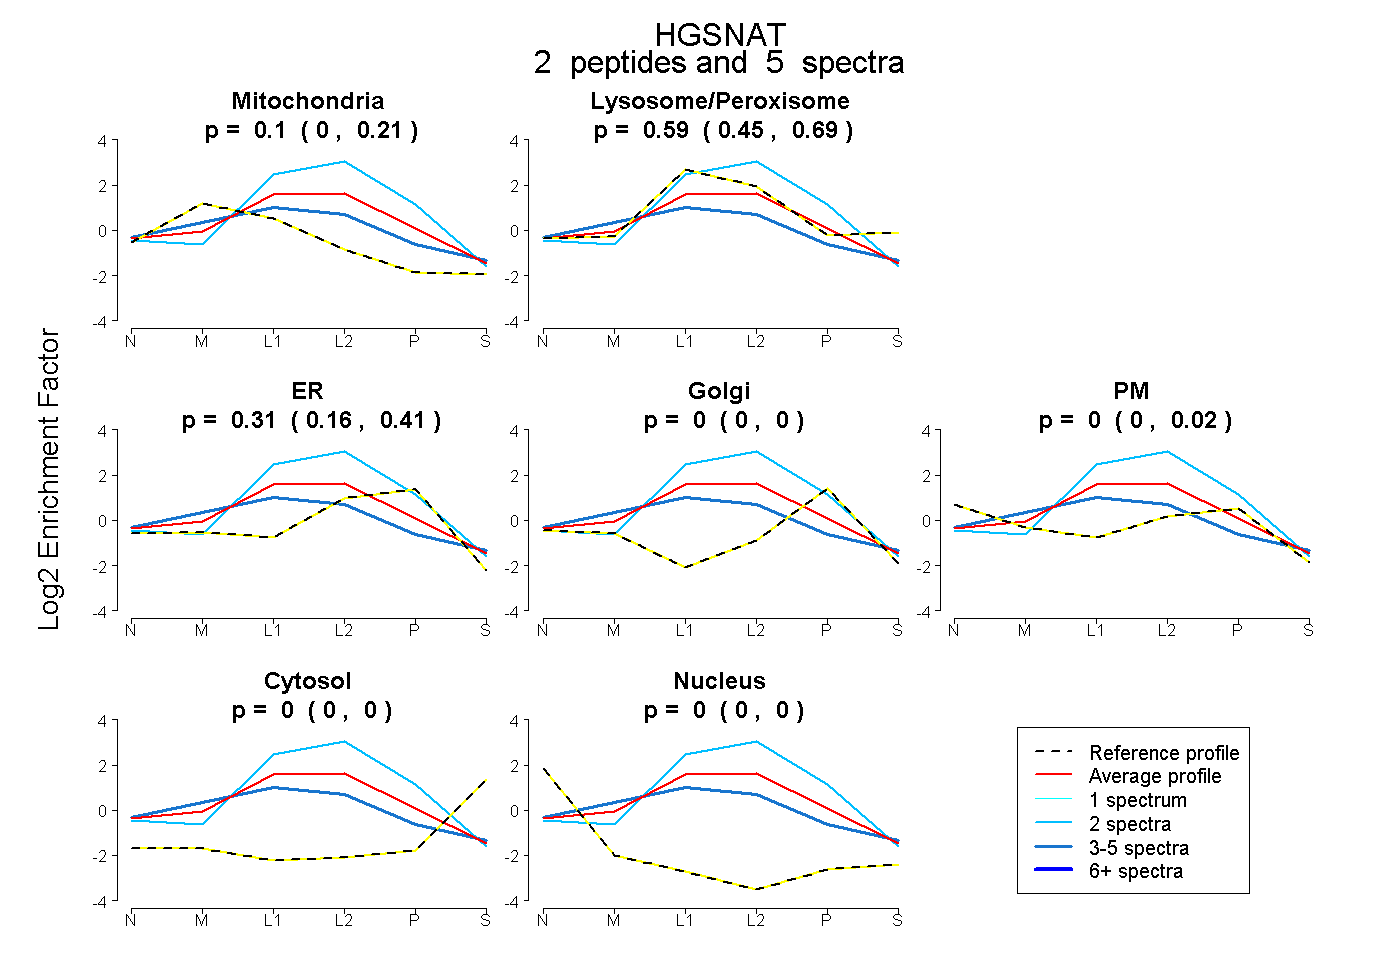 |
0.104 0.000 | 0.211 |
0.585 0.449 | 0.689 |
0.311 0.165 | 0.409 |
0.000 0.000 | 0.000 |
0.000 0.000 | 0.024 |
0.000 0.000 | 0.000 |
0.000 0.000 | 0.000 |
|||
| Plot | Lyso | Other | |||||||||||
| Expt C |
8 peptides |
70 spectra |
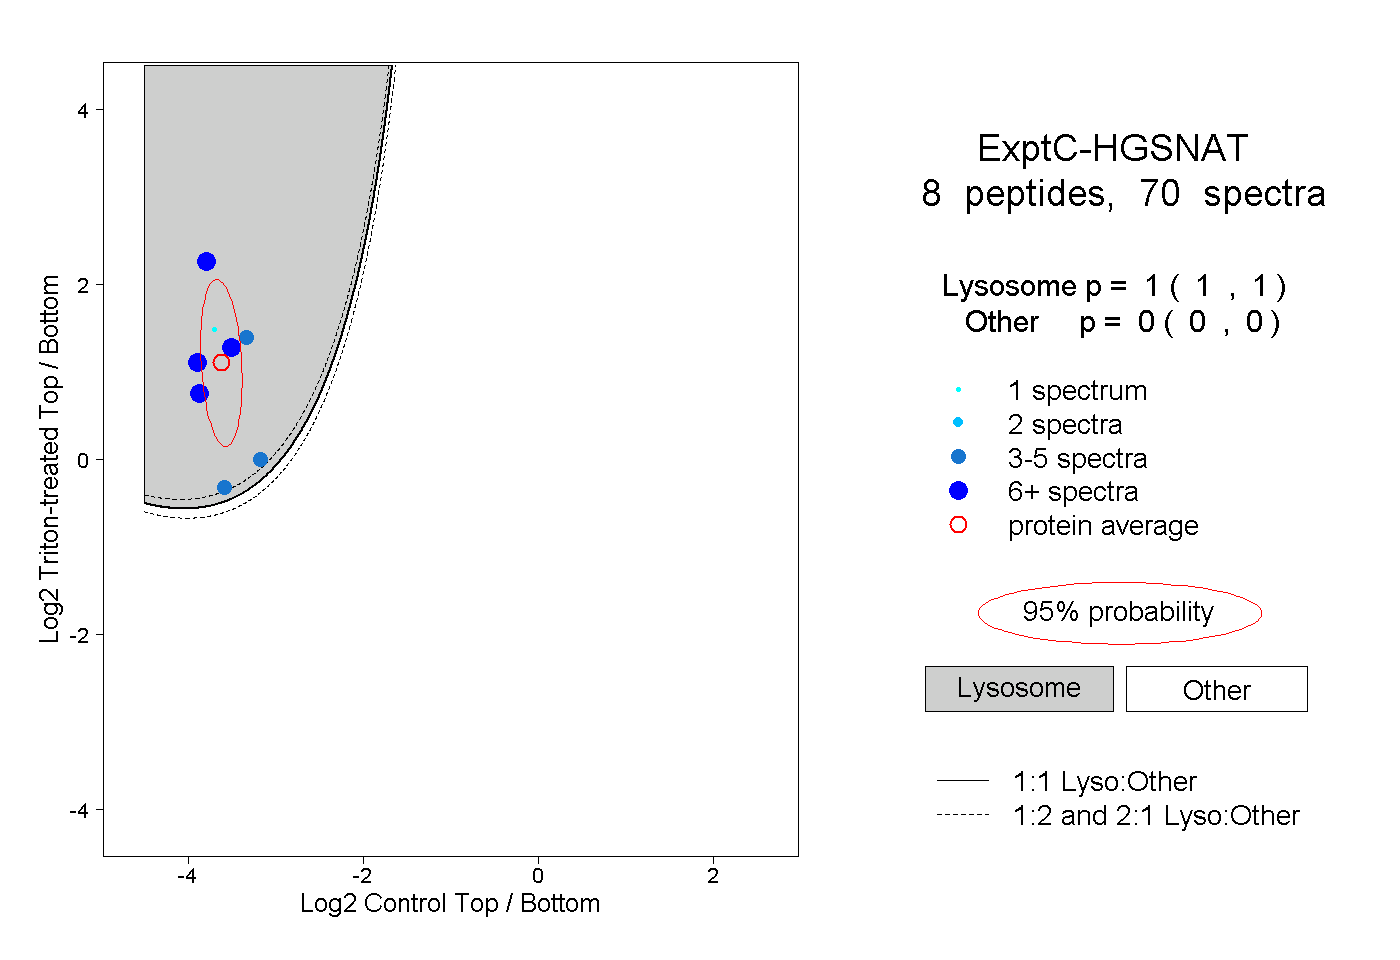 |
1.000 1.000 | 1.000 |
0.000 0.000 | 0.000 |
||||||||
| Plot | Lyso | Other | |||||||||||
| Expt D |
2 peptides |
7 spectra |
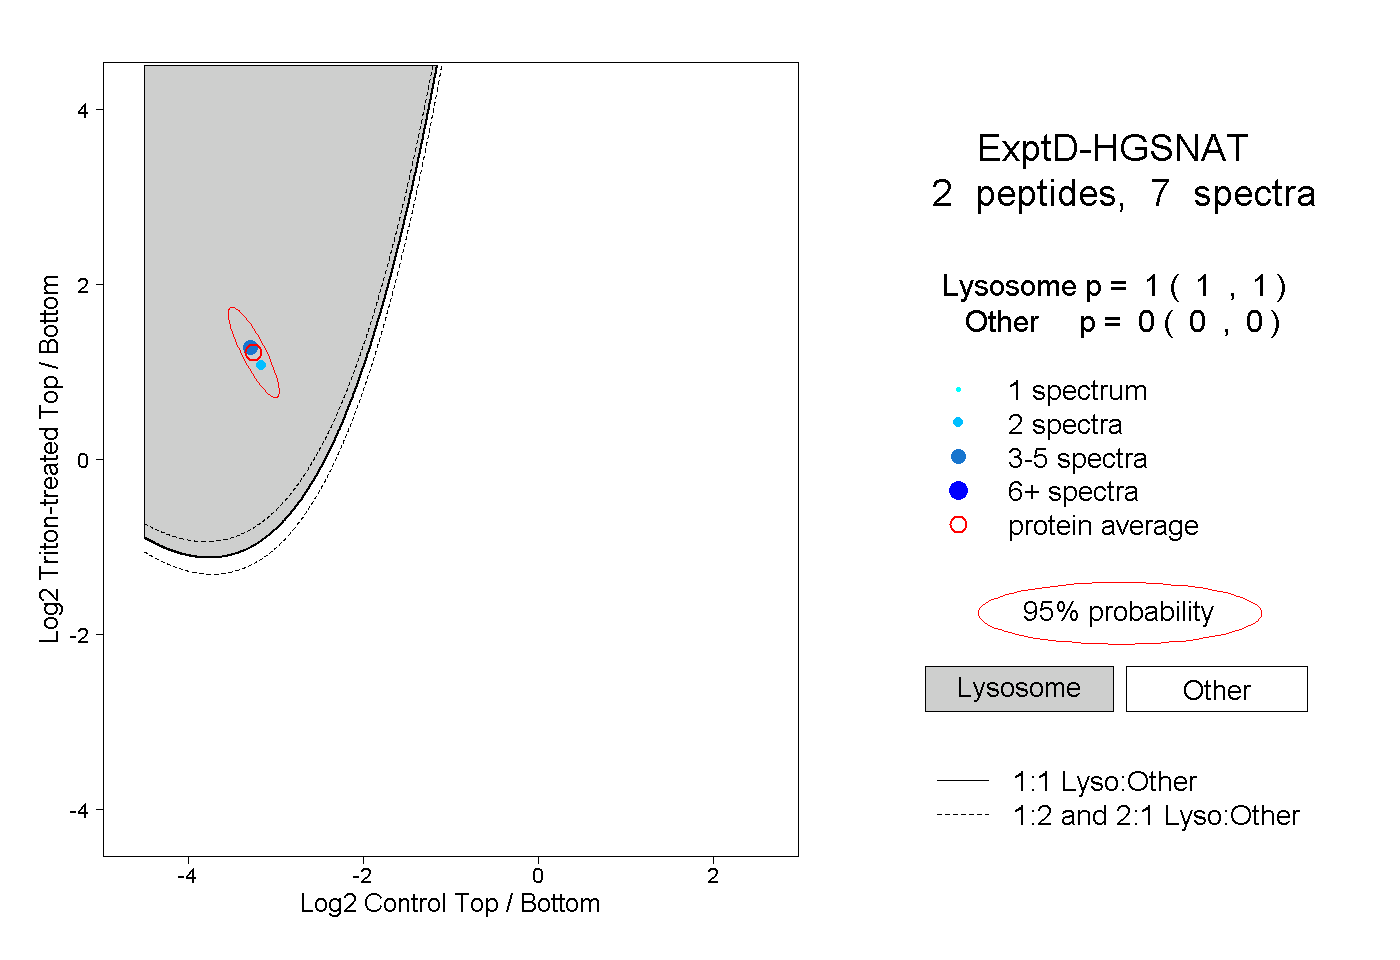 |
1.000 1.000 | 1.000 |
0.000 0.000 | 0.000 |