 6
6peptides
spectra
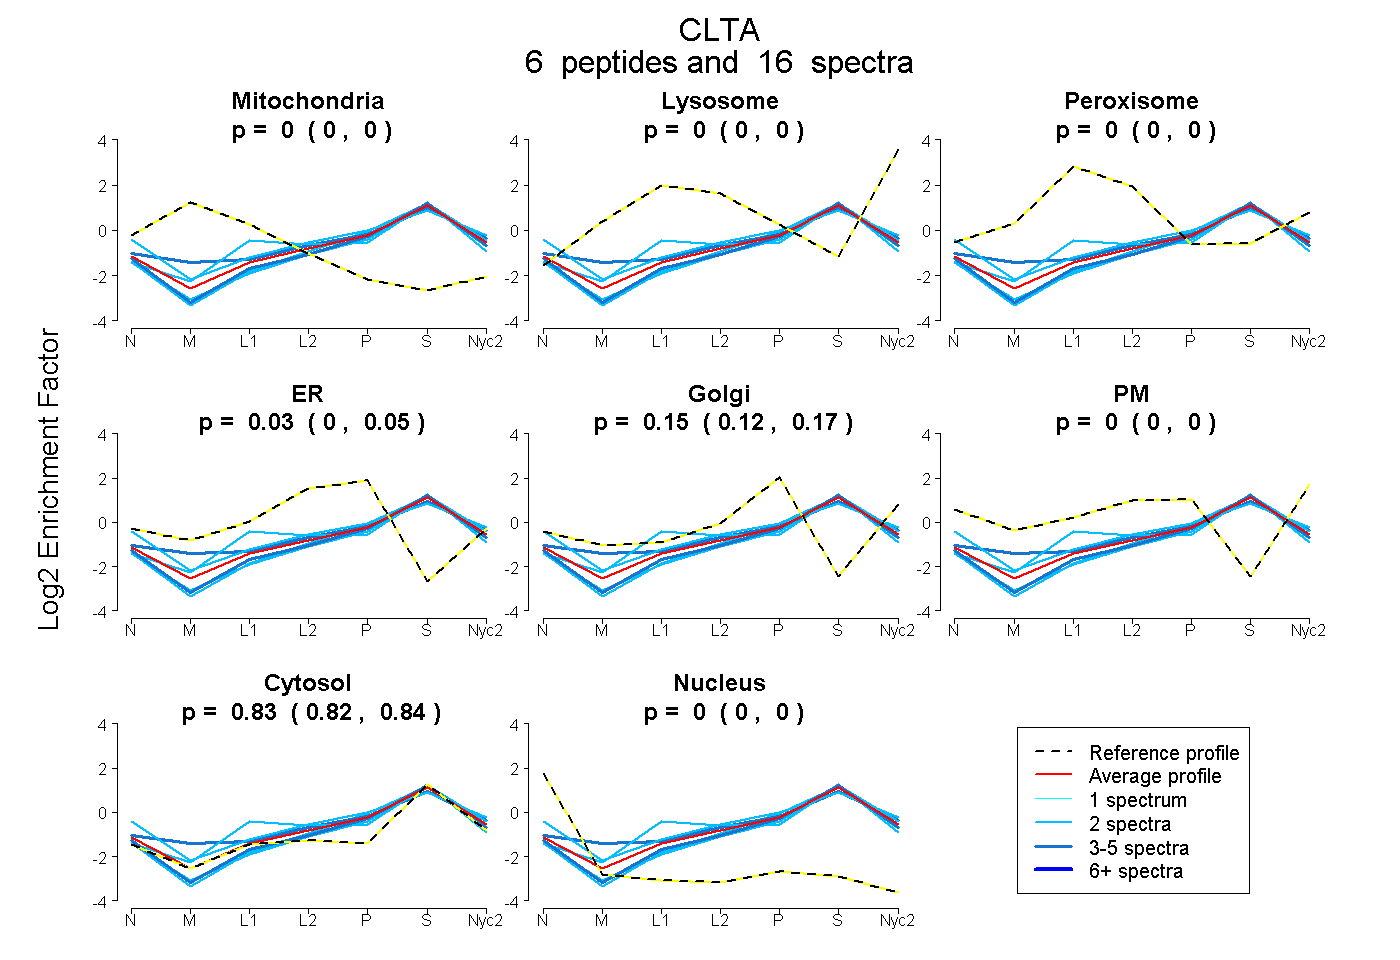
0.000 | 0.000
0.000 | 0.000
0.000 | 0.000
0.000 | 0.050
0.118 | 0.171
0.000 | 0.000
0.818 | 0.836
0.000 | 0.000
3peptides
spectra
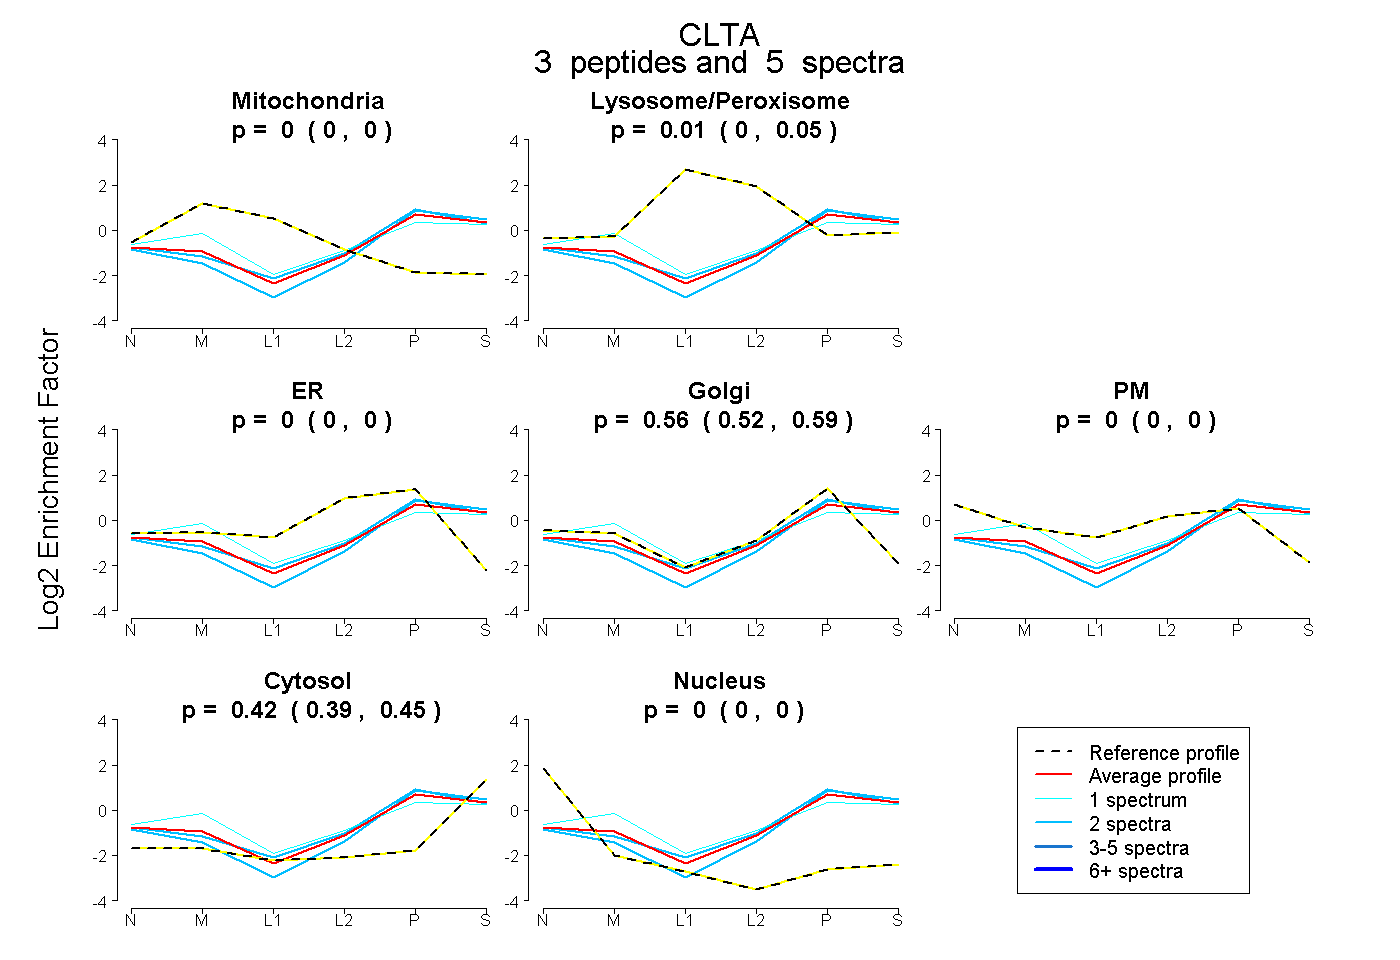
0.000 | 0.000
0.000 | 0.049
0.000 | 0.000
0.524 | 0.589
0.000 | 0.000
0.391 | 0.445
0.000 | 0.000
7peptides
spectra
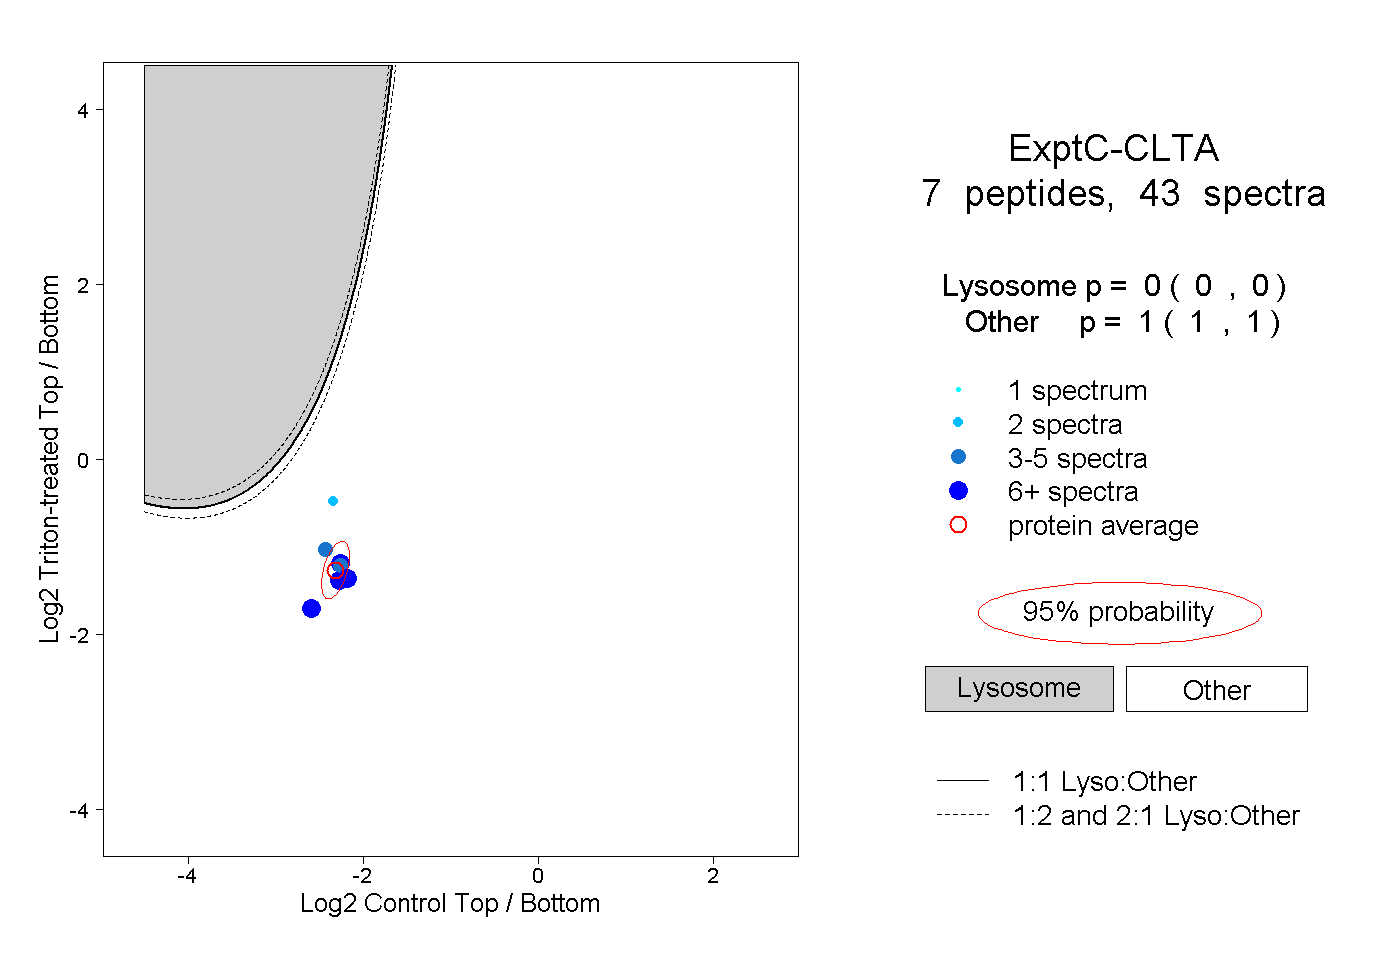
0.000 | 0.000
1.000 | 1.000
2peptides
spectra
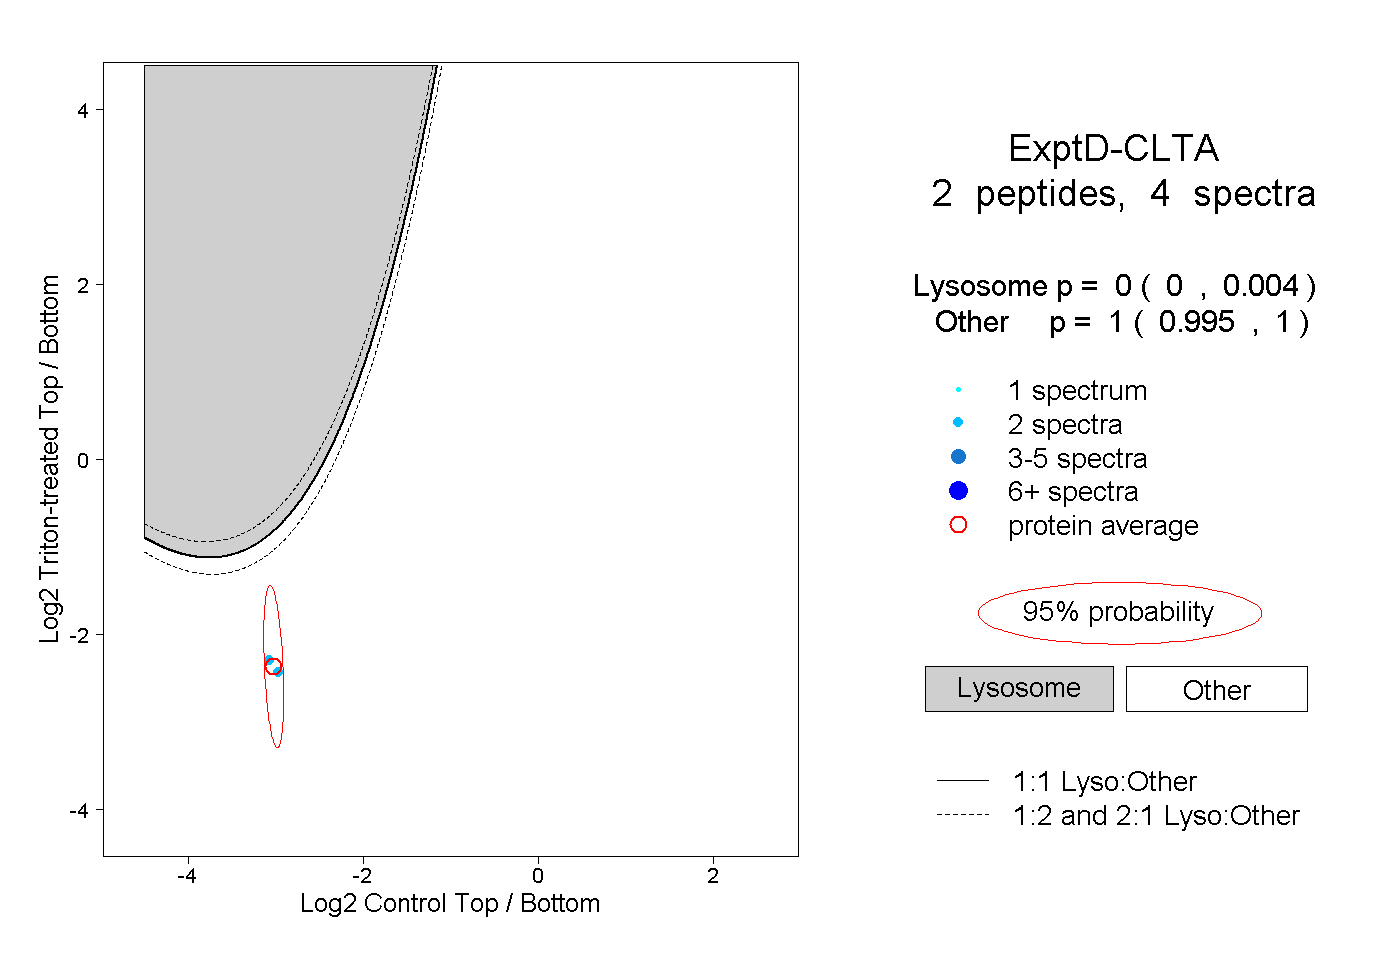
0.000 | 0.004
0.995 | 1.000