 6
6peptides
spectra
0.000 | 0.000
0.000 | 0.000
0.000 | 0.000
0.000 | 0.050
0.118 | 0.171
0.000 | 0.000
0.818 | 0.836
0.000 | 0.000
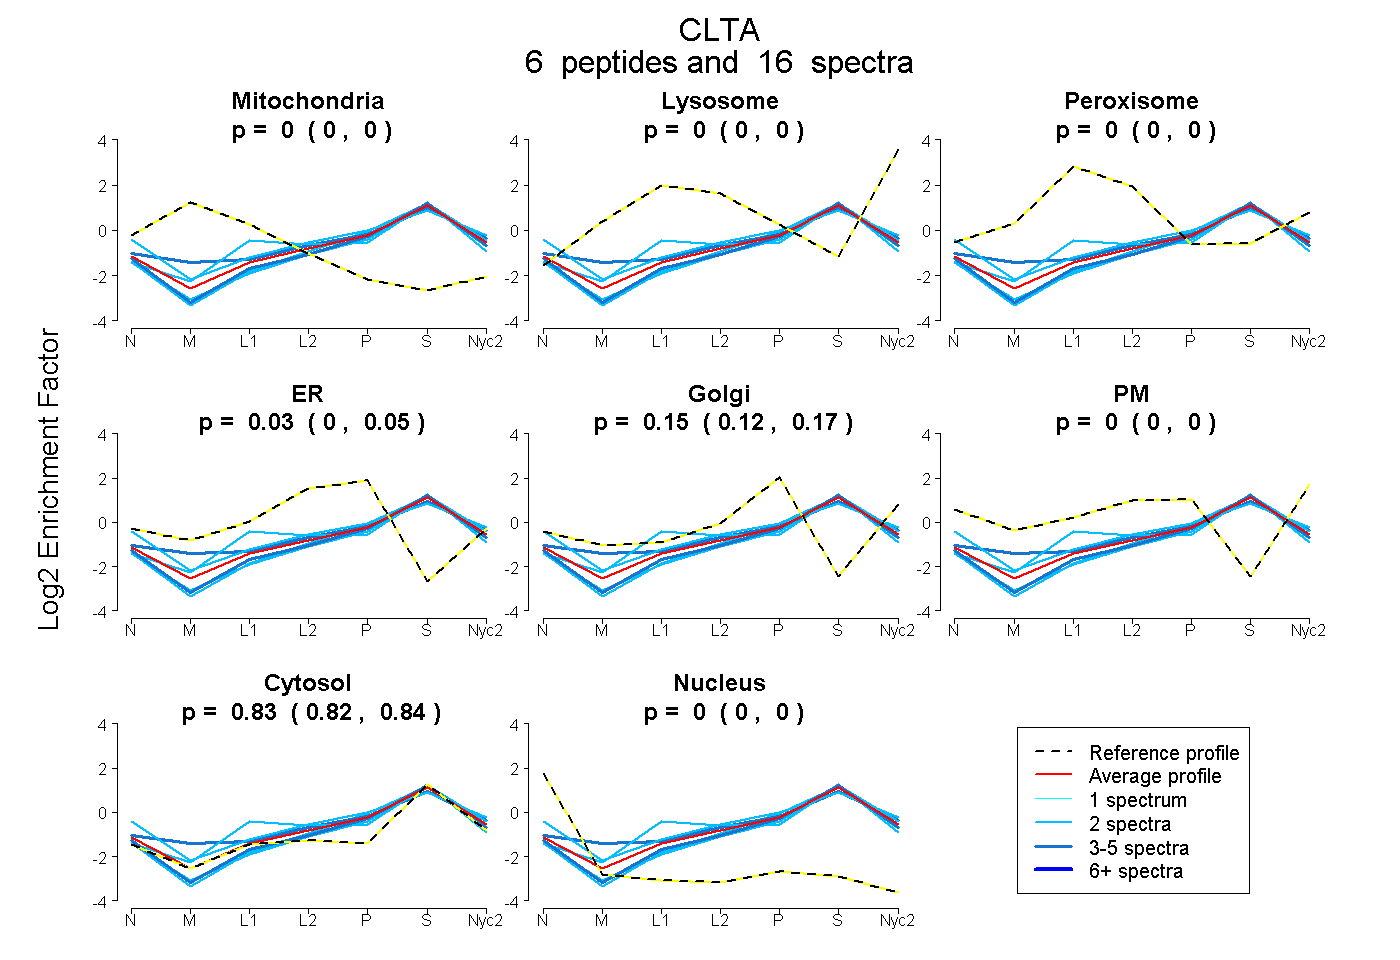
| Plot | Mito | Lyso | Perox | ER | Golgi | PM | Cytosol | Nucleus | |||||
| Expt A |
6 peptides |
16 spectra |
|
0.000 0.000 | 0.000 |
0.000 0.000 | 0.000 |
0.000 0.000 | 0.000 |
0.025 0.000 | 0.050 |
0.147 0.118 | 0.171 |
0.000 0.000 | 0.000 |
0.827 0.818 | 0.836 |
0.000 0.000 | 0.000 |
| 4 spectra, QAPLVH | 0.000 | 0.000 | 0.000 | 0.000 | 0.110 | 0.000 | 0.890 | 0.000 | ||
| 2 spectra, LQSEPESIR | 0.000 | 0.050 | 0.120 | 0.036 | 0.000 | 0.000 | 0.794 | 0.000 | ||
| 4 spectra, LEALDANSR | 0.000 | 0.020 | 0.057 | 0.000 | 0.211 | 0.000 | 0.711 | 0.000 | ||
| 2 spectra, SVIISIK | 0.000 | 0.000 | 0.000 | 0.016 | 0.112 | 0.153 | 0.719 | 0.000 | ||
| 2 spectra, LCDFNPK | 0.000 | 0.000 | 0.000 | 0.000 | 0.075 | 0.000 | 0.925 | 0.000 | ||
| 2 spectra, ELEEWYAR | 0.000 | 0.000 | 0.000 | 0.000 | 0.121 | 0.000 | 0.879 | 0.000 |
| Plot | Mito | Lyso or Perox | ER | Golgi | PM | Cytosol | Nucleus | ||||||
| Expt B |
3 peptides |
5 spectra |
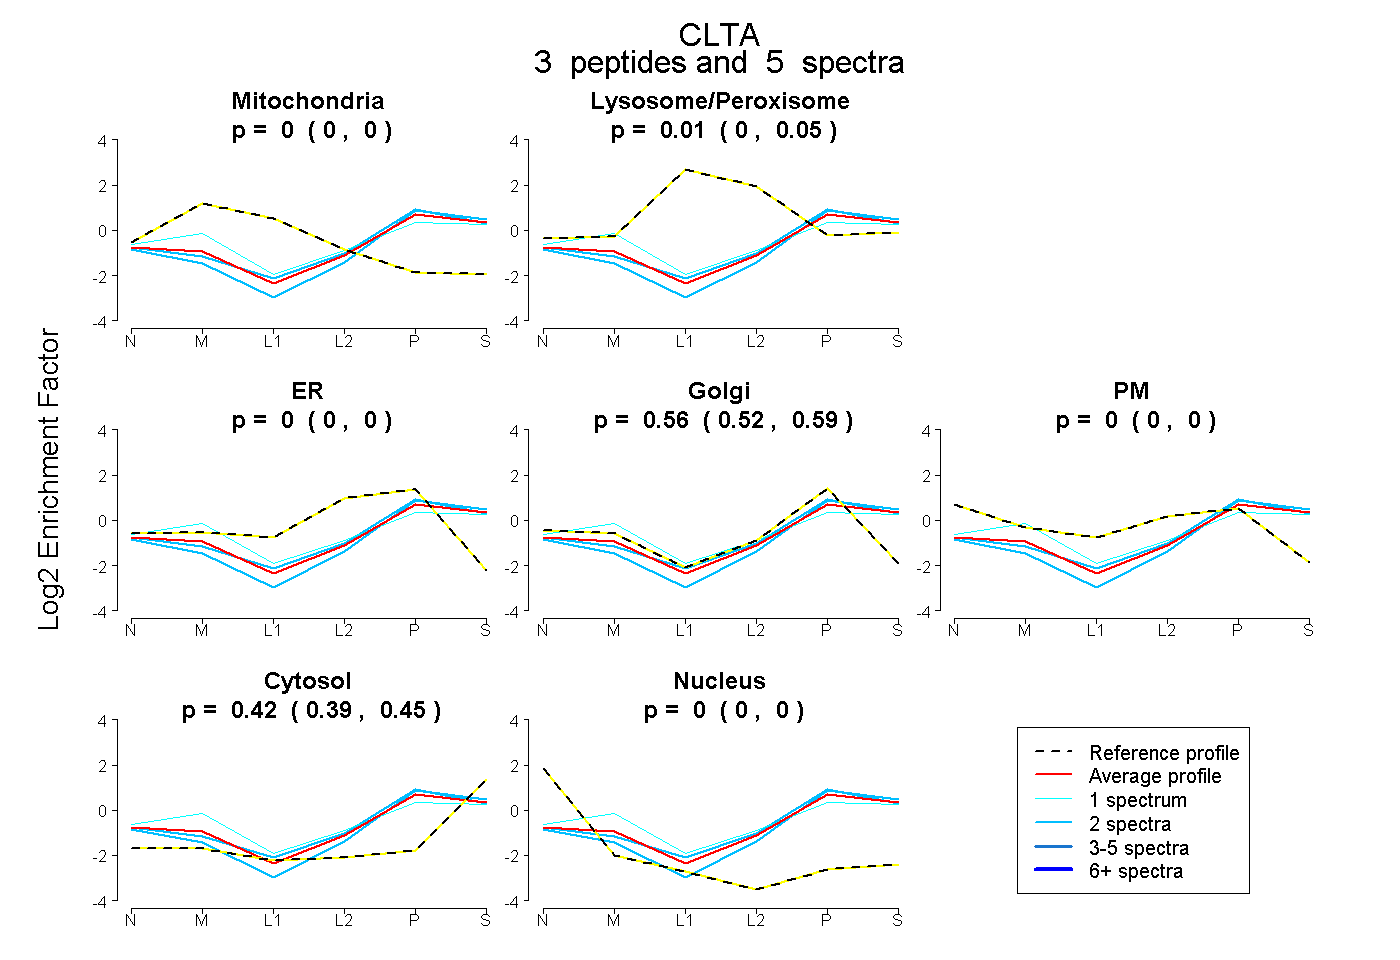 |
0.000 0.000 | 0.000 |
0.013 0.000 | 0.049 |
0.000 0.000 | 0.000 |
0.565 0.524 | 0.589 |
0.000 0.000 | 0.000 |
0.422 0.391 | 0.445 |
0.000 0.000 | 0.000 |
|||
| Plot | Lyso | Other | |||||||||||
| Expt C |
7 peptides |
43 spectra |
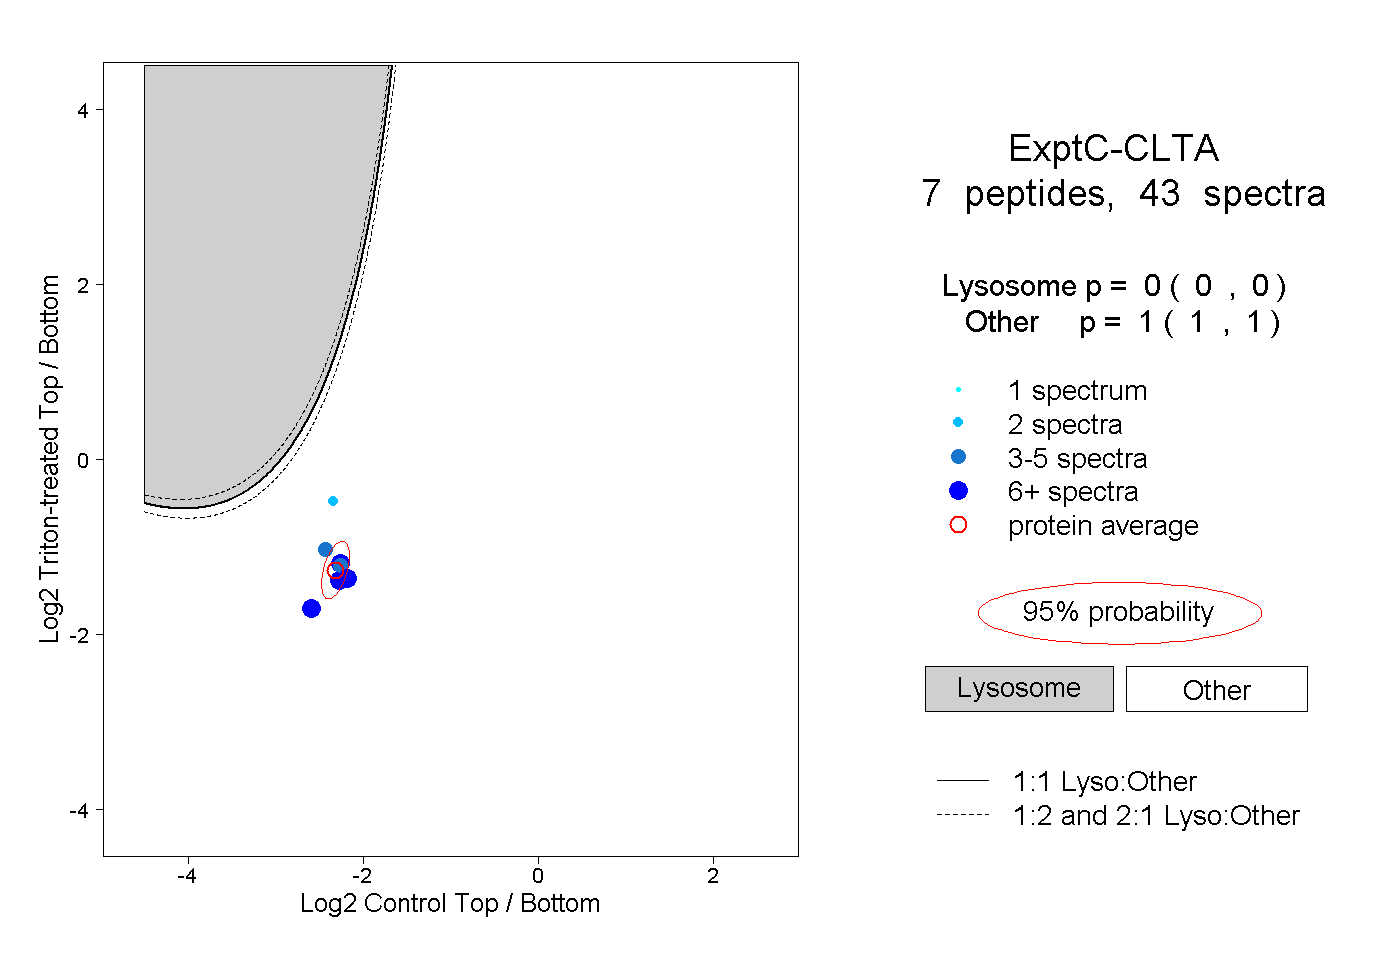 |
0.000 0.000 | 0.000 |
1.000 1.000 | 1.000 |
||||||||
| Plot | Lyso | Other | |||||||||||
| Expt D |
2 peptides |
4 spectra |
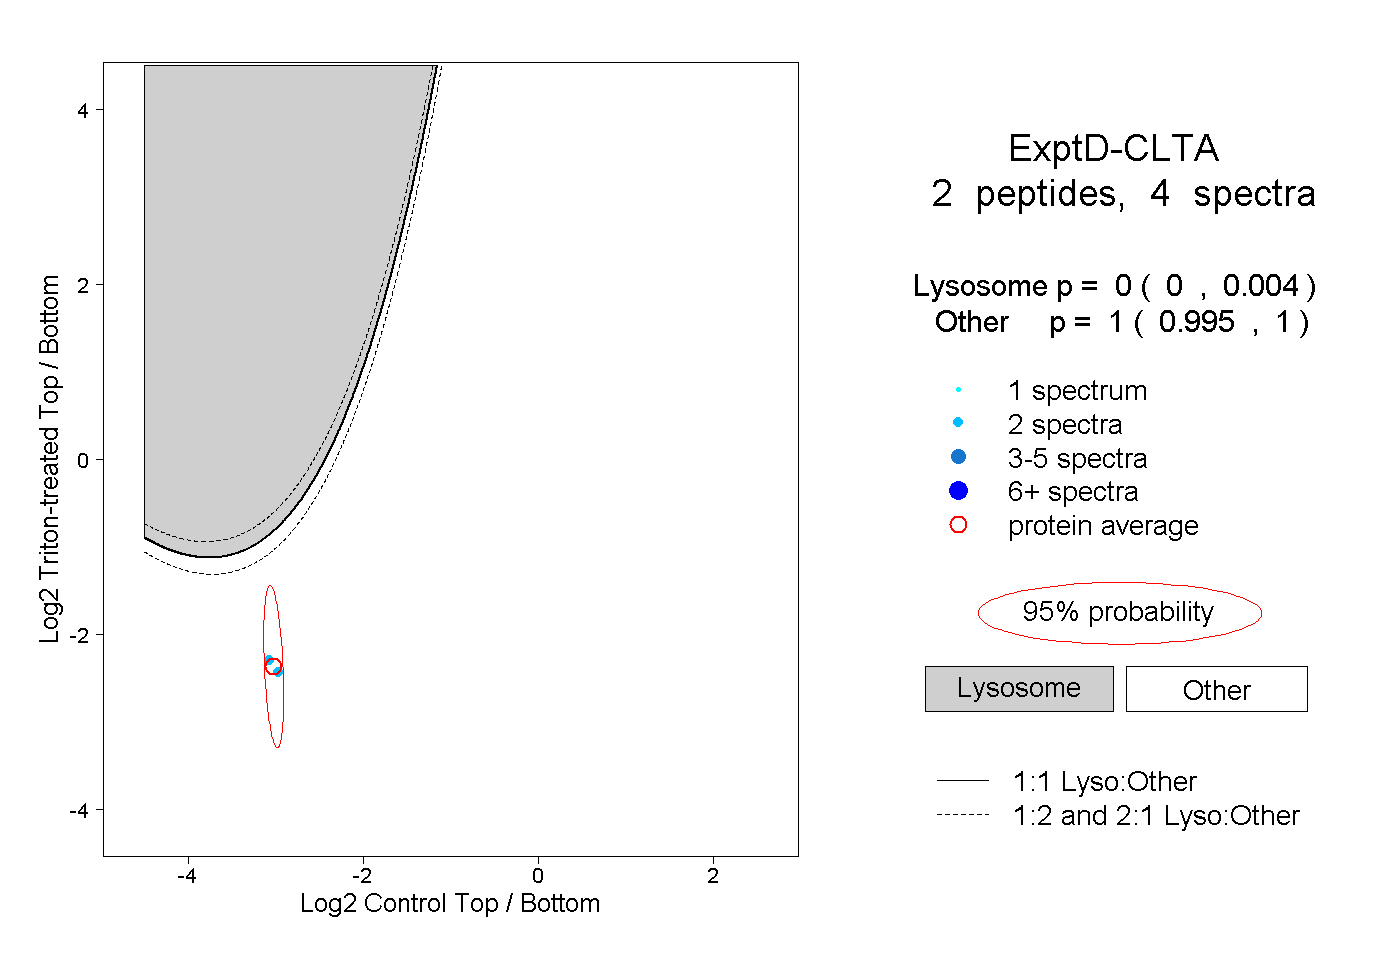 |
0.000 0.000 | 0.004 |
1.000 0.995 | 1.000 |