 5
5peptides
spectra
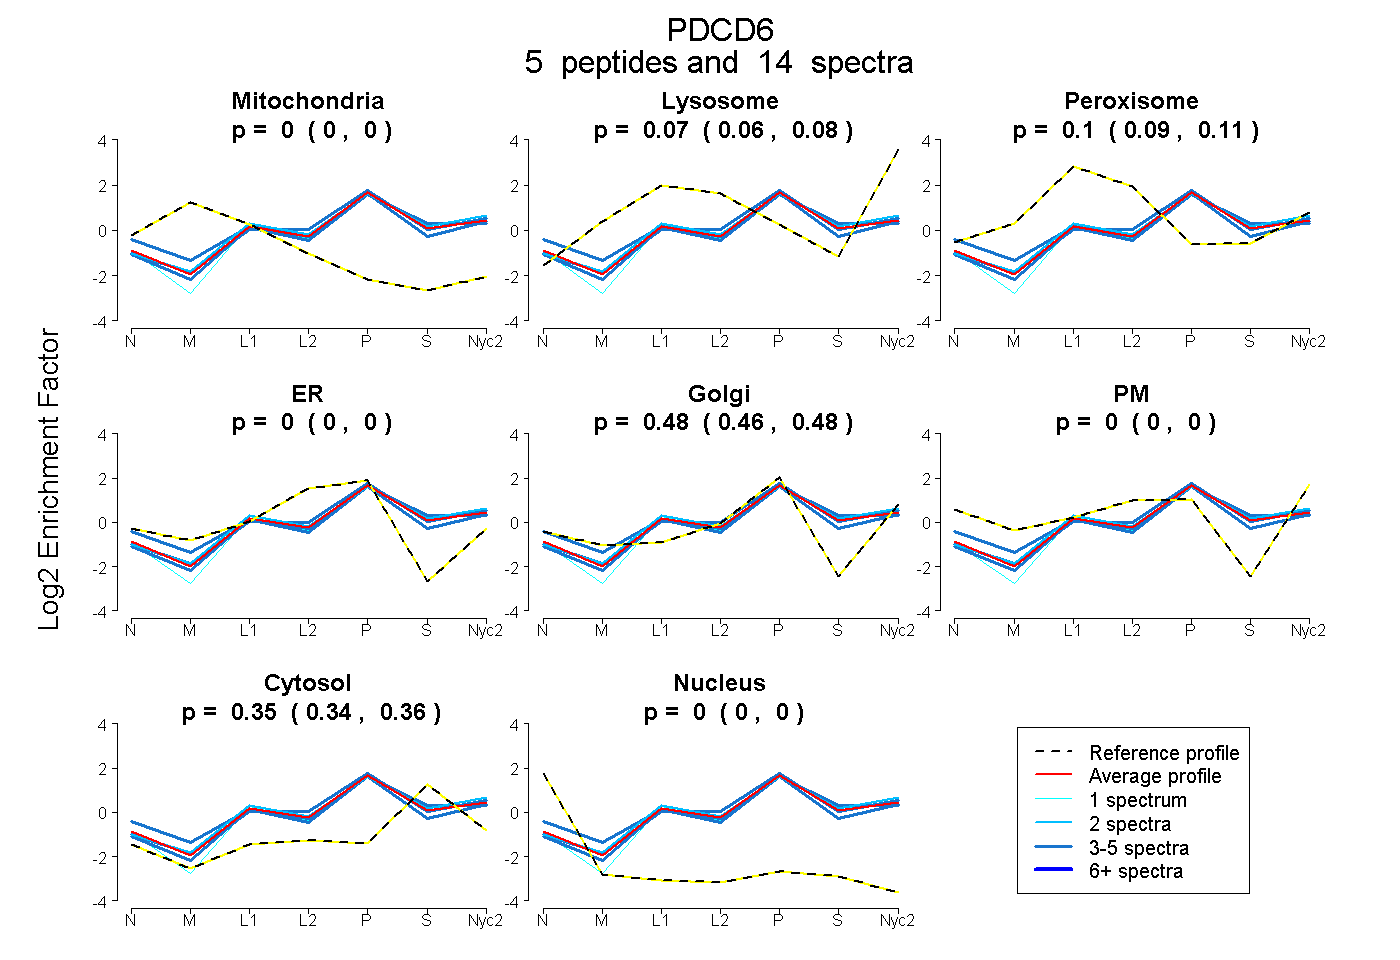
0.000 | 0.000
0.055 | 0.084
0.086 | 0.114
0.000 | 0.000
0.464 | 0.484
0.000 | 0.000
0.341 | 0.361
0.000 | 0.000
5peptides
spectra
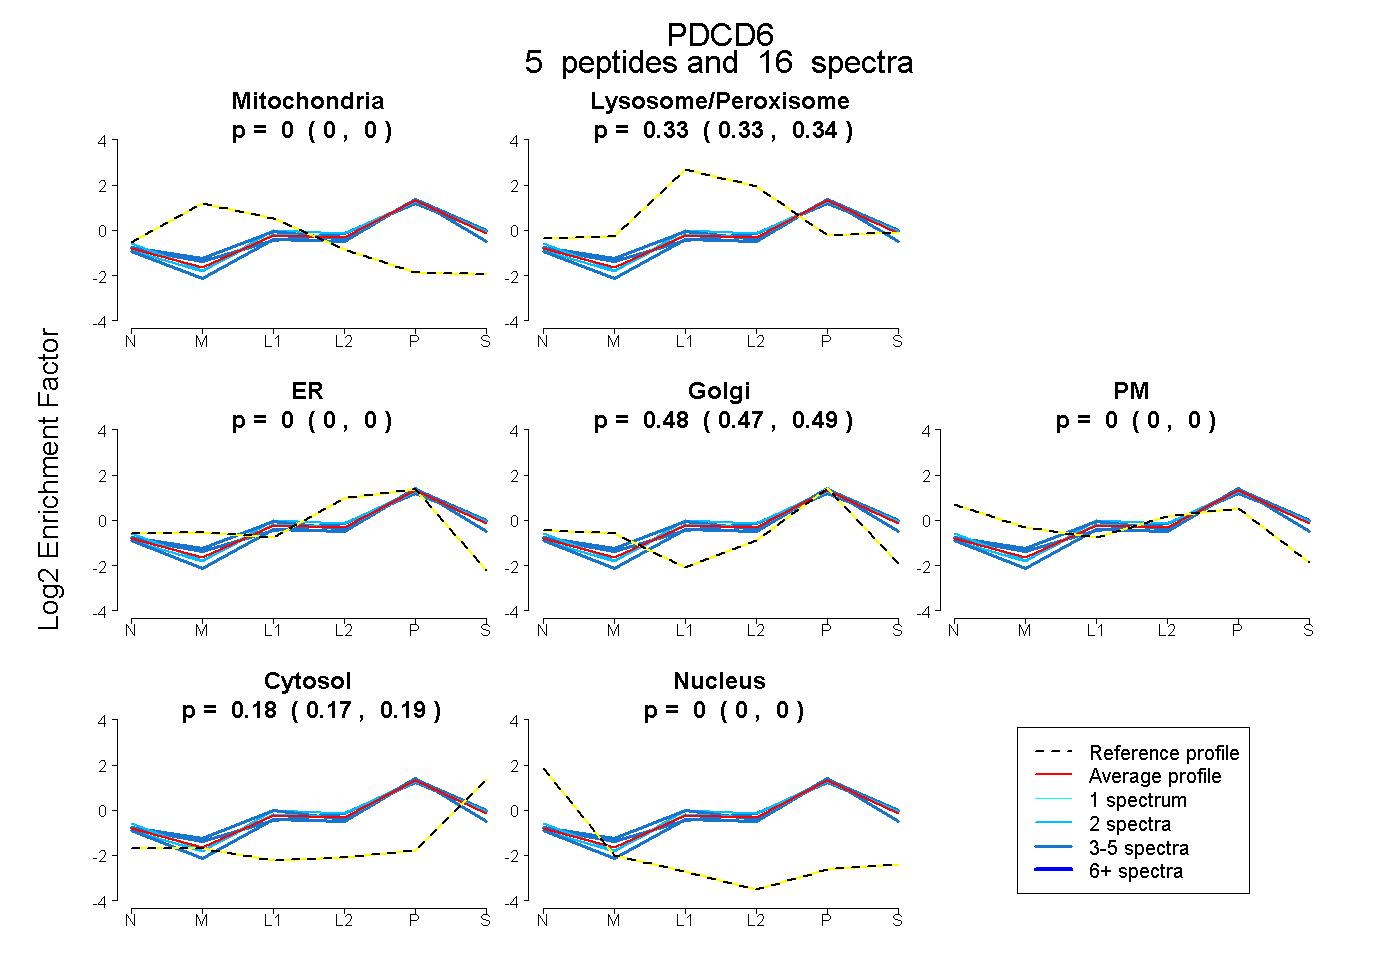
0.000 | 0.000
0.327 | 0.341
0.000 | 0.000
0.473 | 0.490
0.000 | 0.000
0.174 | 0.190
0.000 | 0.000
7peptides
spectra
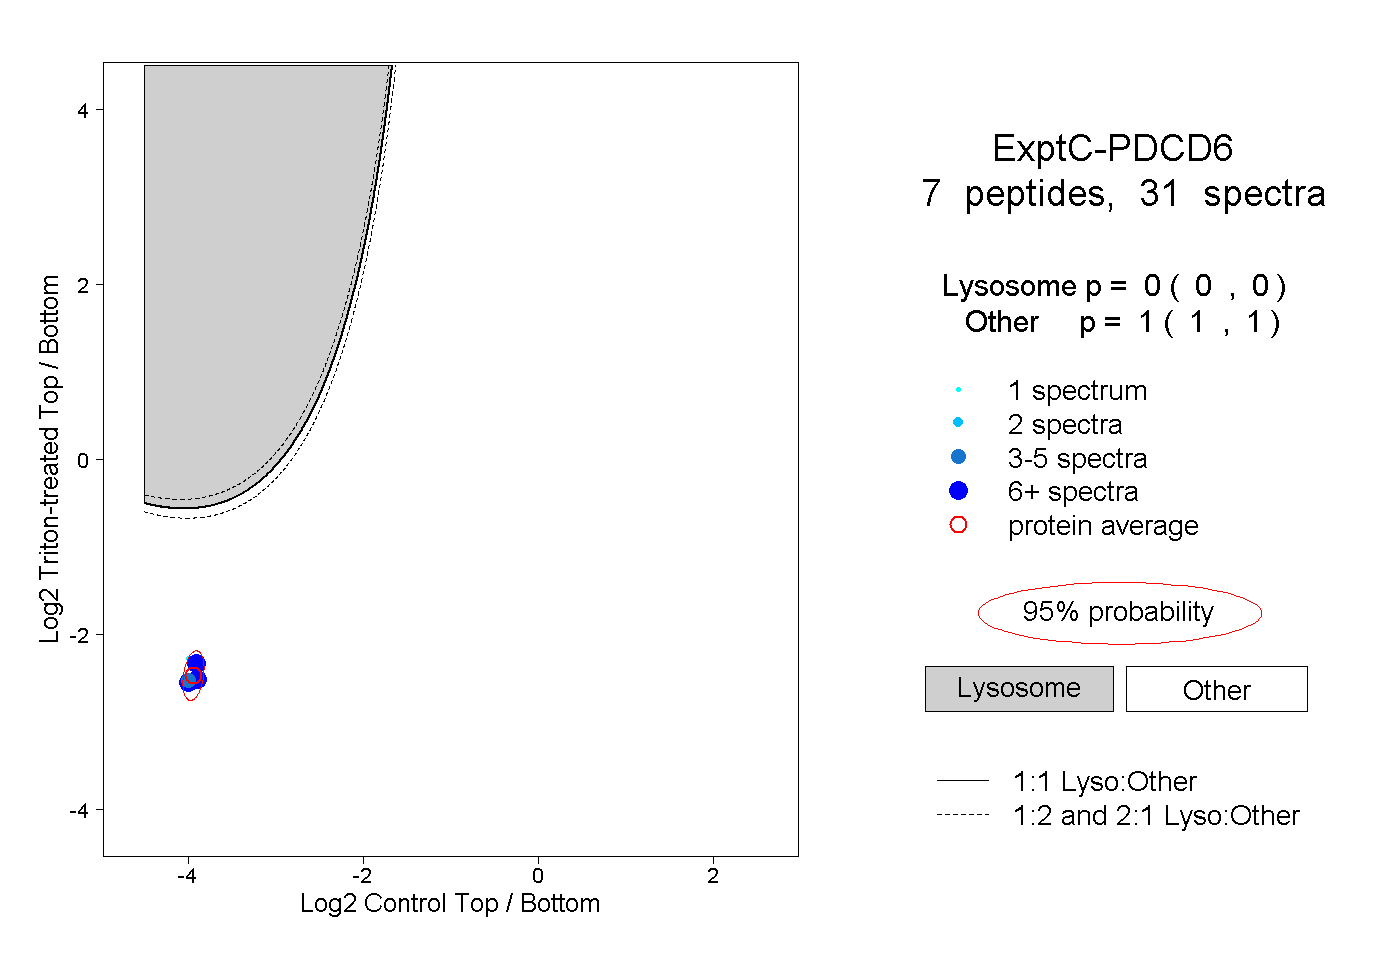
0.000 | 0.000
1.000 | 1.000
3peptides
spectra

0.000 | 0.002
0.998 | 1.000