 5
5peptides
spectra
0.000 | 0.000
0.055 | 0.084
0.086 | 0.114
0.000 | 0.000
0.464 | 0.484
0.000 | 0.000
0.341 | 0.361
0.000 | 0.000
| Plot | Mito | Lyso | Perox | ER | Golgi | PM | Cytosol | Nucleus | |||||
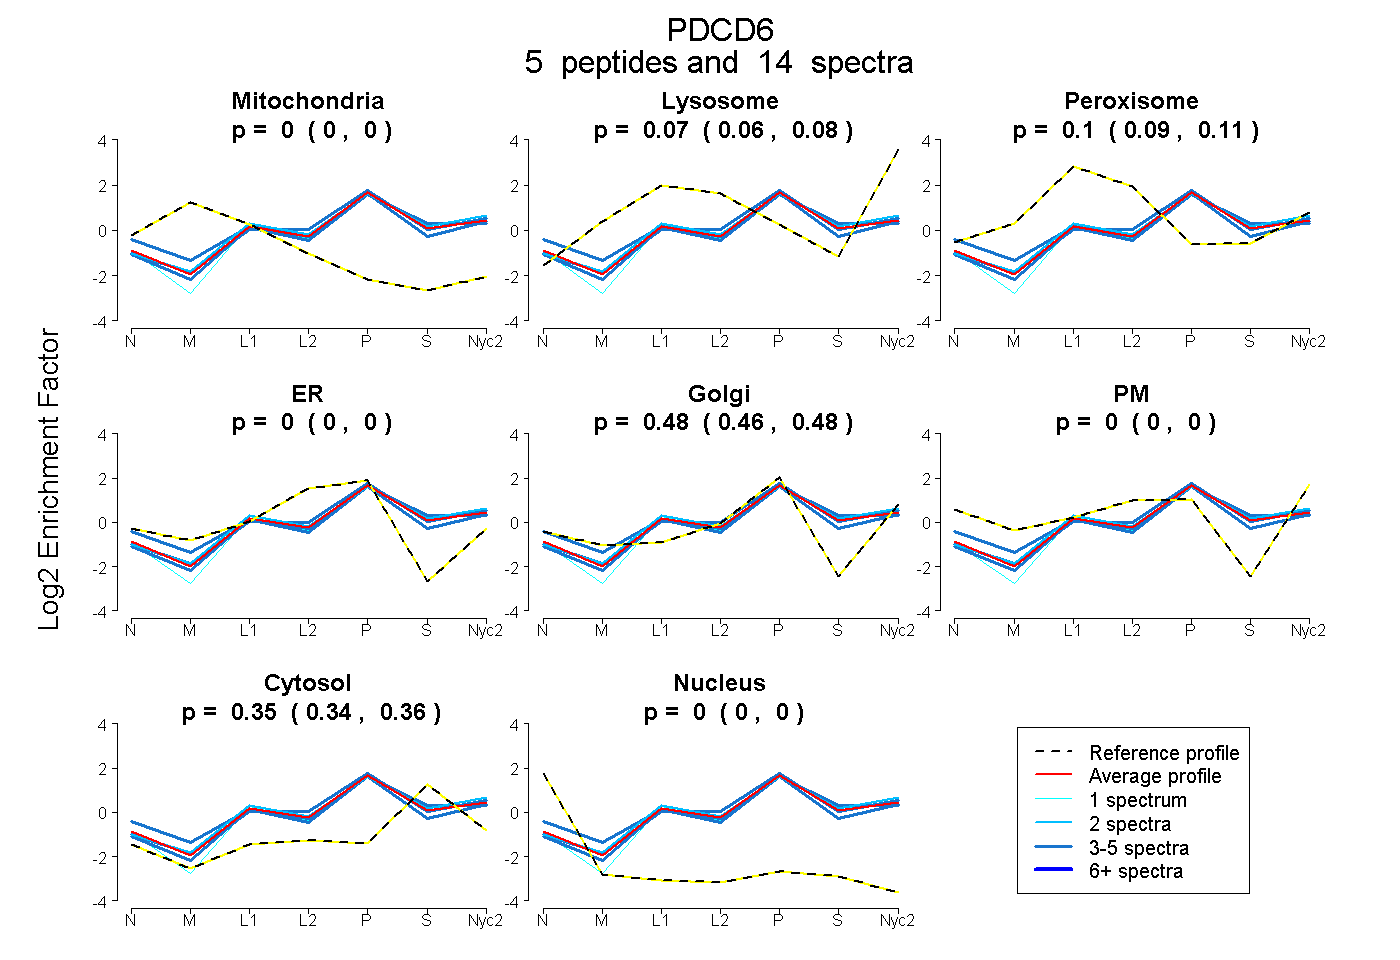
| Expt A |
5 peptides |
14 spectra |
|
0.000 0.000 | 0.000 |
0.072 0.055 | 0.084 |
0.102 0.086 | 0.114 |
0.000 0.000 | 0.000 |
0.475 0.464 | 0.484 |
0.000 0.000 | 0.000 |
0.351 0.341 | 0.361 |
0.000 0.000 | 0.000 |
| 3 spectra, QALSGFGYR | 0.000 | 0.000 | 0.188 | 0.000 | 0.557 | 0.000 | 0.255 | 0.000 | ||
| 4 spectra, LTDIFR | 0.000 | 0.163 | 0.000 | 0.136 | 0.346 | 0.000 | 0.355 | 0.000 | ||
| 2 spectra, YITDWQNVFR | 0.000 | 0.155 | 0.075 | 0.000 | 0.418 | 0.000 | 0.352 | 0.000 | ||
| 1 spectrum, AGVNFSEFTGVWK | 0.000 | 0.073 | 0.031 | 0.081 | 0.385 | 0.000 | 0.431 | 0.000 | ||
| 4 spectra, SIISMFDR | 0.000 | 0.081 | 0.063 | 0.000 | 0.437 | 0.000 | 0.420 | 0.000 |
| Plot | Mito | Lyso or Perox | ER | Golgi | PM | Cytosol | Nucleus | ||||||
| Expt B |
5 peptides |
16 spectra |
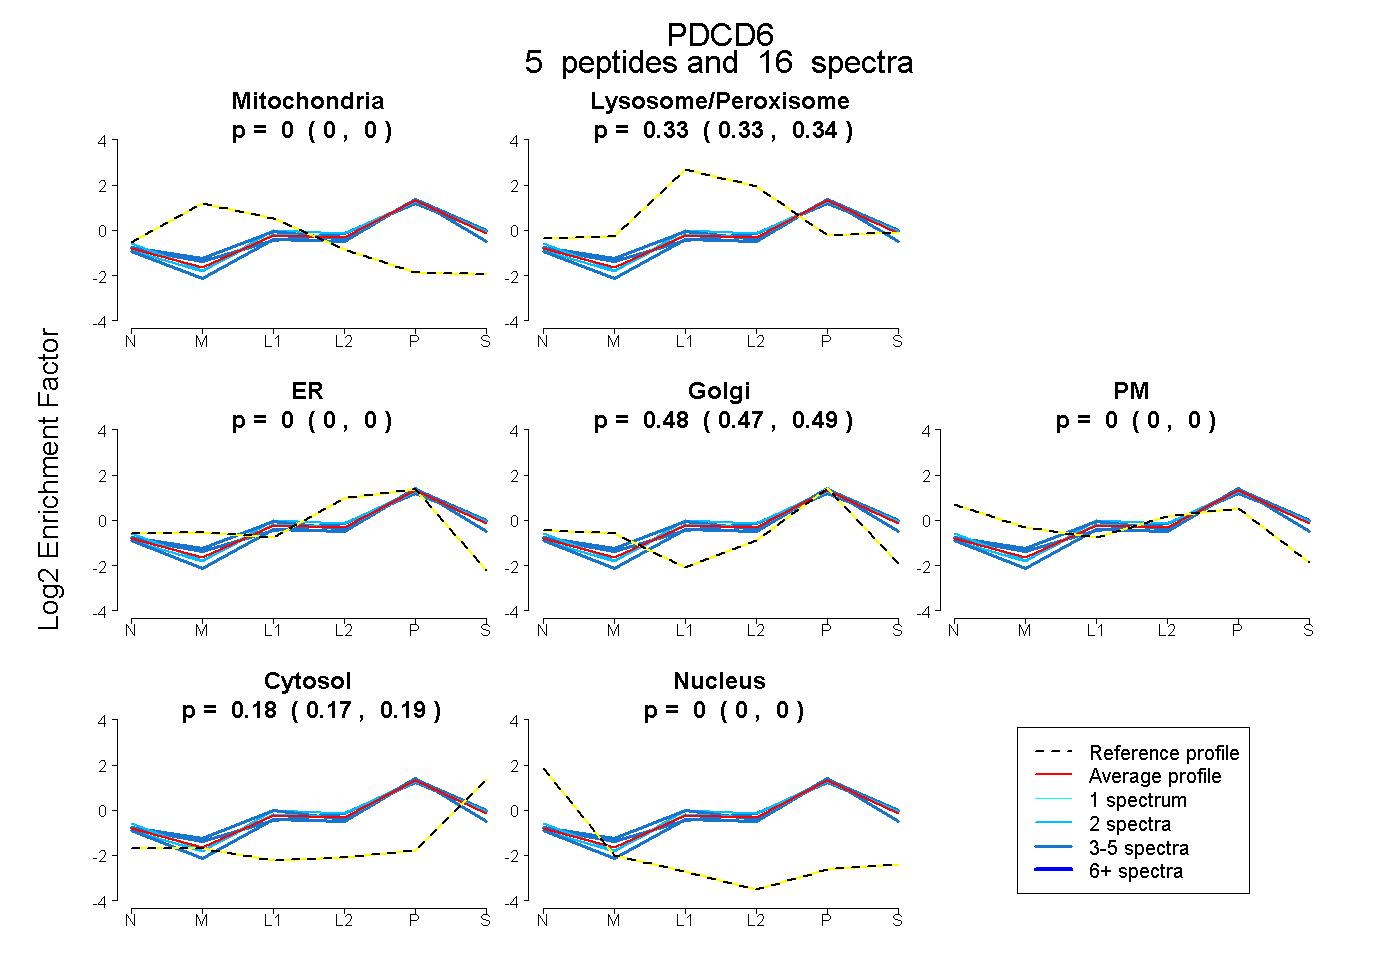 |
0.000 0.000 | 0.000 |
0.335 0.327 | 0.341 |
0.000 0.000 | 0.000 |
0.482 0.473 | 0.490 |
0.000 0.000 | 0.000 |
0.183 0.174 | 0.190 |
0.000 0.000 | 0.000 |
|||
| Plot | Lyso | Other | |||||||||||
| Expt C |
7 peptides |
31 spectra |
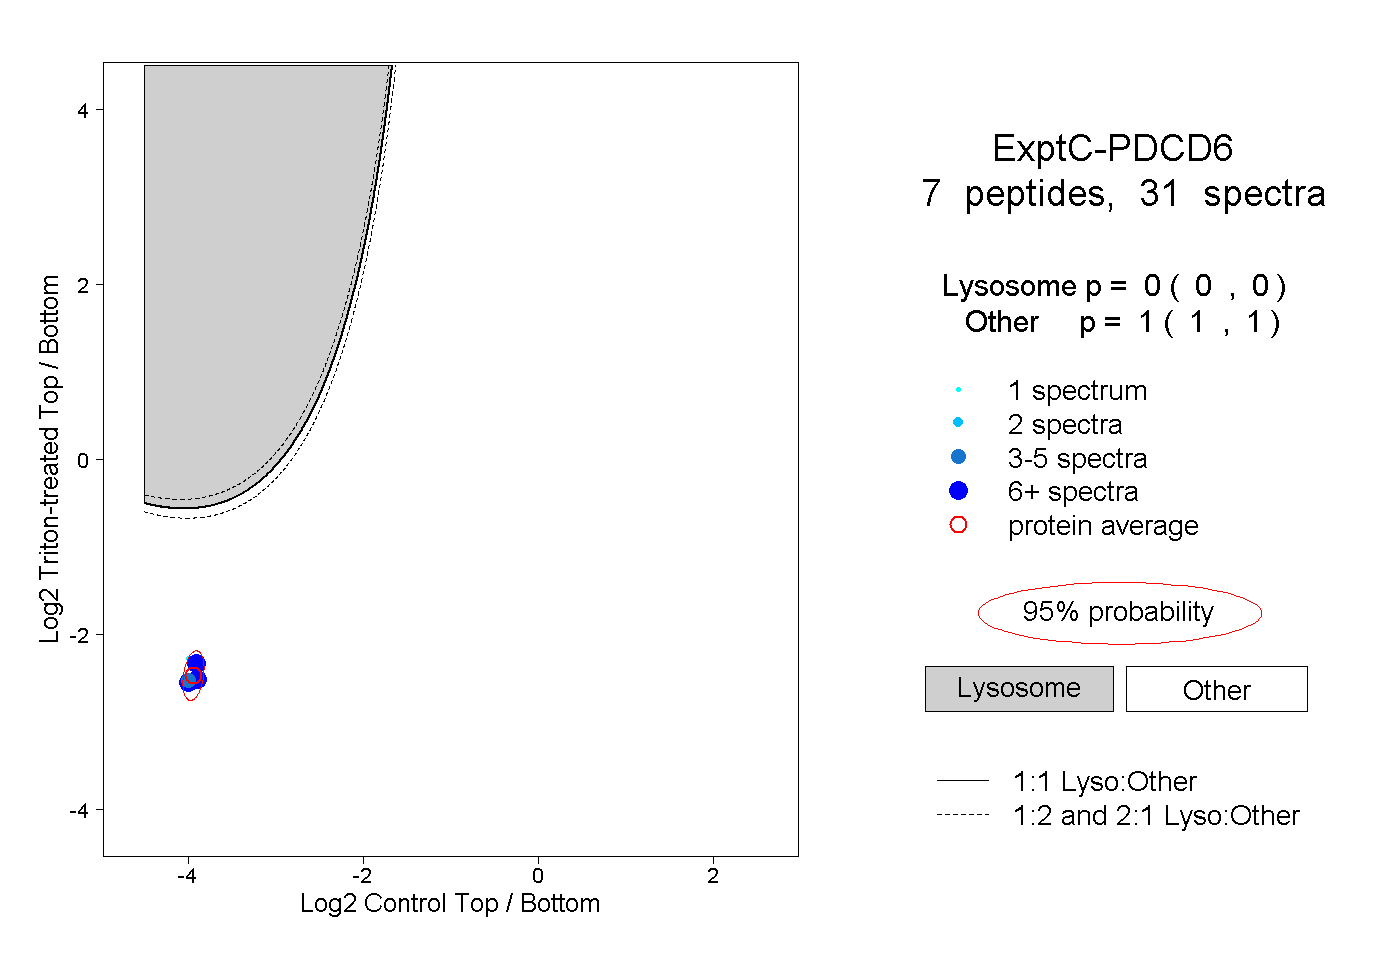 |
0.000 0.000 | 0.000 |
1.000 1.000 | 1.000 |
||||||||
| Plot | Lyso | Other | |||||||||||
| Expt D |
3 peptides |
4 spectra |
 |
0.000 0.000 | 0.002 |
1.000 0.998 | 1.000 |