 3
3peptides
spectra
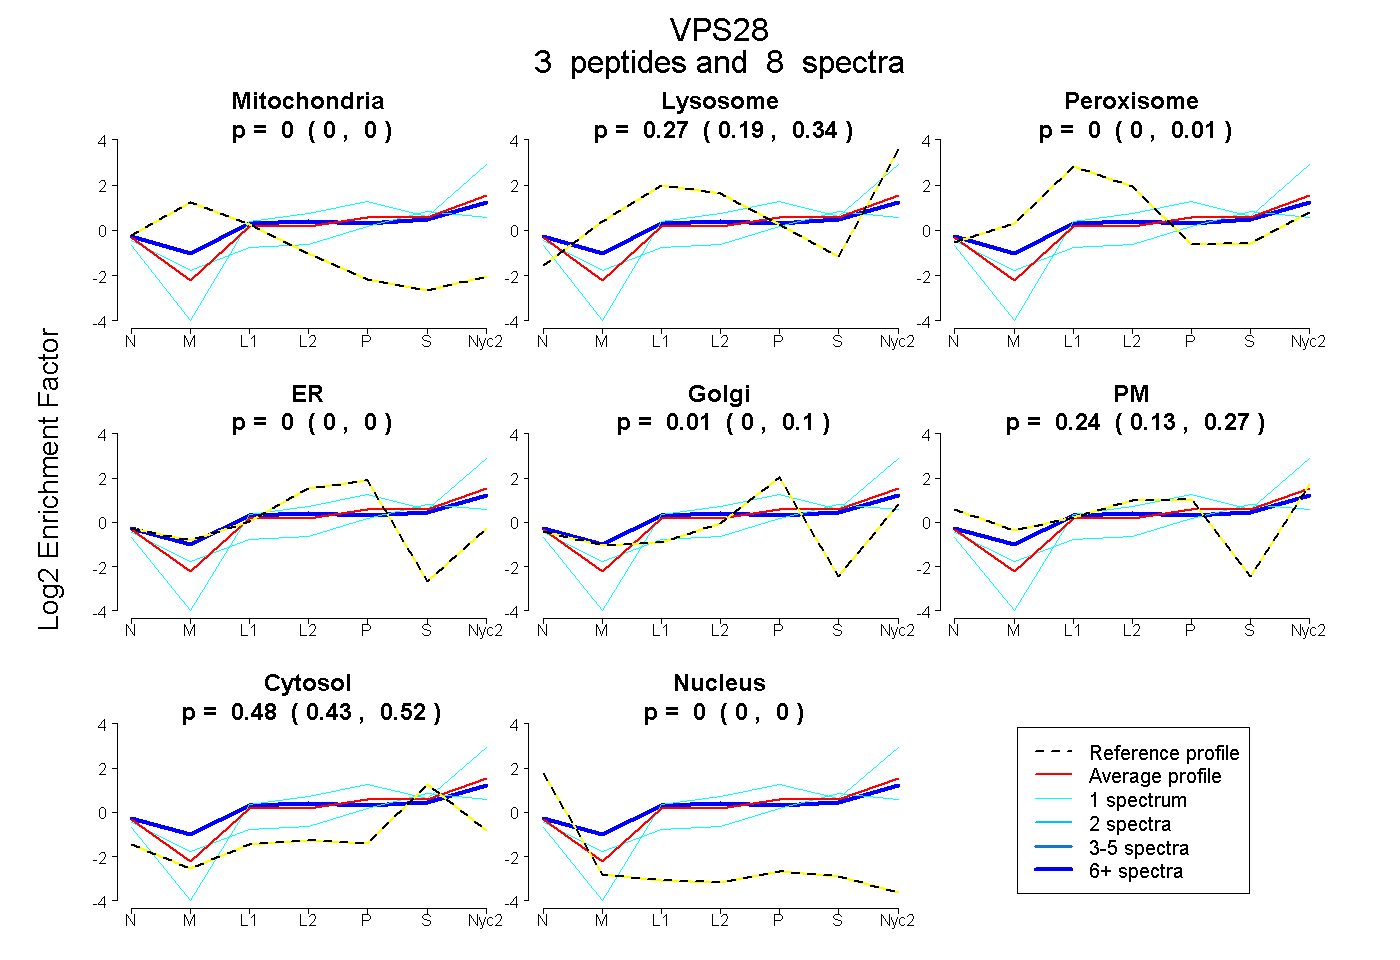
0.000 | 0.000
0.195 | 0.337
0.000 | 0.008
0.000 | 0.000
0.000 | 0.102
0.134 | 0.272
0.427 | 0.516
0.000 | 0.000
6peptides
spectra
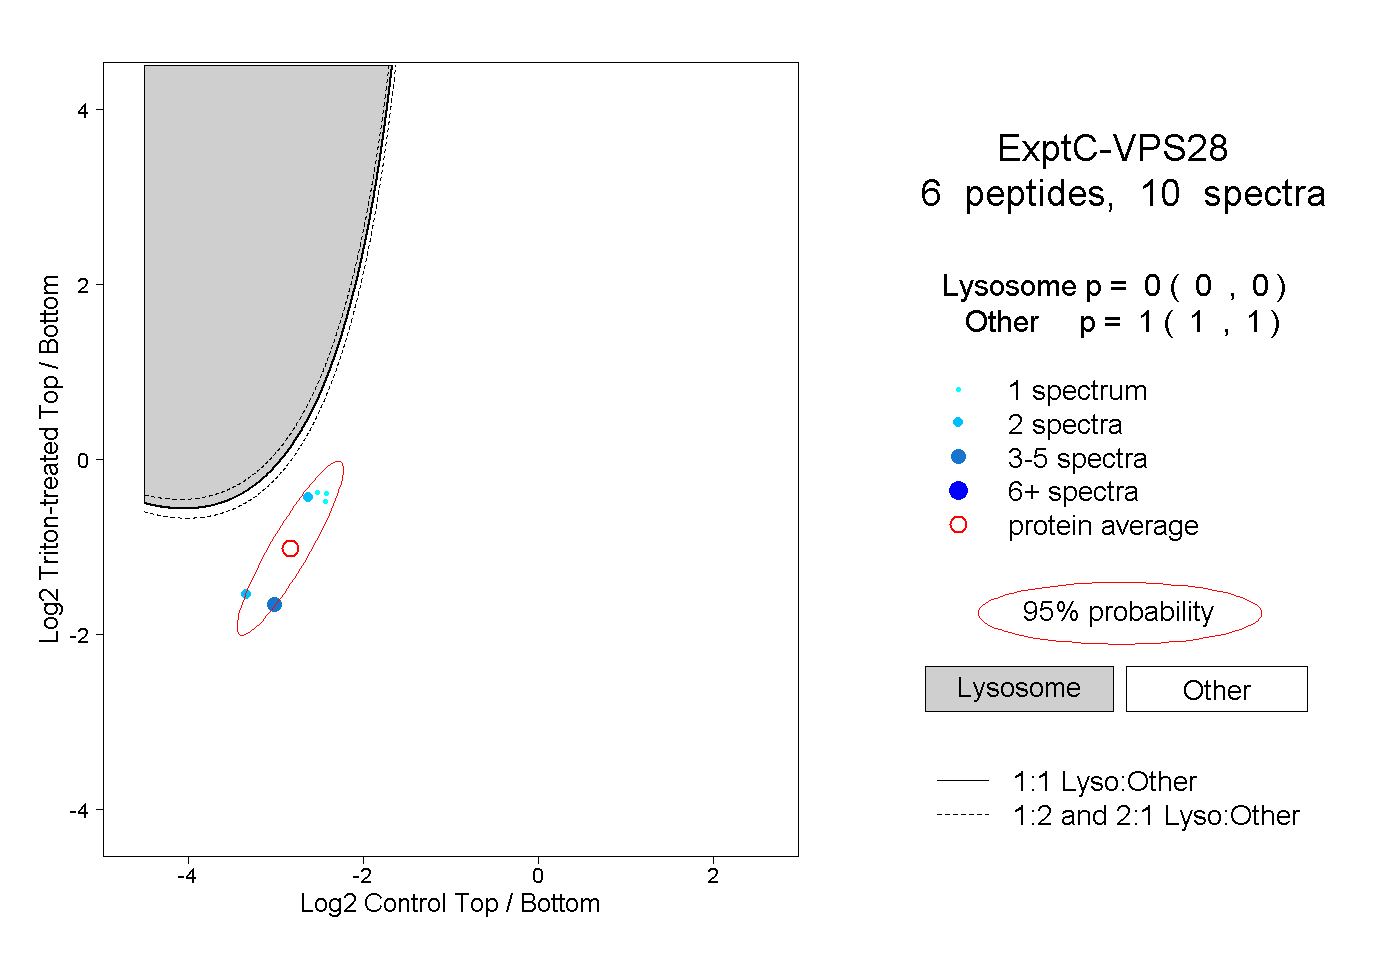
0.000 | 0.000
1.000 | 1.000
1peptide
spectra
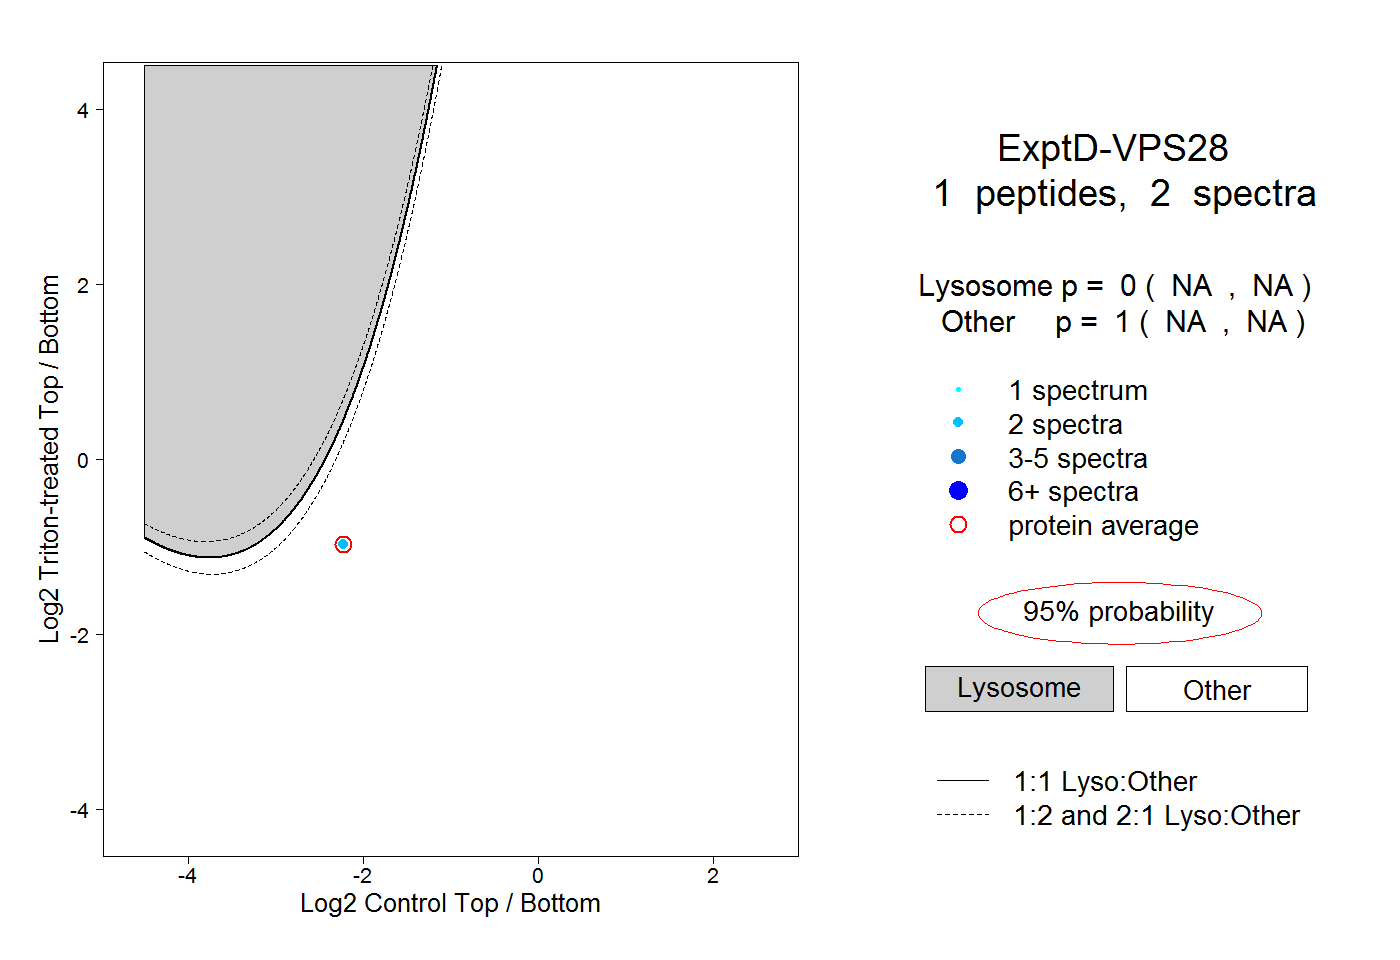
NA | NA
NA | NA