 3
3peptides
spectra
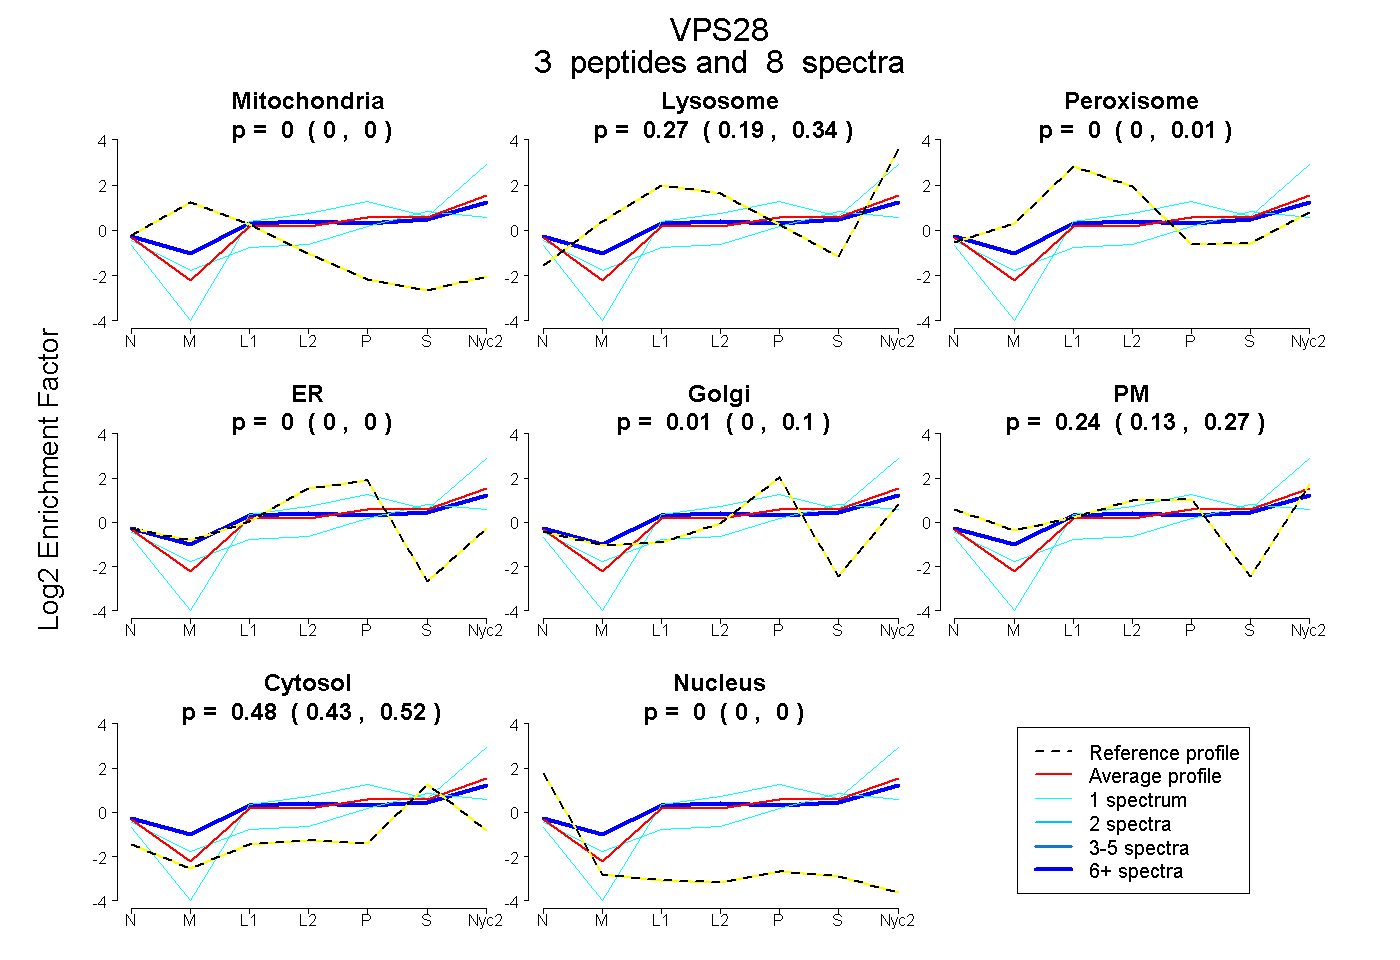
0.000 | 0.000
0.195 | 0.337
0.000 | 0.008
0.000 | 0.000
0.000 | 0.102
0.134 | 0.272
0.427 | 0.516
0.000 | 0.000
| Plot | Mito | Lyso | Perox | ER | Golgi | PM | Cytosol | Nucleus | |||||
| Expt A |
3 peptides |
8 spectra |
|
0.000 0.000 | 0.000 |
0.271 0.195 | 0.337 |
0.000 0.000 | 0.008 |
0.000 0.000 | 0.000 |
0.013 0.000 | 0.102 |
0.238 0.134 | 0.272 |
0.478 0.427 | 0.516 |
0.000 0.000 | 0.000 |
| 1 spectrum, LDCPLAMER | 0.000 | 0.099 | 0.000 | 0.000 | 0.095 | 0.176 | 0.629 | 0.000 | ||
| 6 spectra, AMDEIQPDLR | 0.000 | 0.229 | 0.119 | 0.000 | 0.000 | 0.250 | 0.402 | 0.000 | ||
| 1 spectrum, QVQGSEISSIDEFCR | 0.000 | 0.425 | 0.000 | 0.000 | 0.191 | 0.000 | 0.384 | 0.000 |
| Plot | Lyso | Other | |||||||||||
| Expt C |
6 peptides |
10 spectra |
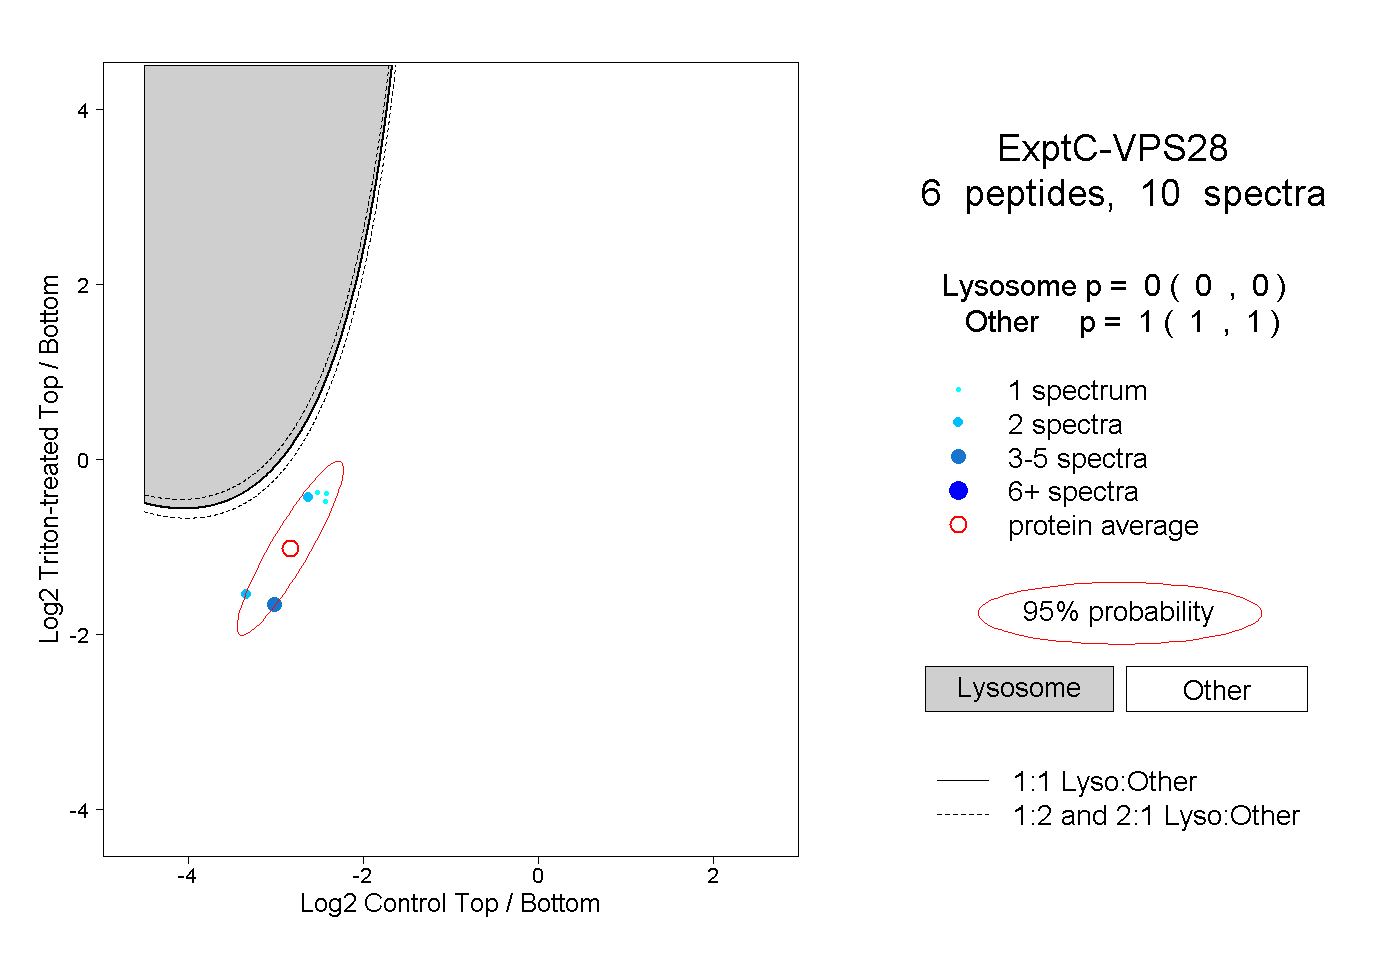 |
0.000 0.000 | 0.000 |
1.000 1.000 | 1.000 |
||||||||
| Plot | Lyso | Other | |||||||||||
| Expt D |
1 peptide |
2 spectra |
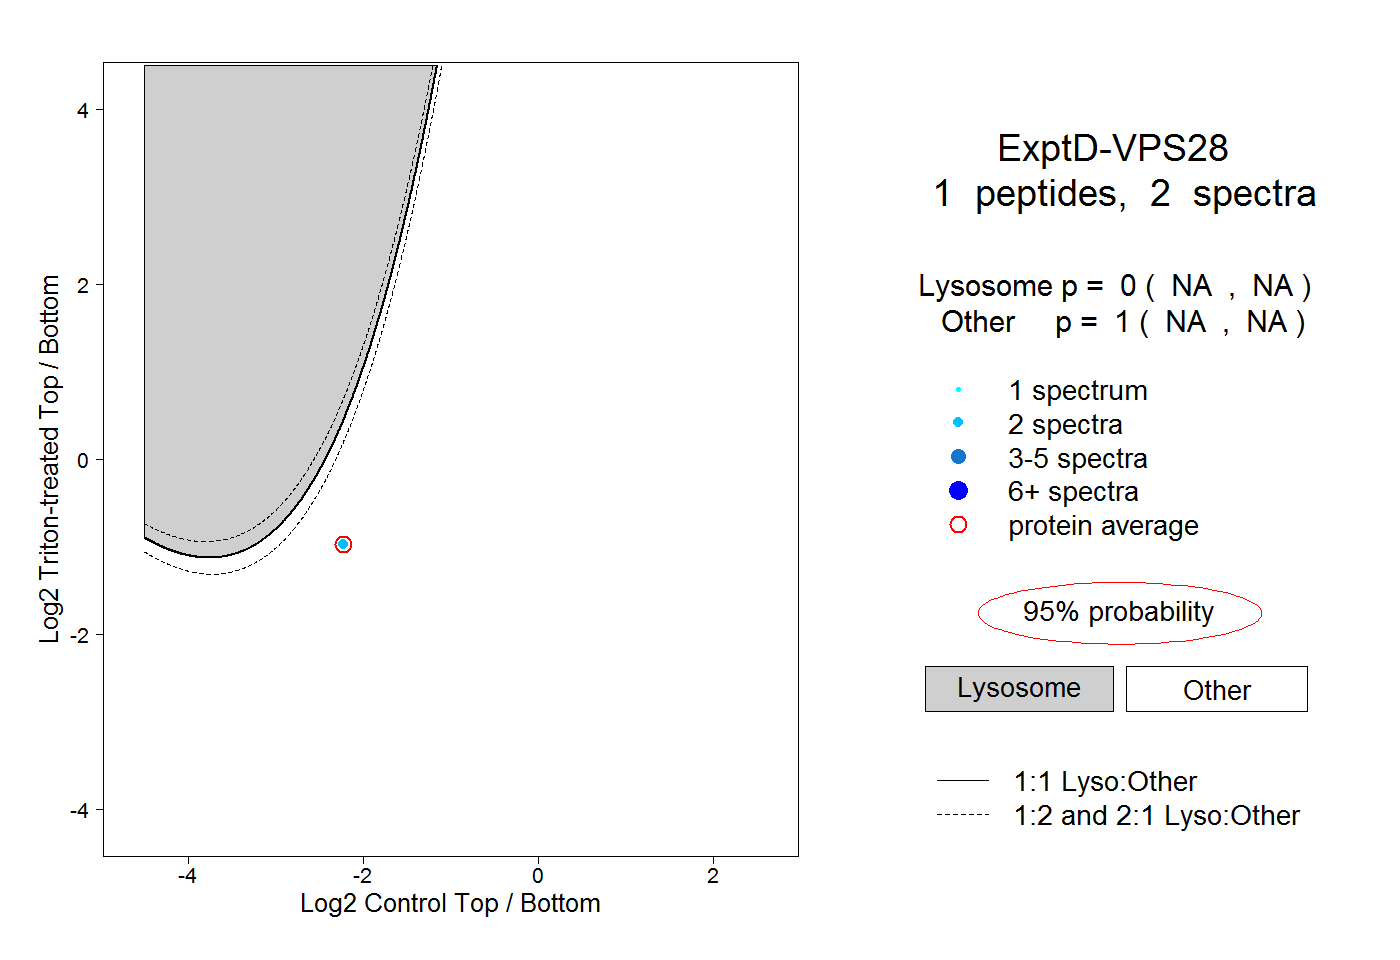 |
0.000 NA | NA |
1.000 NA | NA |